0635
Deuterium Metabolic Imaging of the Human Brain in vivo at 7T1Department of Radiology and Biomedical Imaging, Yale University, New Haven, CT, United States, 2High-Field MR Center, Max Planck Institute for Biological Cybernetics, Tuebingen, Germany, 3IMPRS for Cognitive and Systems Neuroscience, Eberhard-Karls University of Tuebingen, Tuebingen, Germany, 4Advanced Imaging Research Center, UT Southwestern Medical Center, Dallas, TX, United States
Synopsis
Brain energy metabolism, for which glucose is the main fuel, is essential not only for normal brain function but also for its active role in the mechanisms that underly brain diseases. Deuterium Metabolic Imaging (DMI) is a promising MR modality for investigating whole brain energy metabolism in humans at ultra-high field. In this study, we explore the potential of DMI in the human brain in vivo at 7T. We present whole brain 3D DMI maps of well-resolved deuterated (2H) metabolite resonances of water, glucose and glutamate/glutamine (Glx) following oral administration of [6,6’-2H2]-labelled glucose.
Introduction
Deuterium Metabolic Imaging (DMI) is an emerging non-invasive MR modality for investigating whole brain energy metabolism in vivo1-4. DMI is performed in combination with administration of a deuterated substrate, such as [6,6’-2H2]-glucose, providing information on active glucose metabolism. For instance, DMI allows the detection of physiological changes associated with brain diseases, such as the increase in deuterated lactate and the decrease of oxidative glucose metabolism leading to reduced 2H-labeling in glutamate/glutamine (Glx), often observed in the most aggressive brain tumour type, glioblastoma (GBM)1,2. The sensitivity of DMI has been shown to scale supralinear with the main magnetic field (de Graaf et al, 2020)5, such that use of ultra-high magnetic fields (≥7T) should demonstrate a markedly improved signal-to-noise ratio (SNR) and spectral resolution. In addition, a key advantage of DMI over other MR modalities is the low Specific Absorption Rate (SAR) due to the low gyromagnetic ratio of the 2H-nucleus, enabling use of short TR and making DMI in humans at ultra-high field a promising MR modality for application in patients. The aim of this study was thus to develop, implement and validate DMI in the human brain in vivo on a Siemens 7T human scanner, based on the recent implementation on a Siemens 9.4T3.Methods
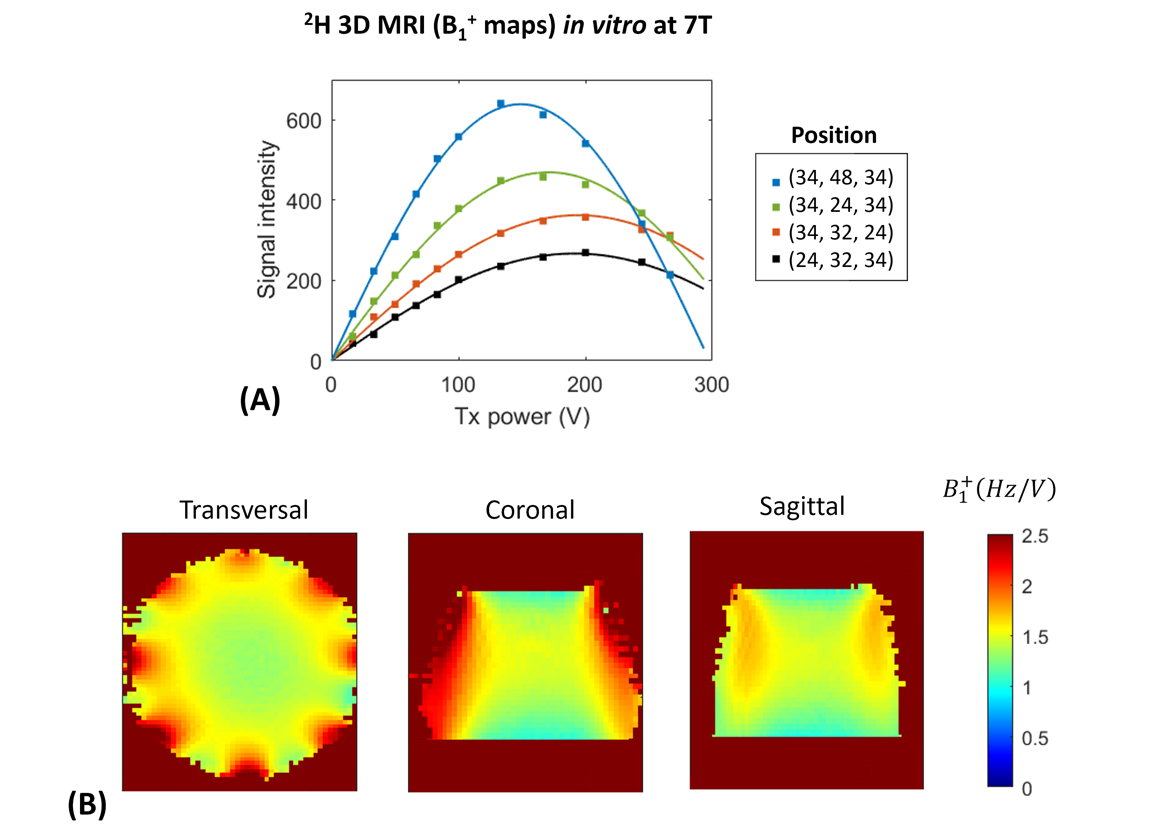
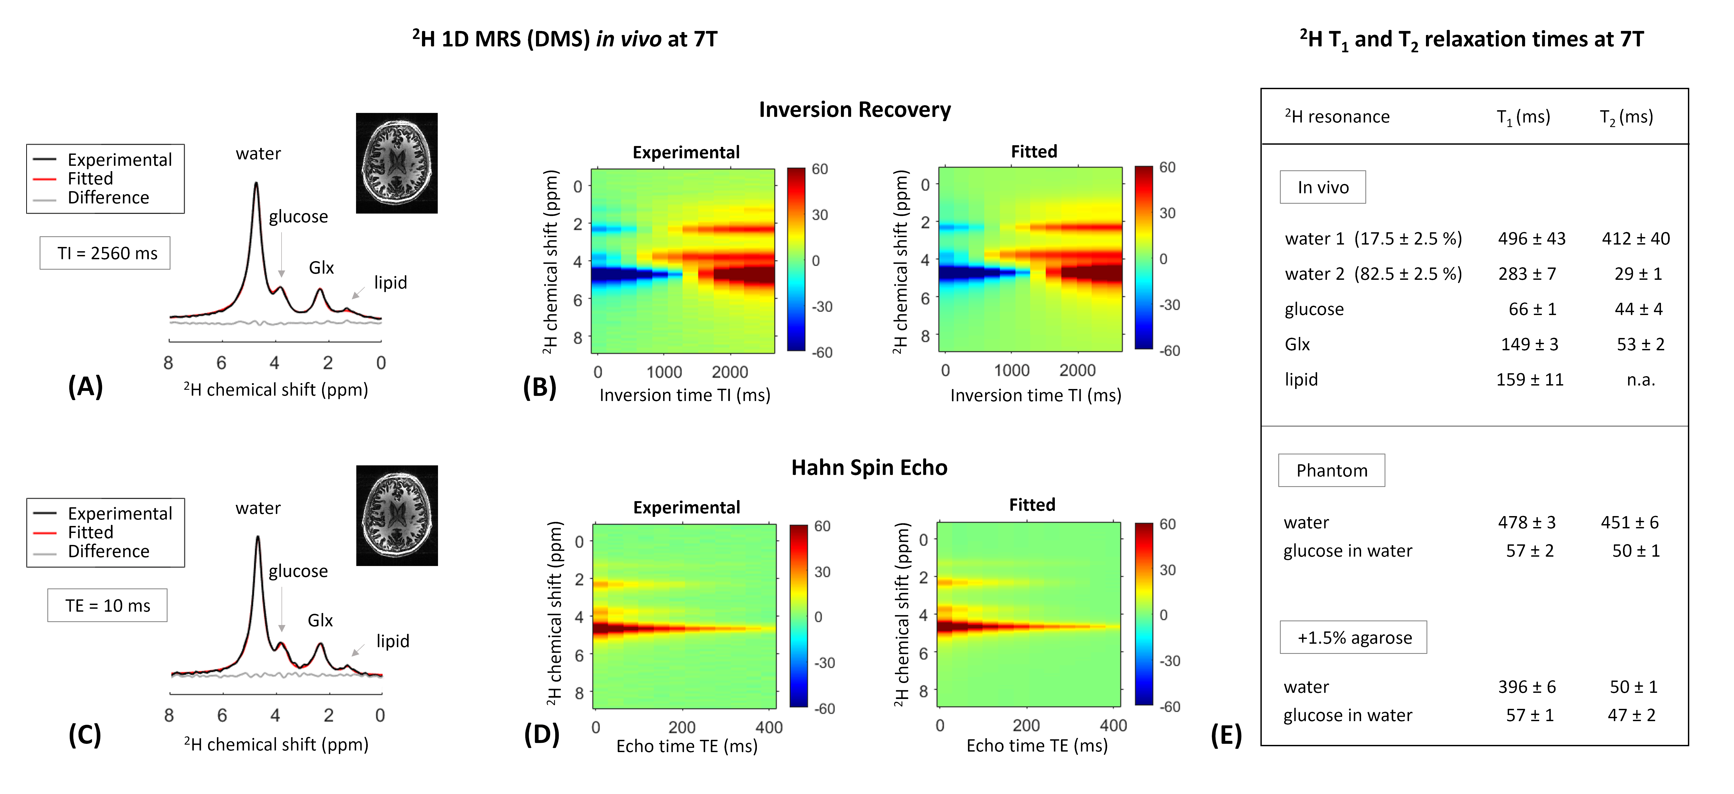
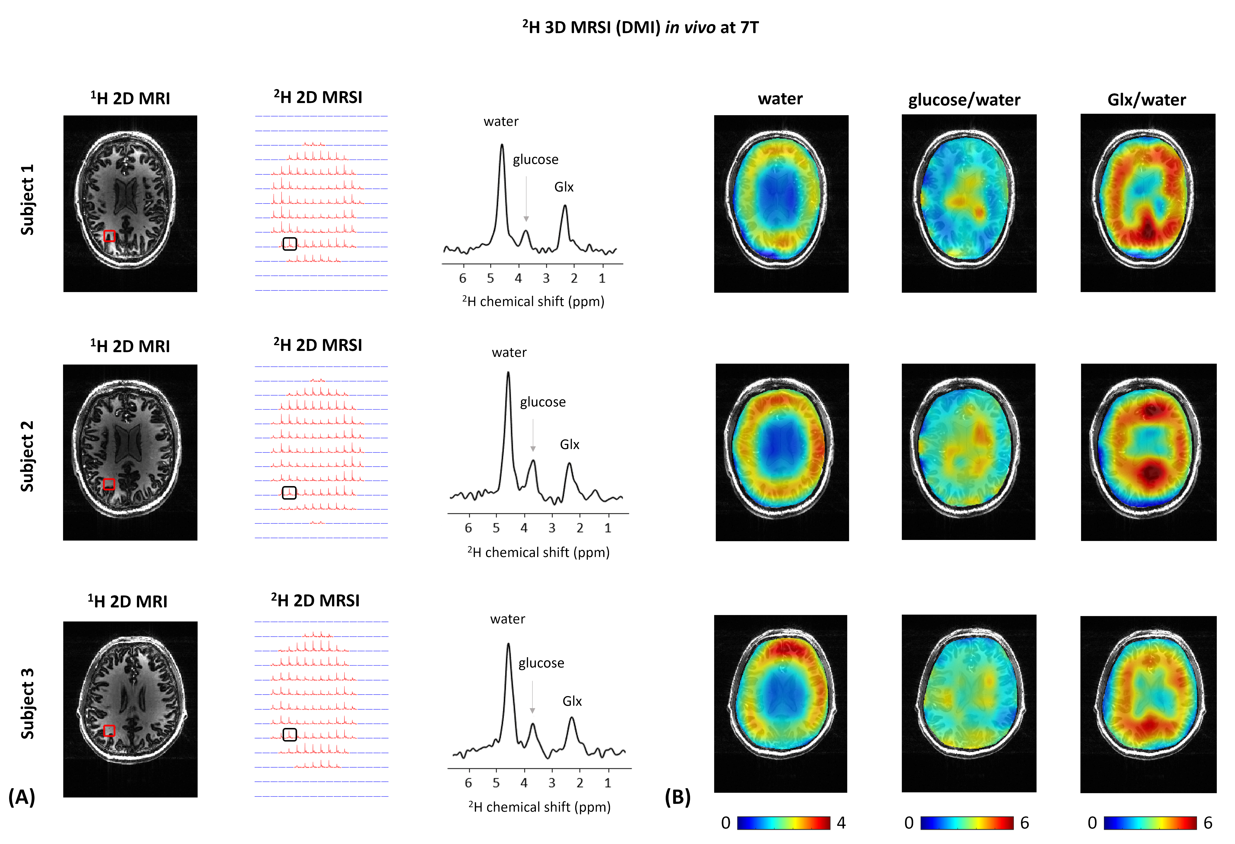
All experiments were performed on a Siemens 7T human scanner (Erlangen, Germany) using a dual-tuned 1H-8channel/2H-10channel transceiver array coil identical to the recent reported designs3,6. B0 shimming was adjusted using the vendor’s 3D and interactive shim routines. All data were processed in MATLAB and DMIWizard7. A pulse-acquire sequence was developed and implemented for 3D 2H-MRSI (DMI) using a non-selective rectangular pulse for excitation (0.5ms) and spherical k-space phase encoding. The DMI protocol consisted of the acquisition of 1) an anatomical 3D 1H-MR image using the MPRAGE sequence8 (FOV=192x256x192mm3, matrix=192x256x96, spatial resolution = 1x1x2mm3, TR=3s), and 2) localized 3D 2H-MR spectra using the 3D 2H-MRSI sequence (FOV=192x256x192mm3, matrix=14x18x14, spatial resolution = 14x14x14mm3, TR=350ms, NA=2, vector size = 256, BW = 2.5kHz, temporal resolution = 14mins, 90˚ flip angle (nominal in center of head)). Localized 3D 2H-MR spectra were acquired in vivo in the human brain of three healthy volunteers, all upon oral administration of 60g [6,6’-2H2]-labelled glucose in 250mL water. DMI maps were obtained from spectral fitting of individual 2H peak resonances. Spectral fitting was based on a linear combination of model spectra (LCM)7, using a pre-generated basis set. In addition, two pulse-acquire sequences were developed and implemented for 1D 2H-MRS (DMS) T1 and T2 measurements of deuterated metabolites. Non-localized 1D 2H-MR spectra were acquired in vivo on the human brain of two of the three healthy volunteers abovementioned (TR=2.560s (T1), TR=2s (T2), NA=16), and in vitro on a phantom containing 2mM [6,6’-2H2]-labelled glucose in water in which 1.5% of agarose was added afterwards (TR=3s (T1), TR=2s (T2), NA=50). To evaluate the sensitivity of the 2H-coil, the 3D FLASH sequence was adapted for 2H-MRI using a non-selective rectangular excitation pulse (0.5ms). A 3D printed phantom container was made to fit tightly within the RF coil. The phantom solution consisted of a mix of sucrose, water and KCl to resemble the RF coil loading of a human head, in addition to ~2M of D2O to provide ample SNR for mapping of B1+. A series of 3D 2H-MR images were acquired in vitro on the phantom (TR = 400ms, NA = 6, FOV = 192x256x192mm3, matrix = 48x64x48, slice thickness = 4mm, spatial resolution = 4x4x4mm3, BW = 240Hz) from which 3D 2H-B1+ maps were generated in vitro. All DMI maps in vivo were then B1 corrected.Results and discussion
The 3D 2H-B1+ maps in vitro reveal high 2H-sensitivity at the sample surface close to the 2H-coil elements (Figure1), as expected from the array coil design and in agreement with that reported at 9.4T using the same coil design3. The 1D 2H-MRS (DMS) spectra in vivo resulted in well detected deuterated resonances of water, glucose and Glx at 4.7ppm, 3.8ppm and 2.3ppm, respectively (Figure2). In spectra on the edge of the brain, an occasional lipid signal at circa 1.3 ppm could be observed. The 2H-T1 and -T2 relaxation times in vivo and in vitro were found in close agreement with what is expected at 7T compared to adjacent field strengths2 (Figure2E). The 2H-MR spectroscopic grids in vivo resulted in high sensitivity spectra in the peripheries of the brain and lower sensitivity spectra in the centre (Figures 3,4), in agreement with the 3D 2H-B1+ maps. The zoomed in spectra from the 2H-MR spectroscopic grids in vivo show high-resolved deuterated resonances of water, glucose, and Glx, respectively (Figures 3,4), in contrast to the 1D 2H-MR spectra in vivo which are less resolved.Conclusion
Here we have demonstrated the successful implementation and validation of DMI in the human brain in vivo on a 7T Siemens scanner. Both spatial and temporal nominal resolutions achieved at 7T, i.e. 2.75ml and 14mins, respectively, were close to those achieved at 9.4T3 and greatly outperformed those at lower magnetic fields2. DMI at 7T and beyond has clear potential in applications dealing with small lesions, such as multiple sclerosis or small tumor metastases.Acknowledgements
This work was supported by NIH funding through grant R01 EB025840.References
1. De Feyter HM et al. JMR 326 (2021) 106932.
2. De Feyter HM et al. Sci.Adv. 4, eaat7314 (2018).
3. Ruhm L et al. NeuroImage 244 (2021) 118639.
4. Lu M et al. JCBFM. 2017;37(11)3518-3530.
5. de Graaf RA et al. NMR Biomed. 2020;33(3):e4235.
6. Avdievich NI et al. MRM. 2020;84:1076-1089.
7. de Graaf RA. DMIWizard available at https://medicine.yale.edu/lab/dmi/.
8. de Lange EE et al. MRM.1991;9(4):469-76
Figures