0634
Comparison of clinical deuterium metabolic imaging (DMI) and hyperpolarized carbon-13 imaging at 3 T in the normal brain
Alixander S Khan1,2, Joshua D Kaggie1,2, Mary A McLean1,2, Rolf F Schulte3, Matthew J Locke1, Amy Frary1, and Ferdia A Gallagher1,2
1Department of Radiology, University of Cambridge, Cambridge, United Kingdom, 2Cancer Research UK Cambridge Centre, University of Cambridge, Cambridge, United Kingdom, 3GE Healthcare, Munich, Germany
1Department of Radiology, University of Cambridge, Cambridge, United Kingdom, 2Cancer Research UK Cambridge Centre, University of Cambridge, Cambridge, United Kingdom, 3GE Healthcare, Munich, Germany
Synopsis
Deuterium metabolic imaging (DMI) and hyperpolarized 13C-pyruvate MRI (HP-13C-MRI) are two promising approaches for non-invasive and non-ionizing imaging of tissue metabolism. Here we directly compare these two techniques at 3 T for the first time in humans. DMI using [6,6’-2H2]glucose, and 13C-MRI using hyperpolarized [1-13C]pyruvate, were undertaken in five healthy volunteers. The ratio of 13C-lactate/13C-bicarbonate (mean ±S.D. = 5.05 ±0.89) with HP-13C-MRI was higher than the equivalent 2H-lactate/2H-Glx ratio (0.43 ±0.19) with DMI, which can be explained by differences in tracer administration, subsequent timing of acquisition, and tissue physiology. The results demonstrate the two methods provide different yet complementary data.
Introduction
Deuterium metabolic imaging (DMI) and hyperpolarized 13C-MRI are emerging techniques to probe dynamic changes in tissue metabolism using MRI. In DMI, deuterated [6,6’-2H2]glucose is administered orally, and can be detected alongside its downstream metabolites [6,6-2H2]-lactate, 2H-Glx (a combined peak of glutamate and glutamine), and deuterated water1. In 13C-MRI, hyperpolarized 13C-pyruvate is injected and its tissue uptake can be detected alongside the downstream metabolites 13C-lactate and 13C-bicarbonate2. Preliminary comparisons between the two techniques have been undertaken in a rat model, which showed an inverse relation between [1-13C]lactate and 2H-Glx however it was limited by the failure to detect [1-13C]bicarbonate3. Here we undertook a comparison of these techniques in humans for the first time by applying them to the healthy human brain at 3T to assess the difference between glycolytic and oxidative metabolism between the two imaging methods.Methods
Five healthy volunteers (3 males, 2 females, 34±8 years) were imaged using a 3T MRI (MR750; GE Healthcare). A T1W 3D-SPGR proton image was acquired, and higher-order shimming was performed prior to imaging each X-nucleus. Eddy current settings were adjusted for the X-nuclei4.DMI was performed using a custom 2H birdcage coil following a minimum of 6 hours fasting (for improved uptake). Deuterated glucose (0.75g/kg) in water was administered orally 15-78 min prior to the first deuterium measurement. A 3D MRSI acquisition scheme was used (FoV 32cm, TR 120ms, FA 90°, matrix 10x10x10) and unlocalized MRS acquired (flip 90°, TR 1s, 128 averages). Build-up measurements were made using 12 MRS acquisitions between 15-60 min. Metabolite concentration was referenced against the endogenous natural abundance deuterated water (HDO) estimated as 10.9mM5.
13C-MRI was performed using a dual-tuned 13C/1H quadrature transmit/receive head coil (Rapid Biomedical, Rimpar, Germany). [1-13C]Pyruvate was hyperpolarized using a SpinLab hyperpolarizer (Research Circle Technology, Albany NY). A 2D MRSI acquisition was used (FoV 20cm, TR 323ms, FA 8-10°, matrix 10x10, 5 slices, 2cm thick) which began between 15-20s after injection. MRS was collected subsequently, either unlocalized or from the same 5 slices.
Data was analyzed in MATLAB using OXSA AMARES6 to fit spectral peak areas and create metabolite maps
Results
Uptake of deuterated glucose and the buildup of metabolites was measured across 12 timepoints in subject 1 starting prior to consumption of the glucose drink and finishing 60 minutes after consumption (Fig 1). A steep rise in deuterated glucose signal can be seen, up to a maximum of 7.7mM, referenced against an assumed natural abundance water signal of 10.9mM. This was followed by smaller rises in 2H-Glx (max 3mM), and HDO (0.3mM above natural abundance). There was a small increase in the peak at 1.3 ppm due to the lactate and lipid peaks (max 1.33mM), while the lipid signal at 0.9 ppm remained constant.The DMI spectroscopic images from subject 1 are shown in figure 2. The spatial inhomogeneity observed in the metabolite signals was greatly reduced in the water ratio images.
2D MRSI images are shown from the 13C acquisition from subject 5, demonstrating the detection of pyruvate and its downstream products lactate and bicarbonate (figure 3).
Global metabolite levels were calculated from the final unlocalized MRS (Tables 1 and 2). Metabolite correlations between DMI and 13C were not significant, although the number of matched experiments was only 4.
Discussion
DMI maps normalized to deuterated water demonstrated a homogeneous distribution of glucose and glutamine/glutamate (Glx) throughout most of the brain. As demonstrated in previous work1the 2H-lactate formation in healthy brain was low, but it was possible to detect a small increase over time in the 2H-lactate/lipid peak at 1.3 ppm, while the 0.9 ppm lipid peak was not enriched.The use of MRSI enabled the sensitive detection of bicarbonate (not seen in the previous preclinical comparison study3) allowing for the comparison of oxidative metabolism between DMI and HP-13C-MRI. With DMI, the ratio of oxidative to glycolytic metabolism favored the former, with a high level of 2H-Glx detected across the brain (mean 2H-Lactate/2H-Glx ratio ±S.D.: 0.43 ±0.19) whereas with HP-13C-MRI, glycolytic metabolism dominated (mean 13C-Lactate/13C-Bicarbonate ratio: 5.05 ±0.89). The long time between oral administration and measurement with DMI, as well as the slow uptake from the gastrointestinal tract, leads to a measurement of metabolism which is closer to steady state concentrations. In contrast, HP-13C-MRI is performed immediately following injection of a supraphysiological bolus of pyruvate, and is therefore dependent on pyruvate delivery to the brain parenchyma, with higher concentrations in the well perfused grey matter2. While both these approaches provide information on downstream metabolism, unlike 18F-FDG-PET, even the glucose concentrations may be supraphysiological which may affect glucose incorporation in the tricarboxylic acid cycle (TCA) in the mitochondria which is controlled by the enzyme pyruvate dehydrogenase (PDH). Finally, the differences in metabolism may also be influenced by differences in expression of the transporters for glucose (GLUT) and pyruvate (monocarboxylic acid transporter family, MCT).
Conclusion
We have demonstrated the potential for DMI at 3T demonstrating its clinical potential. DMI reports principally on oxidative metabolism, which is more likely to reflect steady-state measurements due to the slow uptake of the oral 2H-glucose. In contrast, hyperpolarized 13C-MRI favors detection of glycolytic metabolism derived from the supraphysiological concentration of intravenously injected 13C-pyruvate.Acknowledgements
We acknowledge support from CRUK, CRUK Cambridge Centre, NIHR Cambridge BRC, NIHR Cambridge Clinical Research Facility, Addenbrooke’s charitable Trust, the Evelyn Trust, and the MS Society.References
1. De Feyter, Henk M., et al. "Deuterium metabolic imaging (DMI) for MRI-based 3D mapping of metabolism in vivo." Science advances 4.8 (2018)2. Grist, James T., et al. "Creating a clinical platform for carbon‐13 studies using the sodium‐23 and proton resonances." Magnetic resonance in medicine 84.4 (2020)
3. von Morze, Cornelius, et al. "Comparison of hyperpolarized 13C and non‐hyperpolarized deuterium MRI approaches for imaging cerebral glucose metabolism at 4.7 T." Magnetic resonance in medicine 85.4 (2021)
4. McLean, Mary A., et al. "Characterization and correction of center‐frequency effects in X‐nuclear eddy current compensations on a clinical MR system." Magnetic Resonance in Medicine 85.5 (2021)
5. Tong, Zhiyong, et al. "In vivo quantification of the metabolites in normal brain and brain tumors by proton MR spectroscopy using water as an internal standard." Magnetic resonance imaging 22.5 (2004)
6. Purvis, Lucian AB, et al. "OXSA: An open-source magnetic resonance spectroscopy analysis toolbox in MATLAB." PloS one 12.9 (2017)
Figures
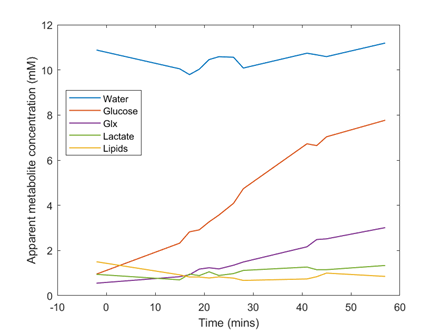
Figure 1. Timecourse of DMI metabolites from 15 minutes to 60 minutes. Initial HDO water was estimated to be 10.9 mM
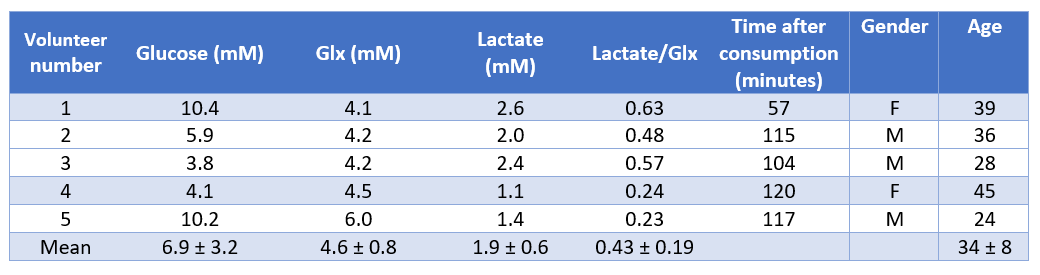
Table 1.
Metabolite levels across subjects measured using MRS acquisition with the
spectra of 5 slices summed and processed using AMARES. Metabolites were
quantified by assuming a 15mM water level over the 60-120 minutes acquisition
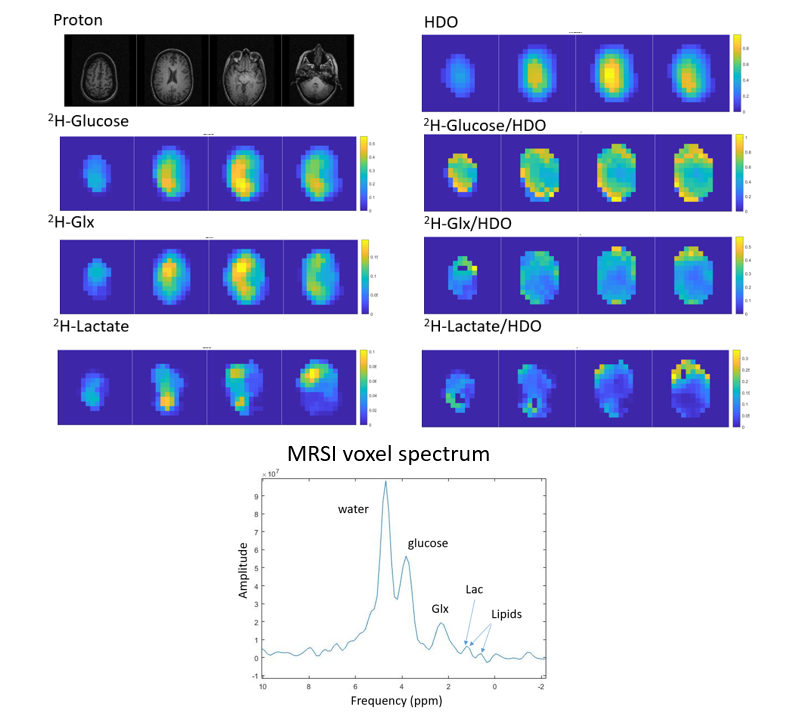
Figure 2. Metabolite maps 60 minutes after deuterium
consumption in Subject #1. Metabolite levels were normalized to HDO signal. Images
were upscaled using zero filling and a median filter to produce an upscaled 16x16x10
voxel resolution. Spectrum from midline voxel in the central slice demonstrating good separation between metabolite peaks is also shown.
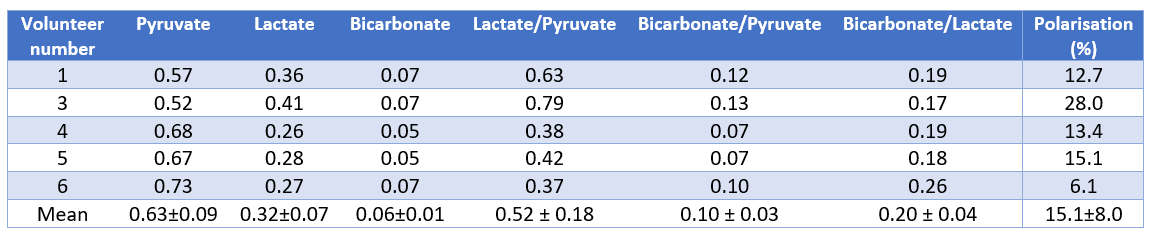
Table 2
Metabolite values collected from 13C-MRSI acquisition over the whole
brain with metabolite values normalized to the total 13C signal
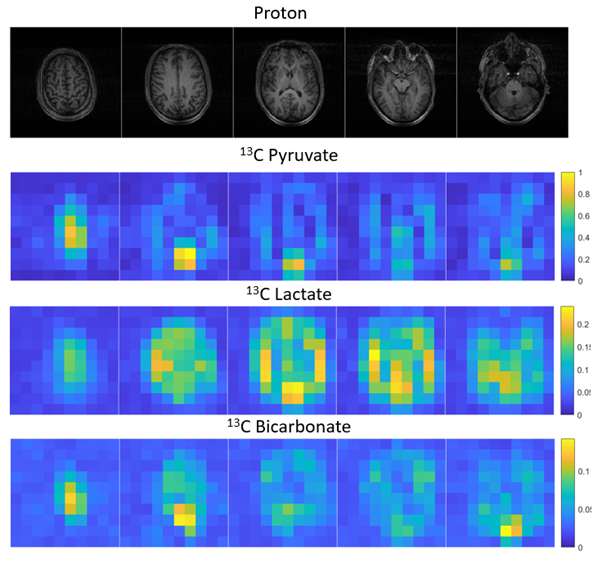
Figure 3 Metabolite images for HP-13C-MRI collected 27 seconds after injection of pyruvate in Subject 5.
DOI: https://doi.org/10.58530/2022/0634