0633
Heterogeneity of multiple sclerosis lesions evidenced by 7T multiparametric sodium MRI1Aix Marseille Univ, CNRS, CRMBM, Marseille, France, 2APHM, Hôpital de la Timone, CEMEREM, Marseille, France, 3APHM, Hôpital de la Timone, Pôle de Neurosciences Cliniques, Service de Neurologie, Marseille, France, 4University Hospital Erlangen, Institute of Radiology, Erlangen, Germany
Synopsis
Inflammatory demyelinated lesions are a hallmark of multiple sclerosis (MS) and are the pathological substratum of clinical relapses. After their occurrence, neuropathological changes within lesions and lesion repair are variable and unpredictable. Chiefly, recovery from the first relapses is a key element of the long-term prognosis. Thus, in vivo exploration of lesion repair is of paramount importance.
The multi-TE sodium 7T MRI approach revealed that maintained sodium homeostasis within lesion is associated with a better recovery from relapses in MS. Sodium MRI appears to be a promising tool to assess in vivo preservation of neuronal function in MS.
INTRODUCTION
Inflammatory demyelinated lesions are a hallmark of multiple sclerosis (MS) and are the pathological substratum of clinical relapses. After their occurrence, neuropathological changes within lesions and lesion repair are variable and unpredictable. Chiefly, recovery from the first relapses is a key element of the long-term prognosis1. Histological studies showed that recovery is strongly related to the state of lesion healing2. Thus, in vivo exploration of lesion repair is of paramount importance.To date, the “gold standard” to assess in vivo microstructural change within lesions is T1-weighted imaging3. Nonetheless, even if T1 based MRI is widely used, for more than two decades, to explore structural changes in MS, their accuracy is not sufficient to emerge in clinical practice.
Recently, sodium MRI showed high potential to assess alterations of sodium homeostasis and neurodegeneration in MS4. Therefore, sodium MRI might be a promising candidate to quantify the extent of brain tissue injury underlying recovery.
To this aim, we explored T1 and sodium signal changes in two groups of patients with Relapsing Remitting MS (RRMS), according to their recovery after their first clinical relapses.
METHODS
SubjectsThirty-three early RRMS patients at an early stage of the disease and age- and gender-matched healthy controls (HC) were recruited. Patients were scored on the expanded disability status scale (EDSS) and split into two groups: complete recovery (CR) with EDSS=0 and partial recovery (PR) with EDSS≥1.
MRI acquisition
7T (Magnetom step2, Siemens) 23Na-MRI included a multi-echo density adapted radial sequence (TR=120ms, 5000 spokes, 384 radial samples/spoke, resolution=3mm isotropic, 24 echoes 0.20- 70.78ms, TA=30min)5. 1H-MRI protocol included: 3D-MP2RAGE (TR/TE/TI1/TI2=5000/3/900/2750ms, 256 slices, resolution=0.6mm isotropic, TA=10min12s); B1+ mapping sequence (TR/TE=2000/14ms, 14 axial sections, resolution=3.9×3.9×5mm3, TA=2min14s). T2w sequence was acquired at 3T.
Data processing.
White matter (WM) lesions were delineated on the T2w images. T2w images were rigidly coregistered on the T1w images. The uniform T1w were denoised. In-painted T1w-uni images, were segmented into grey matter (GM), normal-appearing white matter (NAWM) (0.9 tissue probability threshold). T1-map images (T1 relaxation time (T1-RT)) were corrected for residual B1+ effect.
Sodium images were reconstructed offline, filtered and corrected for motion to obtain sodium images estimates that were fitted using a bi-exponential procedures to obtain Total sodium concentration (TSC) and sodium signal fraction (f) maps5.
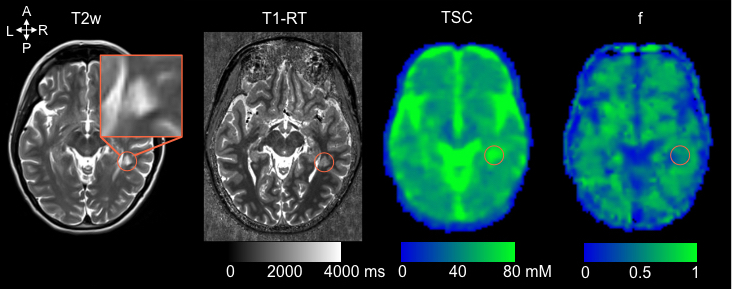
Quantitative TSC, f and T1-RT maps were quantified in GM, NAWM and T2-lesions compartments (Figure 1).
Statistical analysis
Differences in age and gender between groups were assessed using a two-sample t-test and a chi-squared test, respectively. Differences in disease duration and T2-lesions load were assessed using a Wilcoxon rank test. Differences in TSC, signal fraction and T1-RT maps in GM, NAWM and T2-lesions, between groups were assessed using a general linear model. T2-lesions probability maps (LPM) were computed by averaging T2-lesions in the MNI152 space. Spearman correlations were performed between MRI metrics and EDSS. P-values below 0.05 were considered statistically significant.
RESULTS
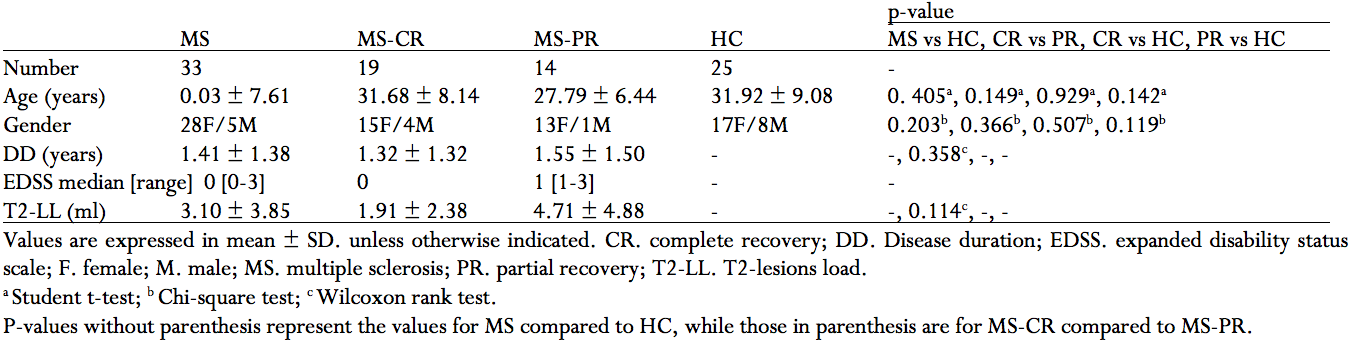
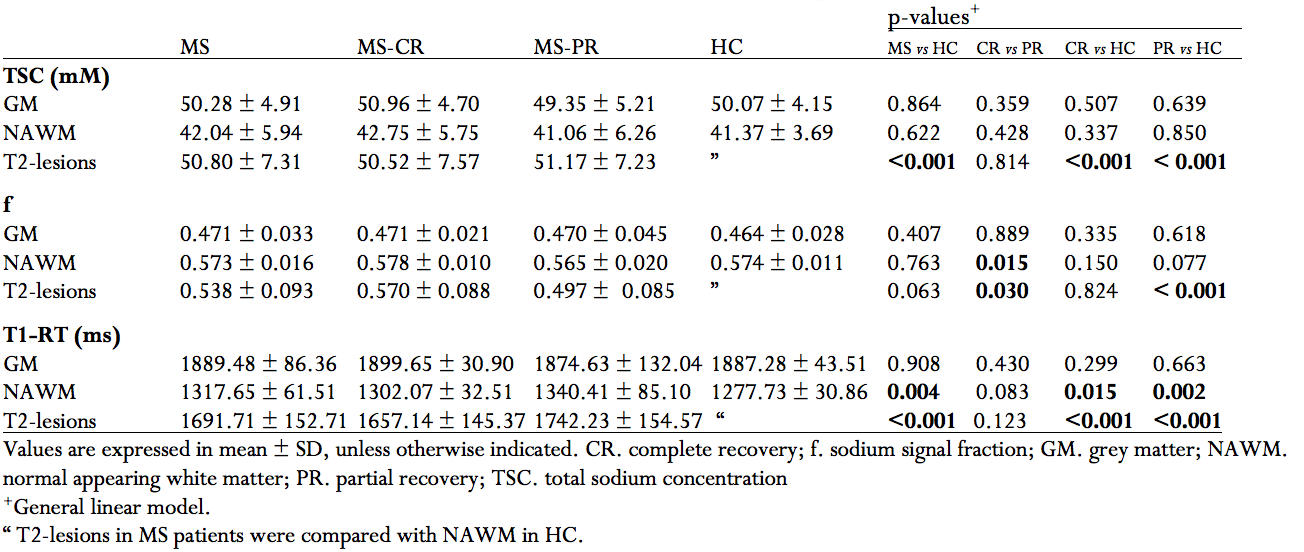
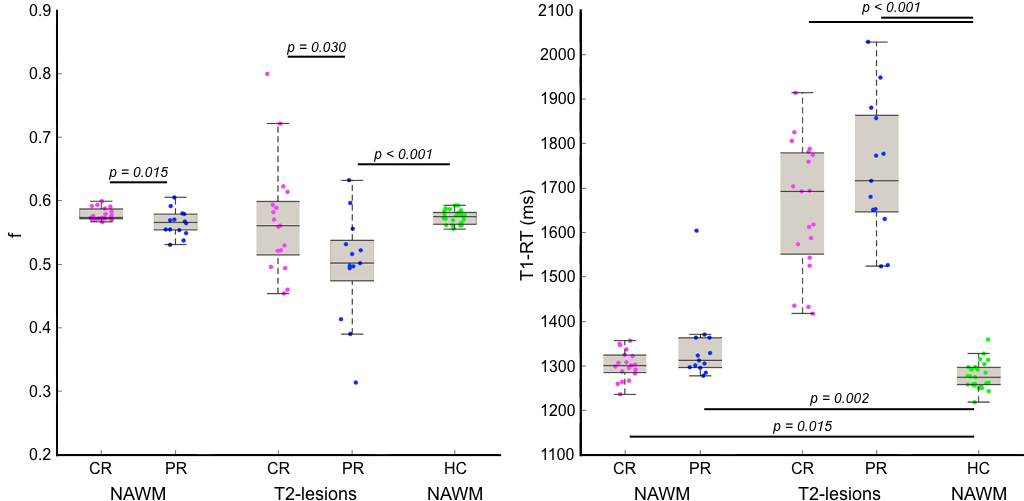
After their first relapses, 19 patients showed a complete recovery (CR) and 14 patients a partial recovery (PR). No differences in age, gender, disease duration and T2-lesions-load were found (Table 1).MRI metrics and groups comparisons are summarized in Table 2 and Figure 2.
CR vs PR. Only f was significantly high in T2-lesions and NAWM in CR.
CR vs HC. CR patients showed significantly high T1-RT in NAWM and significantly high TSC and T1-RT in T2-lesions.
PR vs HC. PR patients showed significantly high TSC, high T1-RT and low f in T2-lesions; and only T1-RT was significantly high in NAWM.
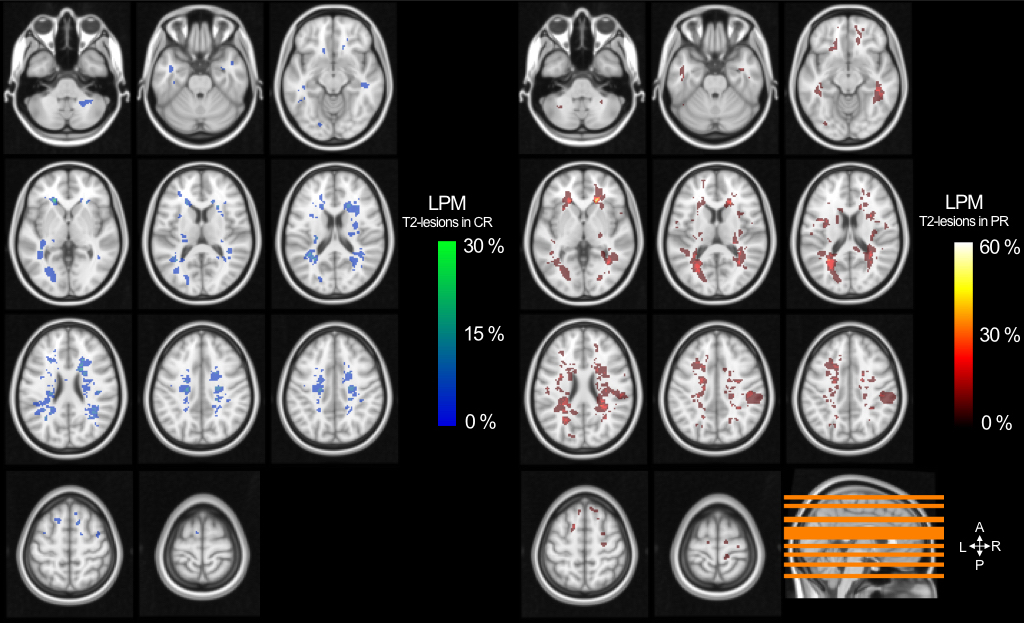
Only significant correlations were found between EDSS and f in NAWM (r=-0.422, p=0.014) and in T2-lesions (r=-0.395, p=0.031). Figure 3 shows T2-lesions probability maps in CR and PR patients. The peak of T2-lesions frequency was maximum at 26.3% in CR and 57.1% in PR.
DISCUSSION
The present study demonstrated differential sodium MRI signal fraction (f) within lesions according to the patient recovery from the first relapses. Mainly, in CR patients, f was similar in patients and HC. In opposite, PR patients showed a decreased f in lesions.Sodium exhibits a biexponential signal decay with a short component in restricted environment such as within cells and a long component in unrestricted environment6. The multi-TE sodium approach allowed to quantify f, the sodium signal from the short component. Consequently, lower f reflects a disrupted sodium gradient within and between brain cells.
The fact that differences are seen in lesions is not surprising as they are the counterpart of relapses. Thus, in early MS, disability is related to their occurrence, and more importantly, their repair7 and/or functional reorganization8. Although the study is not longitudinal, one may suppose that the good recovery is due to an increase of f in lesions, reaching controls levels.
Finally, in the present study, f is more accurate than T1 to depict efficiently and functionally repair in lesion. The added value could be that sodium MRI brings not only a structural information of the tissue but also function information of the sodium homeostasis within the environment.
CONCLUSION
A maintained sodium homeostasis within lesion is associated to a better recovery from relapses in MS. Sodium MRI appears to be a promising tool to assess in vivo preservation of neuronal function in MS.Acknowledgements
We are grateful to all subjects and their relatives. This work was supported by Foundation ARSEP, APHM (AORC Junior 2017 program) and ANR (grant ANR-15-CE19-0019-01).References
1. Leray E, Yaouanq J, Le Page E, et al. Evidence for a two-stage disability progression in multiple sclerosis. Brain. 2010;133:1900–1913.2.
2. Trapp BD, Ransohoff R, Rudick R. Axonal pathology in multiple sclerosis: relationship to neurologic disability. Curr Opin Neurol. 1999;12:295–302.3.
3. Van Waesberghe J, Kamphorst W, De Groot CJ, et al. Axonal loss in multiple sclerosis lesions: magnetic resonance imaging insights into substrates of disability. Annals of neurology. 1999;46:747–754.4.
4. Inglese M, Madelin G, Oesingmann N, et al. Brain tissue sodium concentration in multiple sclerosis: a sodium imaging study at 3 tesla. Brain. 2010;133:847–857.5.
5. Ridley B, Nagel AM, Bydder M, et al. Distribution of brain sodium long and short relaxation times and concentrations: a multi-echo ultra-high field 23Na MRI study. Scientific Reports [online serial]. 2018;8. Accessed at: http://www.nature.com/articles/s41598-018-22711-0. Accessed January 8, 2019.6.
6. Shah NJ, Worthoff WA, Langen K-J. Imaging of sodium in the brain: a brief review. NMR Biomed. 2016;29:162–174.7.
7. Stankoff B, Poirion E, Tonietto M, Bodini B. Exploring the heterogeneity of MS lesions using positron emission tomography: a reappraisal of their contribution to disability. Brain Pathol. 2018;28:723–734.8.
8. Schoonheim MM, Geurts JJ, Barkhof F. The limits of functional reorganization in multiple sclerosis. Neurology. 2010;74:1246–1247.
Figures