0632
3D Deuterium Metabolic Imaging of the Human Liver at 7T using Low-rank and Subspace Modeling1Radiology, University of Medical Center Utrecht, Utrecht, Netherlands, 2Biomedical Engineering, University of Southern California, Los Angeles, CA, United States
Synopsis
Deuterium metabolic imaging (DMI) is an emerging technique to spatially map metabolism in vivo through the intake of deuterium (i.e., 2H or D) labeled substrates such as [6,6′-2H2]-glucose. Although DMI has the potential to become a powerful tool to assess liver metabolism, it has limitations due to its long scan time, and low signal-to-noise ratio (SNR) for high spatial resolution in the human body. In this work, we demonstrated the feasibility of low-rank and subspace modeling (LRSM) reconstruction to increase SNR by reducing spectral noise, allowing high spatiotemporal resolution for 3D DMI of the human liver at 7T.
Introduction
Deuterium metabolic imaging (DMI)1 is an emerging technique that can spatially map metabolism in vivo through the intake of deuterium-labeled substrates such as [6,6′-2H2]-glucose. At ultra-high fields (≥7T), deuterium MRSI (DMRSI) benefits from a significantly increased signal-to-noise ratio (SNR) and improved spectral resolution2. However, achieving full coverage of the human liver with high spatial resolution within a short acquisition time is challenging. The subspace imaging framework SPICE3,4 was proposed to enable fast acquisition of 3D MRSI with high resolution. The subspace-based image reconstruction5 was shown to reduce spectral noise in 3D 31P MRSI of the human brain. In this work, we demonstrate the application of low-rank and subspace model reconstruction (LRSM) for effective denoising of 3D DMRSI data from the human liver at 7T.Methods
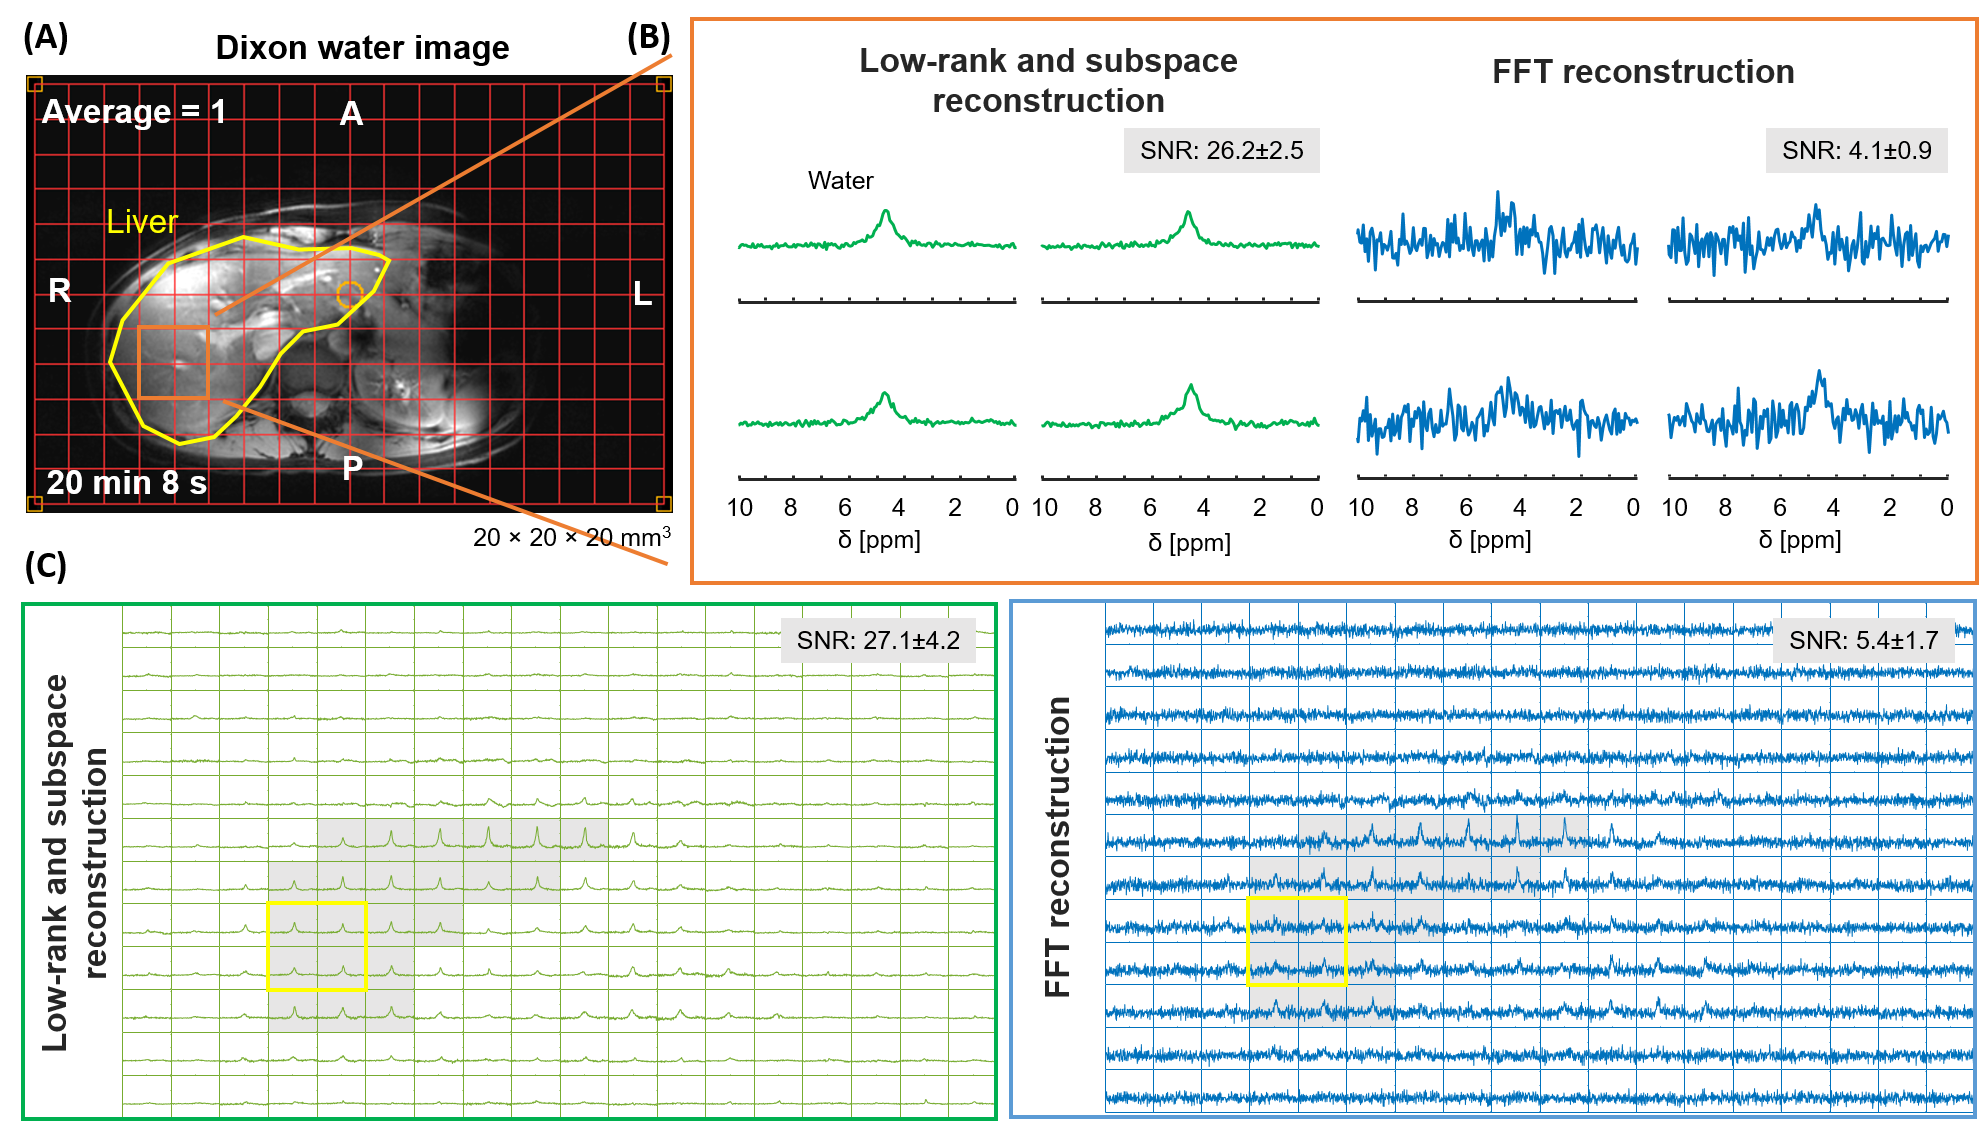
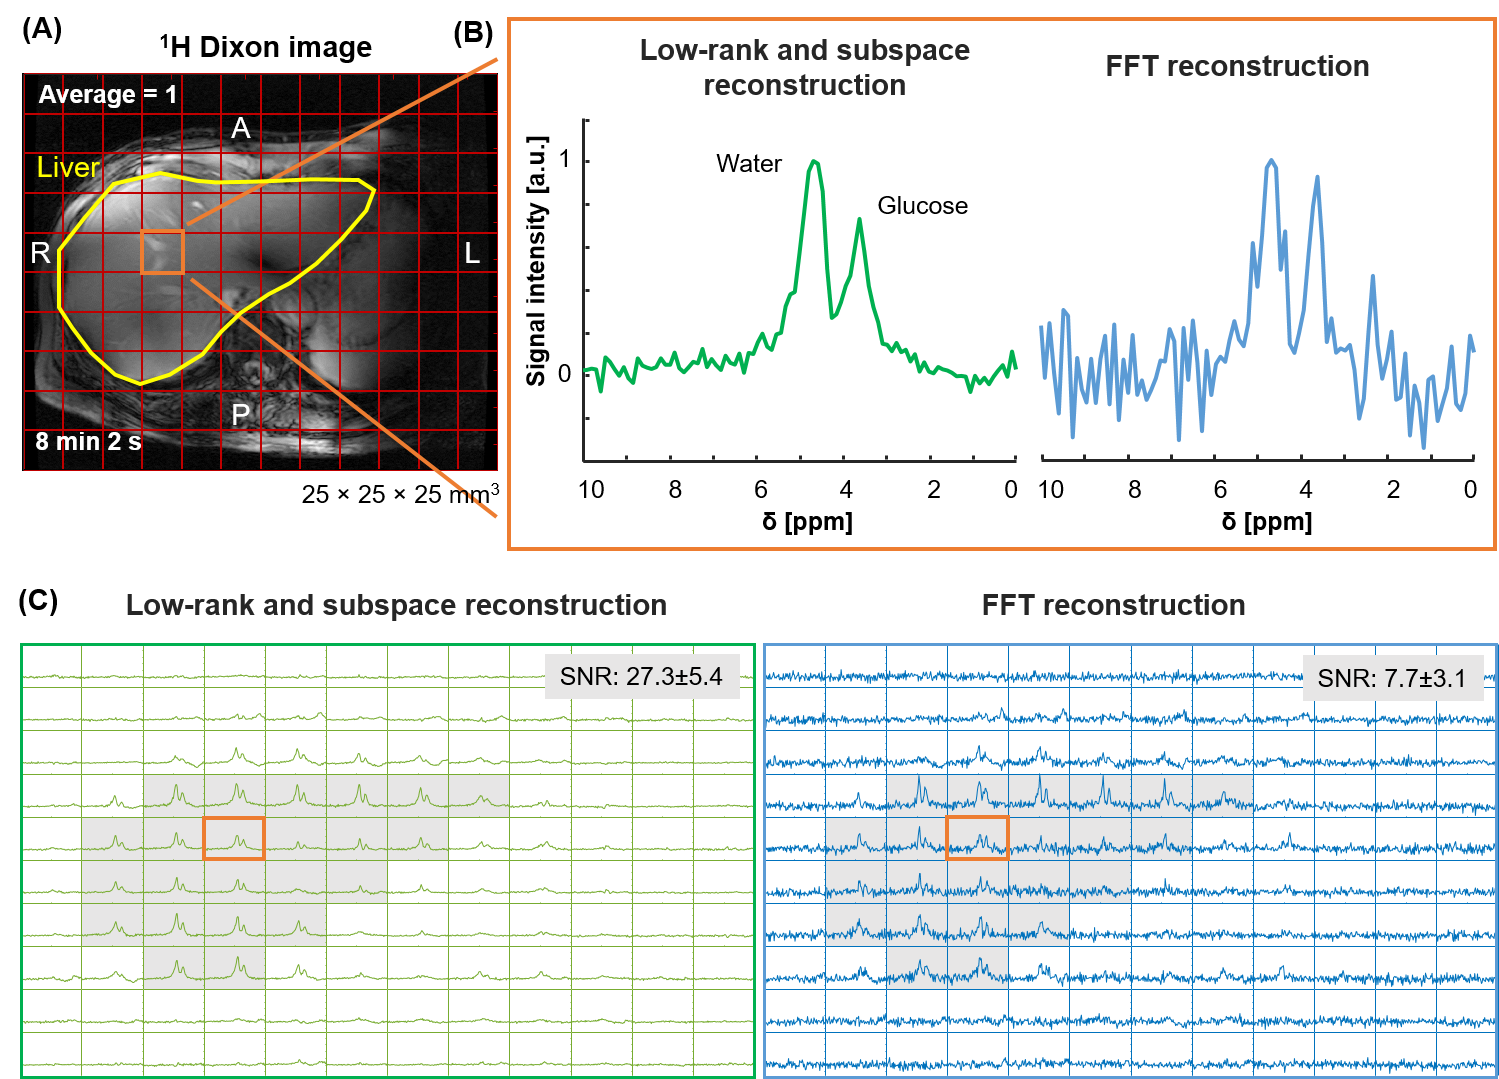
1. ExperimentsTwo healthy volunteers were scanned at a 7T MR system (Achieva, Philips, Netherlands) using a transmit-receive body array, including 4 proton dipole antennas and 4 deuterium loop coils. For one volunteer, a 3D DMRSI scan was obtained 2.5 hours after oral intake of deuterated glucose.
Scan parameters: DMRSI in the human liver at natural abundance: 20×20×20mm3 voxels, FOV=240(AP)×360(RL)×300(FH)mm3, TR/TE=371/1.0ms, 1ms block pulse, spectral bandwidth=1443Hz, average=1, and acquisition time=20min 8s. DMRSI after oral glucose intake: 25×25×25mm3 voxels, FOV=250(AP)×300(RL)×300(FH)mm3, TR/TE=333/1.95ms, spectral bandwidth=5000Hz, weighted averages=4, acquisition time=10min 35s.
2. Numerical simulation
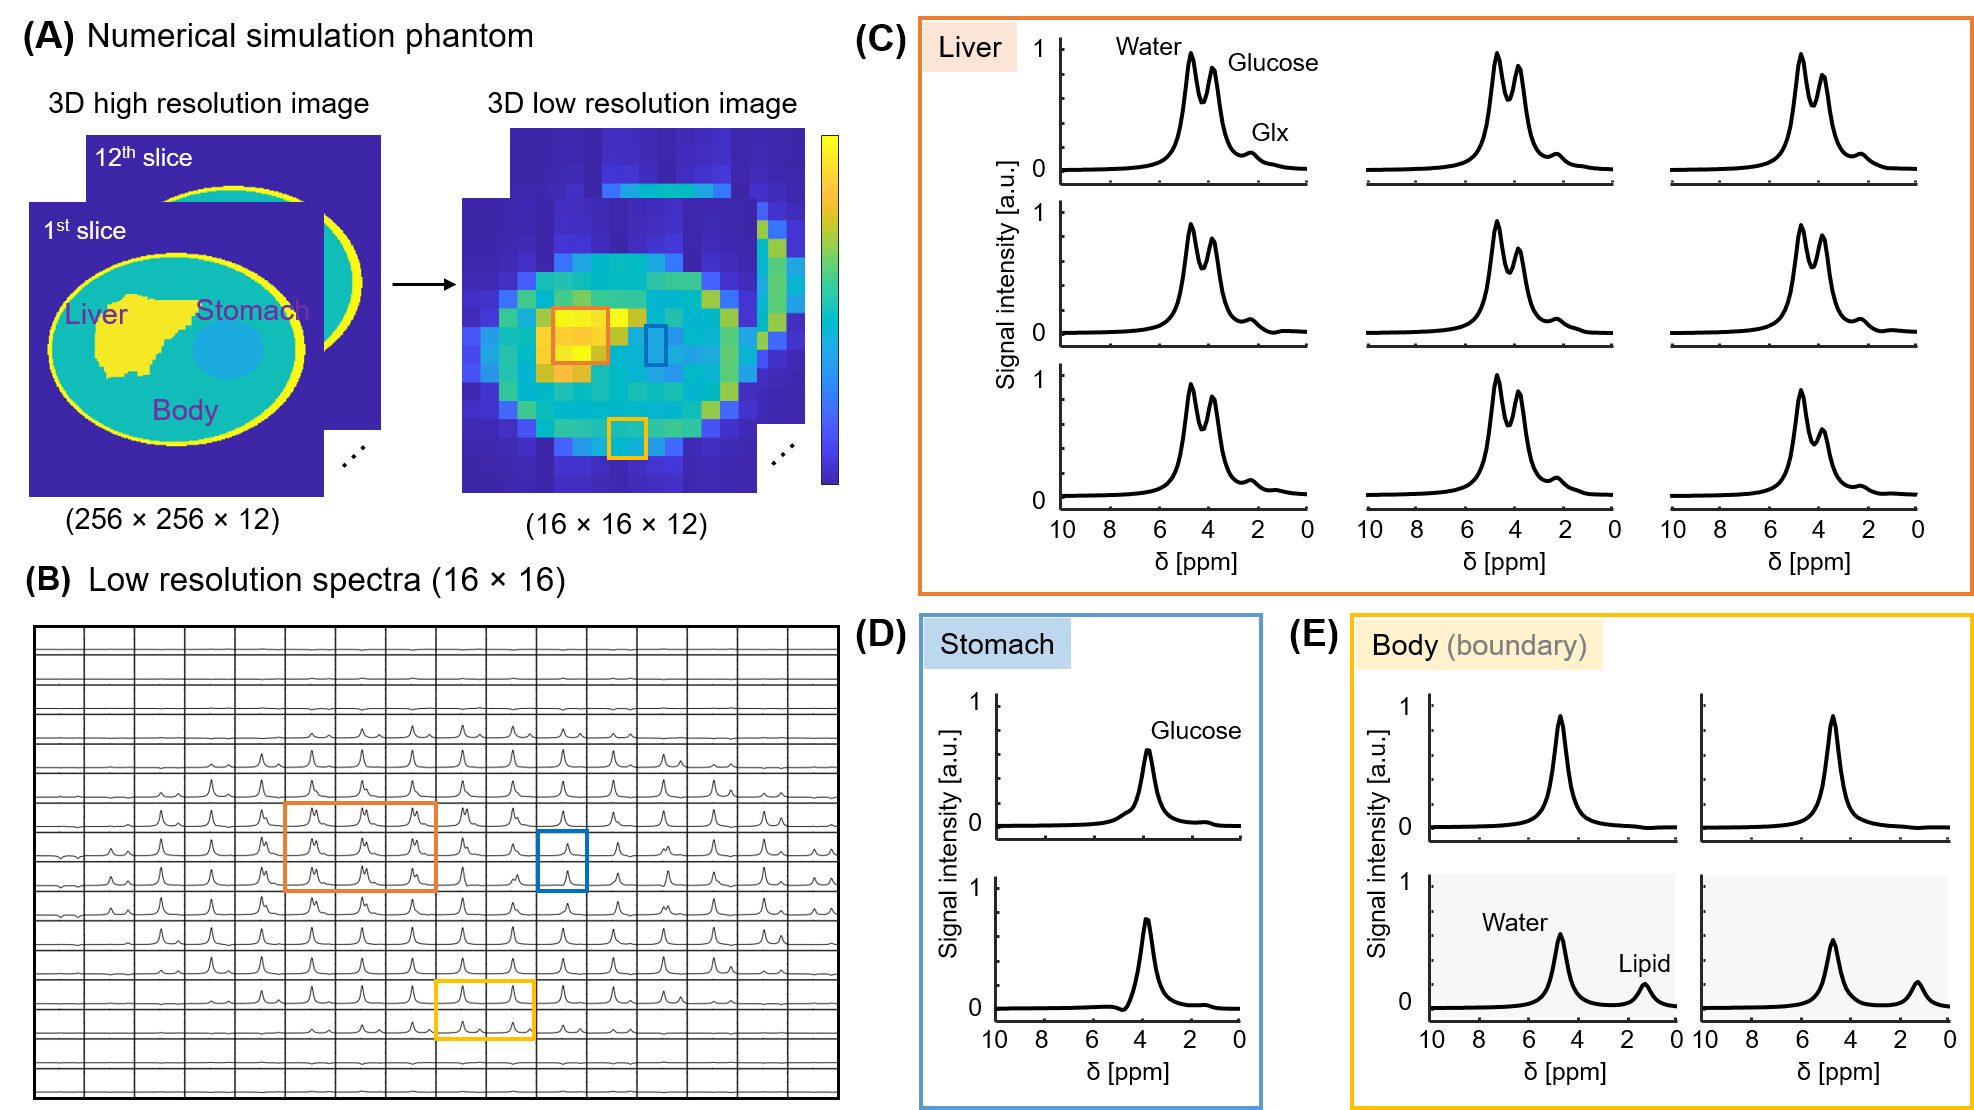
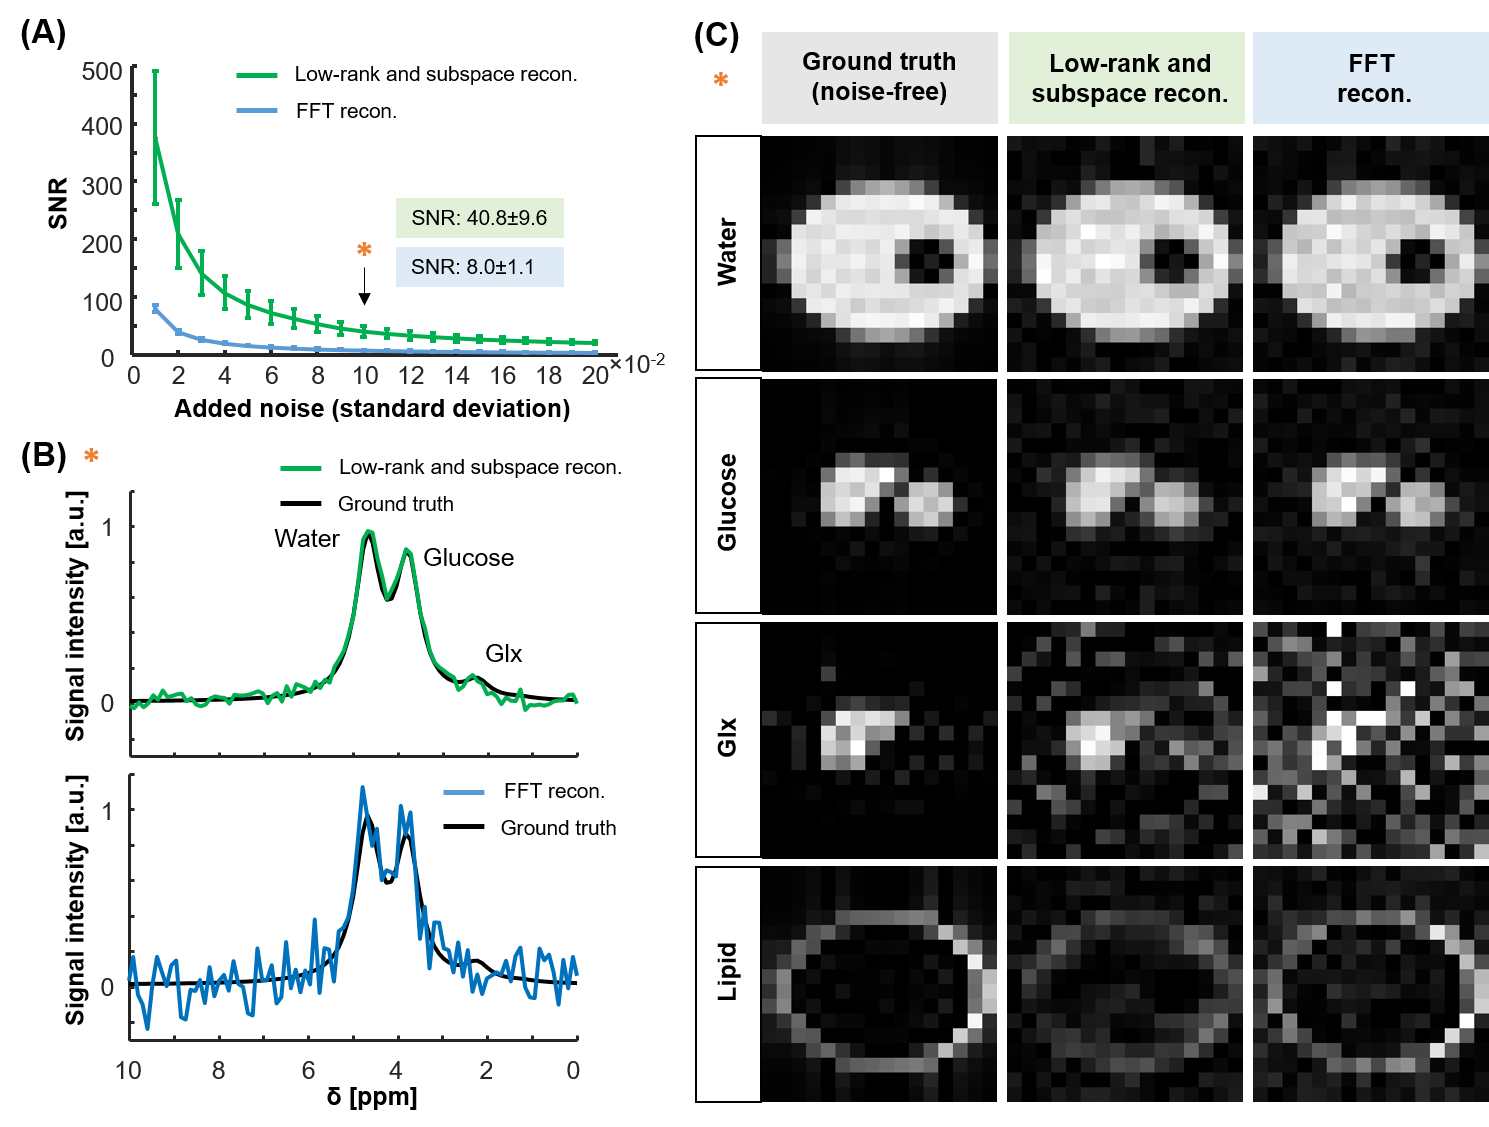
A 3D high-resolution image (matrix size=256x256x12) was generated with three distinct compartments for numerical simulation: liver, stomach, and the rest of the body (including a subcutaneous fat layer). Metabolite signals for water, glucose, Glx, and lipids were generated by varying the amplitude of each signal using a Lorentzian lineshape. Deuterium spectra were simulated with a 10kHz spectral bandwidth and 2048 points. The high-resolution was down-sampled to the resolution of a typical DMI acquisition. Complex Gaussian noise (i.e., N(0, 1)) was added to the simulated deuterium signals with increasing noise standard deviation (0.01-0.2).
3. Image Reconstruction
The subspace model3,4,5,6 exploits spatiotemporal correlation7 of the MRSI signals:
$$$\qquad\qquad\qquad\qquad\qquad\qquad\qquad\qquad\qquad\qquad\qquad\mathrm{\hat{\rho}(\mathbf{r},t)} = \sum_{l=1}^{L} \mathit{u}_l(\mathbf{r})\mathit{v}_l(t), $$$
where $$$\big\{\mathit{u}_l(\mathbf{r})_{l=1}^L \big\}, \, \big\{\mathit{v}_l(t)_{l=1}^L \big\}$$$ denote a set of spatial and temporal basis functions, respectively, and the model order $$$L$$$. Our approach employs a low-rank and subspace modeling where a temporal subspace is estimated from the fully sampled 5×5×5 k-space center region. Specifically, the unknown spatial basis $$$\mathbf{U}$$$ is estimated by solving the following least-squares problem:
$$$\qquad\qquad\qquad\qquad\qquad\qquad\qquad\qquad\qquad\qquad\qquad\hat{\mathrm{U}} = \underset{\mathrm{U}}{\text{argmin}} \, \|\mathbf{d} - \Omega (\mathbf{F} \mathbf{U} \hat{\mathbf{V}} ) \|_{\ell_2}^2, \\$$$
where $$$ \mathbf{d} \in \mathbb{C}^{P \times 1}$$$ denotes the vector of k-space data, $$$\Omega(\cdot) : \mathbb{C}^{N \times M} \rightarrow \mathbb{C}^{P \times 1}$$$ is a linear operator that concatenates the measured data into a vector, $$$\mathbf{F} \in \mathbb{C}^{N \times N}$$$ is the Fourier encoding matrix, and the columns of $$$\mathbf{U} \in \mathbb{C}^{N \times L}$$$ and rows of $$$\hat{\mathbf{V}} \in \mathbb{C}^{L \times M}$$$ span the spatial and temporal subspaces of the Casorati matrix. The Roemer equal noise algorithm8 was used for channel combination. Data processing were developed in-house using MATLAB (The MathWorks, Inc, Natick, MA).
4. Analysis
After 0th and 1st order phase correction, the SNR was calculated according to $$$\mathit{SNR}=\mathit{I}_{\mathit{water}}/\mathit{\sigma}(\mathit{I}_{\mathit{noise}})$$$, where $$$\mathit{I}_{\mathit{water}}$$$ is the water signal intensity and $$$\mathit{\sigma}(\mathit{I}_{\mathit{noise}})$$$ the standard deviation of the noise (8-12 ppm). Glucose and water maps were calculated by fitting the signal using the AMARES algorithm9.
Results and Discussion
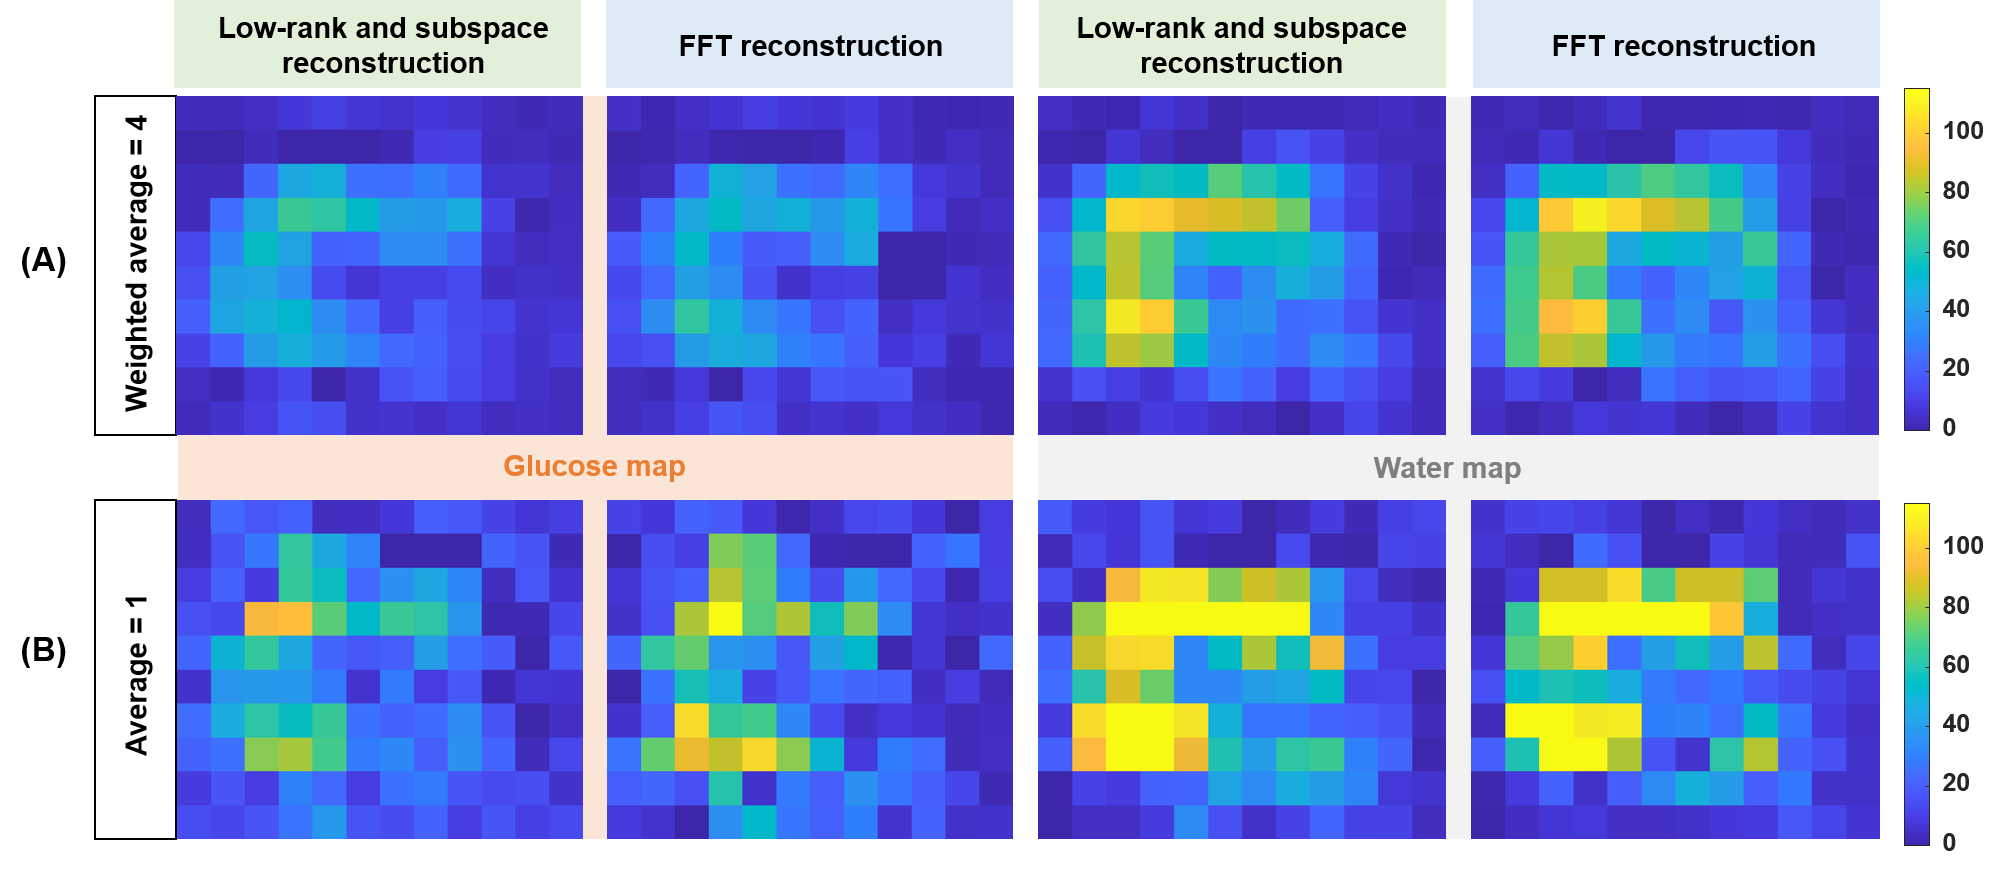
Figure 1 shows the generated numerical phantom mask in high-resolution and after down-sampling to low-resolution (Fig. 1A). The SNR (Fig. 2A) was calculated for different additive noise after applying two reconstruction methods: LRSM and FFT reconstruction. The LRSM reconstruction increased the SNR approximately 5-fold at noise level 10 (i.e., a noise standard deviation of 0.1). The metabolite maps of water and glucose (Fig. 2C) are similar to the ground truth when using either FFT or LRSM reconstruction with noise level 10. The Glx maps were noisier than the ground truth, especially for the FFT reconstruction (Fig. 2C). The average SNR (Fig. 3C) in the ROI of the liver (natural abundance DMRSI) was approximately 5-fold higher for LRSM compared to FFT reconstruction. While the natural abundance deuterated water signal was barely visible in some voxels with FFT reconstruction, LRSM reconstruction clearly showed signals in the liver. Figure 4 shows DMI data in the liver after oral intake of deuterated glucose for both reconstructions. The noise (Fig. 4B) is high and could be misinterpreted as a Glx signal for the FFT reconstruction, which is not the case for the LRSM reconstruction. The average SNR (Fig. 4C) of the deuterated water signal in the liver was about 3.5 times higher for the LRSM reconstruction. Glucose and water metabolite maps were created for both reconstruction methods (Fig. 5). The glucose map generated from the data with a single average showed more noise for the FFT reconstruction than for the LRSM reconstruction.Conclusion
This work demonstrates the implementation of low-rank and subspace modeling reconstruction of 3D DMI data of the human body at 7T. The reconstruction method reduces the noise level in the spectra, enabling metabolite detection in low SNR data. The enhanced metabolite detection could potentially increase spatial resolution and/or decrease acquisition time of 3D DMRSI, for example in combination with fast acquisition techniques such as DEPSI10.Acknowledgements
This project has received funding from the European Union’s Horizon 2020 research and innovation program under the Marie Sklodowska-Curie grant agreement (No. 813120) and was funded by an HTSM grant from NWO TTW (project number 17134) and by a FET Innovation Launchpad grant from the EU (grant number 850488).References
1. De Feyter HM, Behar KL, Corbin ZA, et al. Deuterium Metabolic Imaging (DMI) for MRI-Based 3D Mapping of Metabolism in Vivo. Vol 4.; 2018. doi: 10.1126/sciadv.aat7314
2. de Graaf RA, Hendriks AD, Klomp DWJ, et al. On the magnetic field dependence of deuterium metabolic imaging. NMR Biomed. 2020;33(3). doi:10.1002/nbm.4235
3. Lam F, Liang ZP. A subspace approach to high-resolution spectroscopic imaging. Magn Reson Med. 2014;71(4):1349-1357. doi:10.1002/mrm.25168
4. Lam F, Ma C, Clifford B, Johnson CL, Liang ZP. High-resolution 1H-MRSI of the brain using SPICE: Data acquisition and image reconstruction. Magn Reson Med. 2016;76(4):1059-1070. doi:10.1002/mrm.26019
5. Wiesner HM,
Guo R, Li Y, et al. High-resolution 3D Phosphorus Metabolic Imaging of the
Human Brain at 7T using SPICE. Proc Intl Soc Mag Reson Med 29
(2021), #0235.
6. Lam F, Li Y, Guo R, Clifford B, Liang ZP. Ultrafast magnetic resonance spectroscopic imaging using SPICE with learned subspaces. Magn Reson Med. 2020;83(2):377-390. doi:10.1002/mrm.27980
7. Liang Z-P.
Spatiotemporal Imaging with Partially Separable Functions. IEEE
Int Symp Biomed Imaging. 2007;2:988-991.doi: 10.1109/ISBI.2007.357020
8. Roemer PB, Edelstein WA, Hayes CE, Souza SP, Mueller OM. The NMR phased array. Magn Reson Med. 1990;16(2):192-225. doi:10.1002/mrm.1910160203
9. Vanhamme L, Van Den Boogaart A, Van Huffel S. Improved Method for Accurate and Efficient Quantification of MRS Data with Use of Prior Knowledge. J Magn Reson. 1997;129(1):35-43. doi:10.1006/jmre.1997.1244
10. Nam KM, Gursan A, Bhogal A, et
al. Deuterium Echo-Planar Spectroscopic Imaging (DEPSI) to Dynamically Monitor
Deuterated Glucose in the Liver at 7T. Proc Intl Soc Mag Reson Med 29
(2021), #0231.
Figures