0631
39K/23Na MRI detects changes in muscular ion concentrations after exercise and in delayed-onset muscle soreness1Institute of Radiology, University Hospital Erlangen, Friedrich-Alexander-Universität Erlangen-Nürnberg (FAU), Erlangen, Germany, 2Department of Medicine 3, University Hospital Erlangen, Friedrich-Alexander-Universität Erlangen-Nürnberg (FAU), Erlangen, Germany, 3Institute of Medical Physics, Friedrich-Alexander-Universität Erlangen-Nürnberg (FAU), Erlangen, Germany, 4Division of Medical Physics in Radiology, German Cancer Research Center (DKFZ), Heidelberg, Germany
Synopsis
In this work, we investigated changes in the tissue potassium and sodium concentrations (TPC/TSC) of calf muscle tissue after exercise and in delayed-onset muscle soreness (DOMS) using combined 39K/23Na MRI. 14 healthy subjects were examined at baseline, directly after performing eccentric exercises and again 48h after exercise. Sodium and potassium concentrations showed inverse evolution, with changes in TSC being approximately twice as high as in TPC. Moreover, TPC was elevated in sore muscles without obvious edema, while TSC had returned to baseline or below. Thus, combined 39K/23Na MRI might help to elucidate physiological processes associated with DOMS and muscle fatigue.
Introduction
Due to their concentration gradients between the intra- and extracellular space, sodium (Na+) and potassium (K+) ions play a vital role in the excitability of muscle cells. These gradients are maintained by the Na+/K+-ATPase, which transports Na+ out of the cell and K+ into the cell. During exercise, Na+/K+-ATPase activity is increased to restore the equilibrium ion distribution. However, at high stimulation frequencies, K+ efflux can exceed the capacity of the ion pumps, resulting in cell depolarization and thus, loss of cell excitability. Persisting ion perturbations are thought to be one cause for muscle fatigue. Moreover, excessive training can lead to myofiber necrosis and inflammation, and consequently reduced muscle strength and range of motion. A better understanding of the pathophysiological processes causing delayed-onset muscle soreness (DOMS) and muscle fatigue is desirable to optimize training schedules and reduce associated injuries.Changes of sodium concentration in calf muscle tissue directly after exercise have already been investigated before using 23Na MRI1-3. However, only recent advances in ultrahigh-field MRI have made it possible to perform 39K MRI in vivo with a sufficiently high signal-to-noise ratio. Thus, we aimed to perform quantitative 39K MRI measurements of the lower leg to assess potential changes in the tissue potassium concentration (TPC) after exercise and in DOMS. Additionally, we compared these changes to corresponding changes in the tissue sodium concentration (TSC).
Methods
14 healthy subjects (7 m, 7 f, mean age 25.0 ± 2.8 years) were enrolled in this study with approval of the local Ethics Committee. Participants conducted five sets of eccentric exercises on a specifically manufactured stair with additional weight (for detailed information, see Kellermann et al.4). MRI of the lower leg was performed at baseline (t0), directly after training (t1), and 48 h after exercise (t2). Maximum symptoms of muscle soreness are usually experienced 48-72h after training. 23Na and 39K MRI data sets were acquired at a whole-body 7T MRI system (Magnetom Terra, Siemens Healthcare GmbH, Erlangen, Germany) using a dual-tuned, quadrature birdcage 23Na/39K RF coil (Rapid Biomedical GmbH, Rimpar, Germany) tailored for calf examinations. An acquisition-weighted Stack-of-Stars (AW-SOSt) sequence was used for 23Na/39K MRI (protocol parameters see Table 1).5 Moreover, T1 weighted turbo spin echo (TSE) as well as time-of-flight (TOF) 1H MRI data were acquired at a 3T whole-body system (Magnetom Prisma, Siemens Healthcare GmbH, Erlangen, Germany) using an 18-channel flexible RF coil. In addition, blood serum Creatine Kinase (CK) levels were measured at all time points.For quantitative evaluation of the data, T1 TSE 1H images were segmented manually into Musculus Gastrocnemius, Caput Medialis/Lateralis (GM/GL), Musculus Soleus (SOL) and Musculus Tibialis Anterior (TA). Additionally, the entire intra-fascial muscle tissue, subcutaneous adipose tissue (SAT) as well as blood vessels were extracted from the T1 TSE and TOF MRI data, respectively, using (semi-)automatic approaches (compare Fig.1).6,7 23Na/39K data sets were co-registered to the T1 TSE 1H data using a non-rigid image registration tool8. Moreover, 23Na and 39K signal intensities were corrected using a region-based partial volume correction (PVC)9, as well as relaxation correction10. TSC and TPC values were determined using the corrected signal intensities based on five external references containing NaCl and KCl solution ([Na]/[K] = 10/240,20/210,25/180,30/150,40/120 mM).
Results
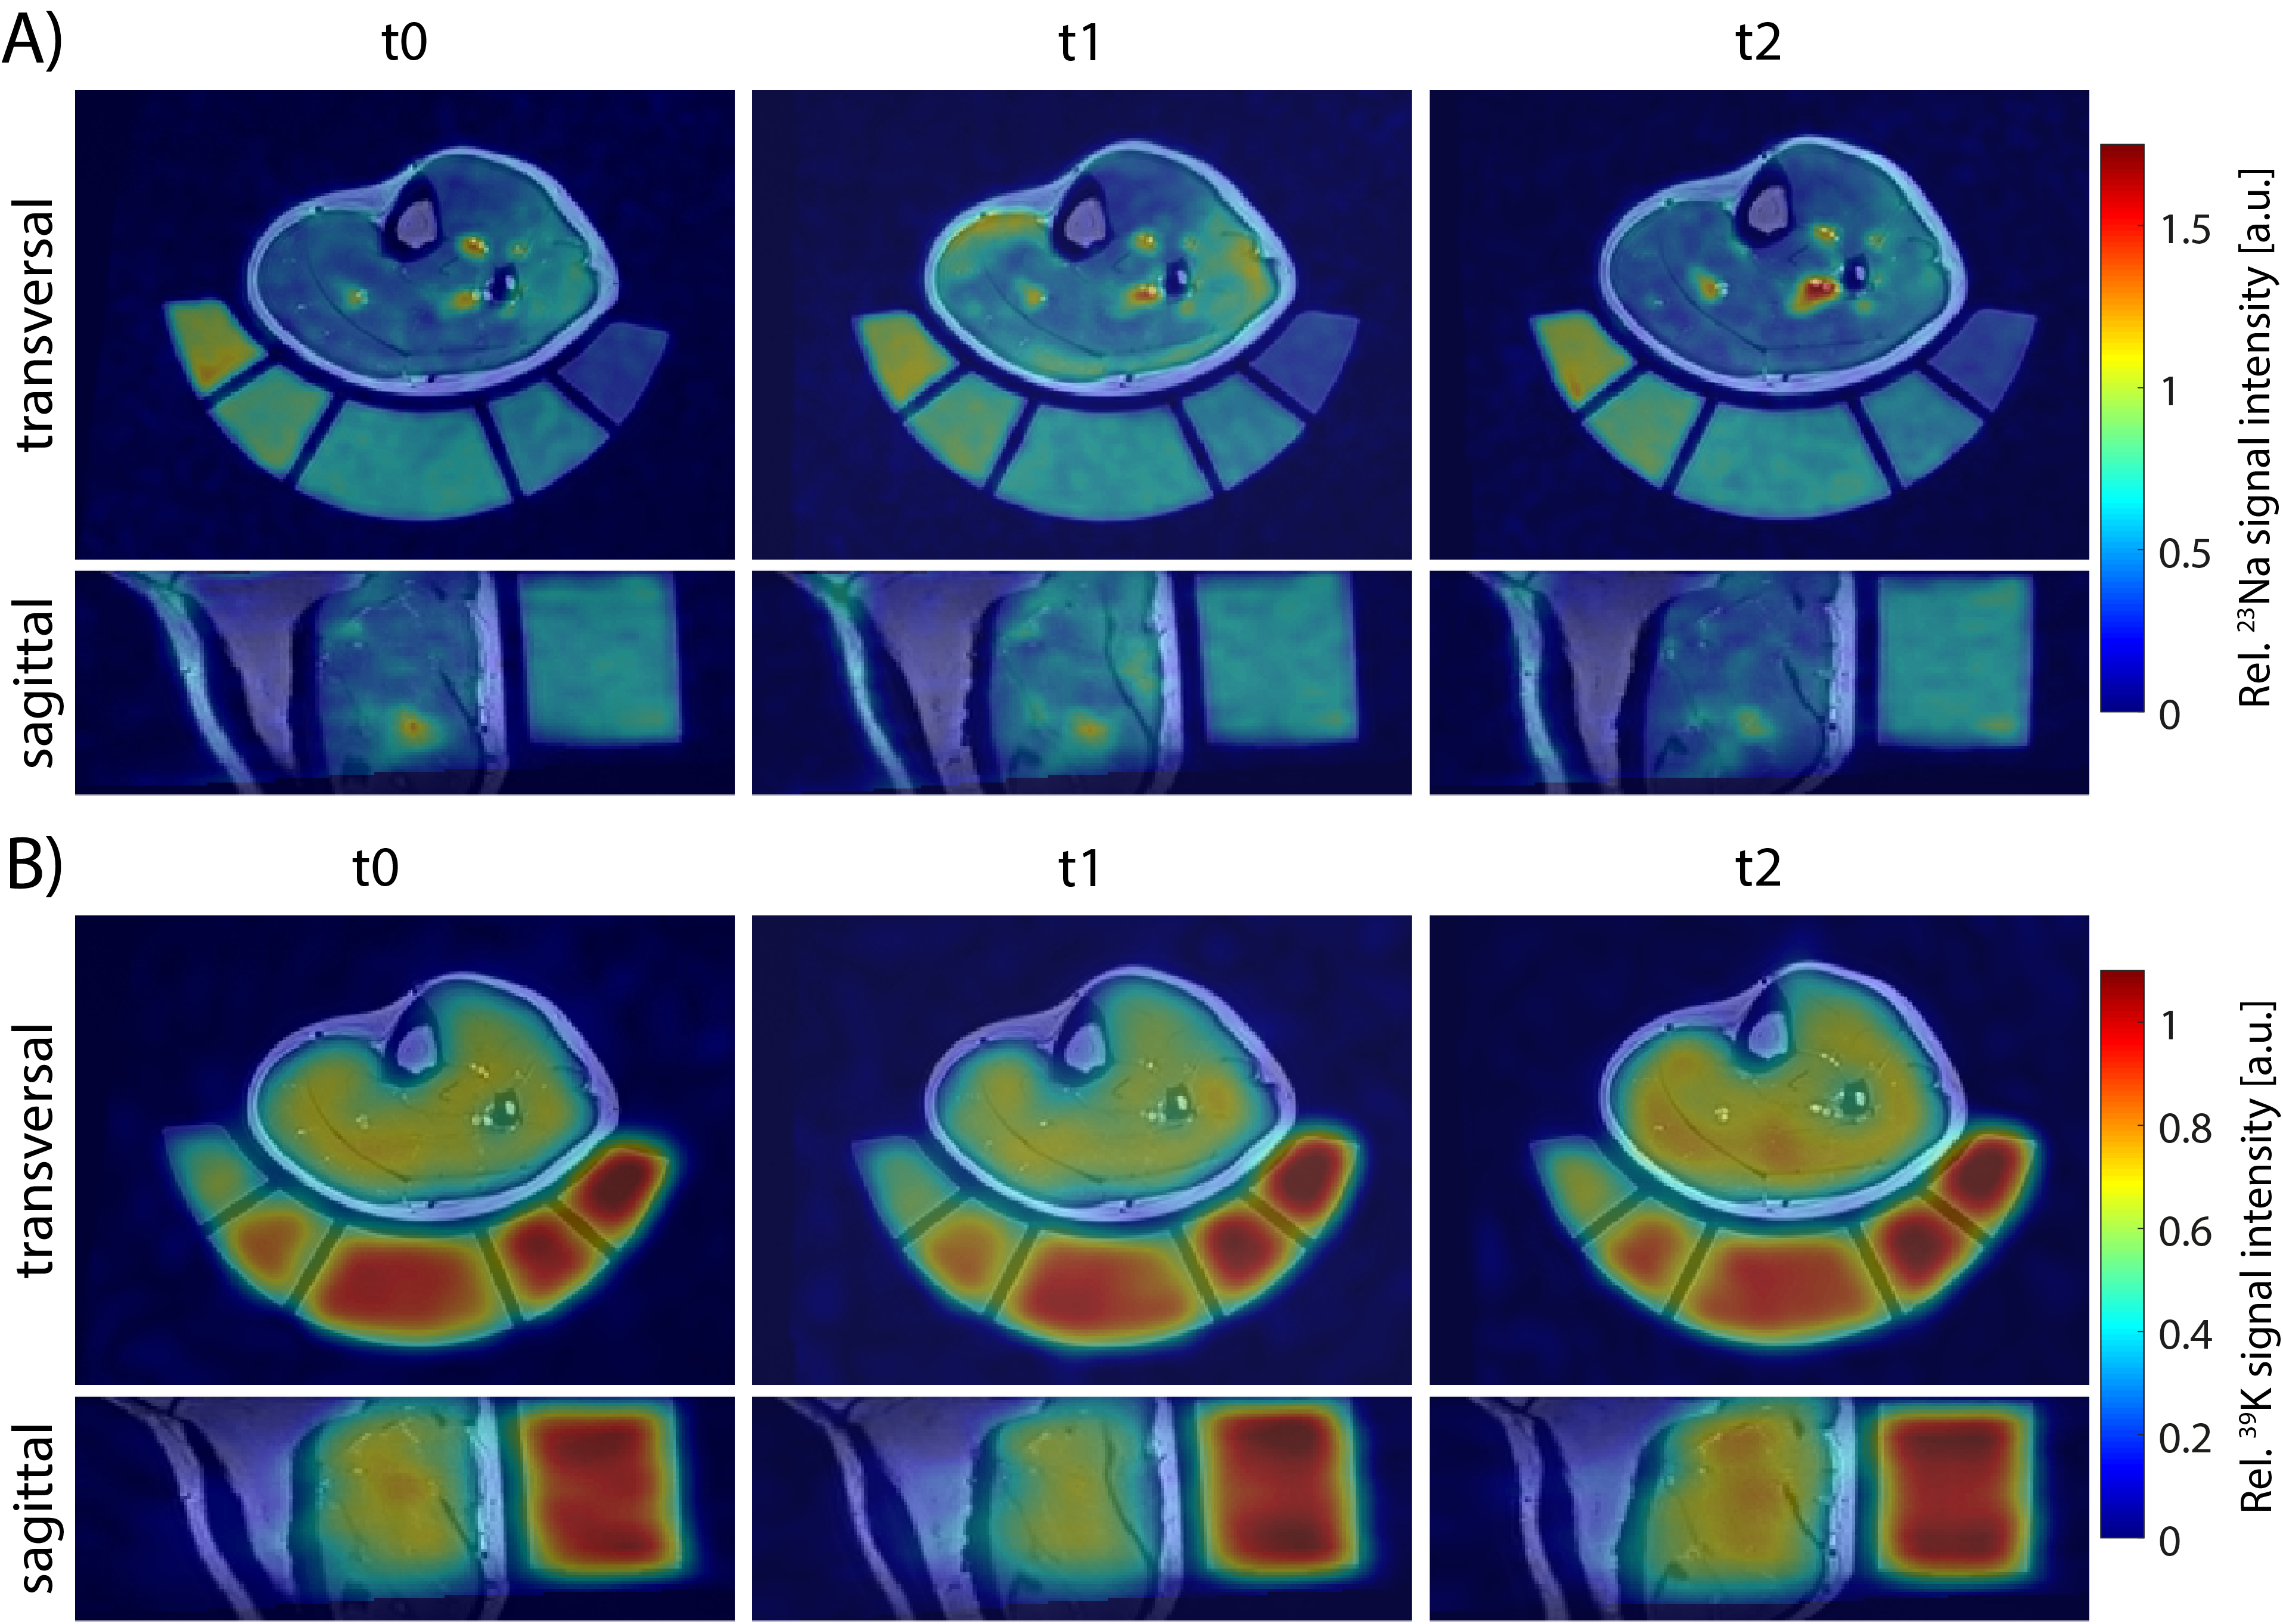
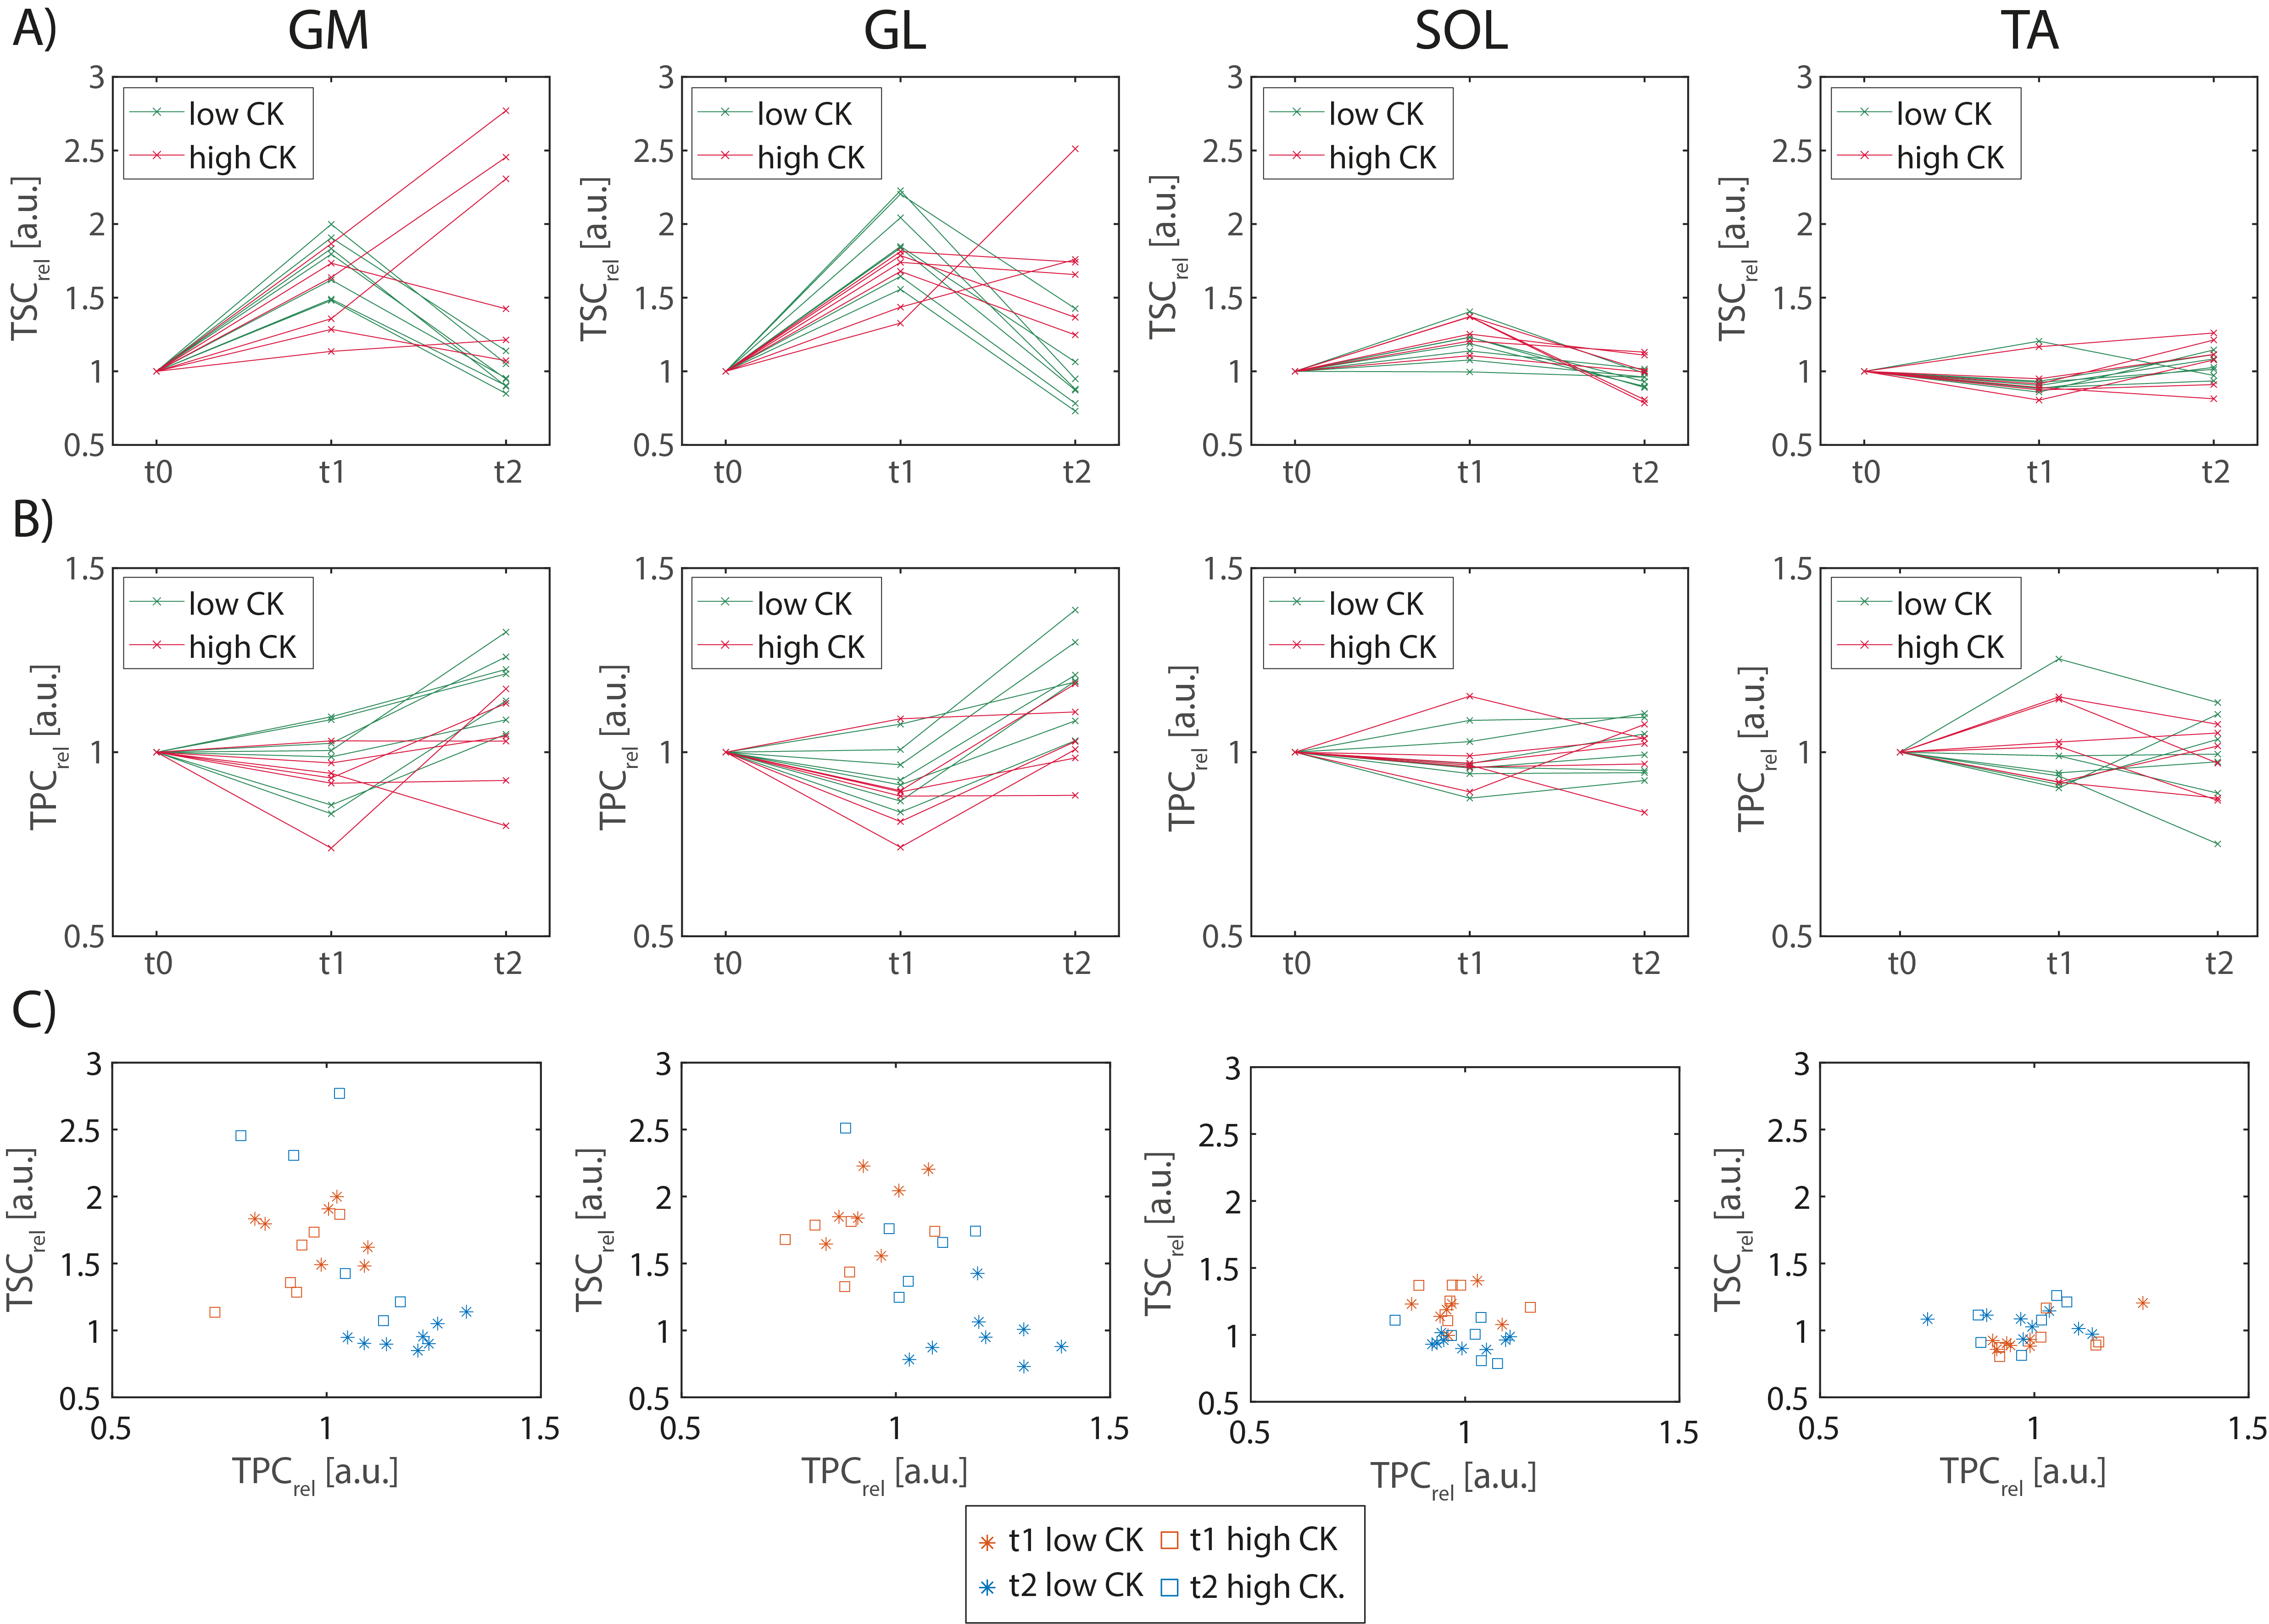
According to their CK levels at t2 relative to t0, subjects were divided into two groups: Participants with CKt2 < 10·CKt0 were considered as “low CK”, while CKt2 > 10·CKt0 were considered as “high CK” participants. Exemplary 23Na/39K images overlaid with corresponding T1 1H images of a high and a low CK subject are shown in Fig. 2 and 3, respectively. At t1, a similarly increased 23Na signal intensity was observed in all muscles but TA in both subjects. At t2, the high CK subject exhibited a strongly enhanced 23Na signal intensity as well as reduced 39K signal intensity in exercised muscles (GM/GL). No obvious changes in 23Na signal intensity at t2 compared to t0 were observed in the low CK participant, while 39K signal intensity was elevated. These findings were consistent across all participants (see Fig. 4). Overall, TSC and TPC evolved in an inverse way, and relative changes in TSC were approximately twice as high as in TPC.Discussion
In this study, we assessed the effect of exercise on sodium and potassium concentrations in lower leg muscles. We observed an increased TSC directly after exercise, which is in accordance with previous studies1-3. While in low CK participants, TSC returned to baseline (or even below) after 48h, an increased TPC was observed. In contrast, some of the high CK participants had strongly increased TSC in GM/GL with simultaneously reduced TPC at t2. Different studies have reported a decline of sodium signal intensity after exercise with a half-life of approx. 30 min1,2, or a recovery to baseline within 50 min3. However, these studies did not examine TSC in DOMS. Changes of potassium concentration in muscle tissue have not yet been investigated so far.Conclusion
Using 39K and 23Na MRI at 7T, it is possible to assess changes in muscular ion concentrations after exercise and in delayed-onset muscle soreness. This might help to understand the physiological processes connected to DOMS and muscle fatigue, and therefore to improve training protocols.Acknowledgements
No acknowledgement found.References
1. Bansal N, Szczepaniak L, Ternullo D, Fleckenstein JL, Malloy CR. Effect of exercise on 23Na MRI and relaxation characteristics of the human calf muscle. J Magn Reson Imaging. 2000;11(5):532-538.
2. Chang G, Wang L, Schweitzer ME, Regatte RR. 3D 23Na MRI of human skeletal muscle at 7 Tesla: initial experience. Eur Radiol. 2010;20(8):2039-2046.
3. Hammon M, Grossmann S, Linz P, et al. 3 Tesla (23)Na magnetic resonance imaging during aerobic and anaerobic exercise. Acad Radiol. 2015;22(9):1181-1190.
4. Kellermann M, Heiss R, Swoboda B, et al. Intramuscular Perfusion Response in Delayed Onset Muscle Soreness (DOMS): A Quantitative Analysis with Contrast-Enhanced Ultrasound (CEUS). Int J Sports Med. 2017;38(11):833-841.
5. Müller M., Gast LV, Hensel B, Uder M, Nagel AM. Comparison of anisotropic UTE sequences for 23Na/39K imaging in the human calf at 7T. Proc Intl Soc Mag Reson Med 27. 2019:4207.
6. Chaudry O, Friedberger A, Grimm A, et al. Segmentation of the fascia lata and reproducible quantification of intermuscular adipose tissue (IMAT) of the thigh. MAGMA. 2021;34(3):367-376.
7. Meixner CR, Liebig P, Speier P, et al. High resolution time-of-flight MR-angiography at 7T exploiting VERSE saturation, compressed sensing and segmentation. Magn Reson Imaging. 2019;63:193-204.
8. Klein S, Staring M, Murphy K, Viergever MA, Pluim JP. elastix: a toolbox for intensity-based medical image registration. IEEE Trans Med Imaging. 2010;29(1):196-205.
9. Niesporek SC, Hoffmann SH, Berger MC, et al. Partial volume correction for in vivo (23)Na-MRI data of the human brain. Neuroimage. 2015;112:353-363.
10. Gast LV, Volker S, Utzschneider M, et al. Combined imaging of potassium and sodium in human skeletal muscle tissue at 7 T. Magn Reson Med. 2021;85(1):239-253.
Figures

Table 1: MRI sequence parameters for 23Na and 39K acquisitions as well as 1H T1 TSE and TOF measurements.
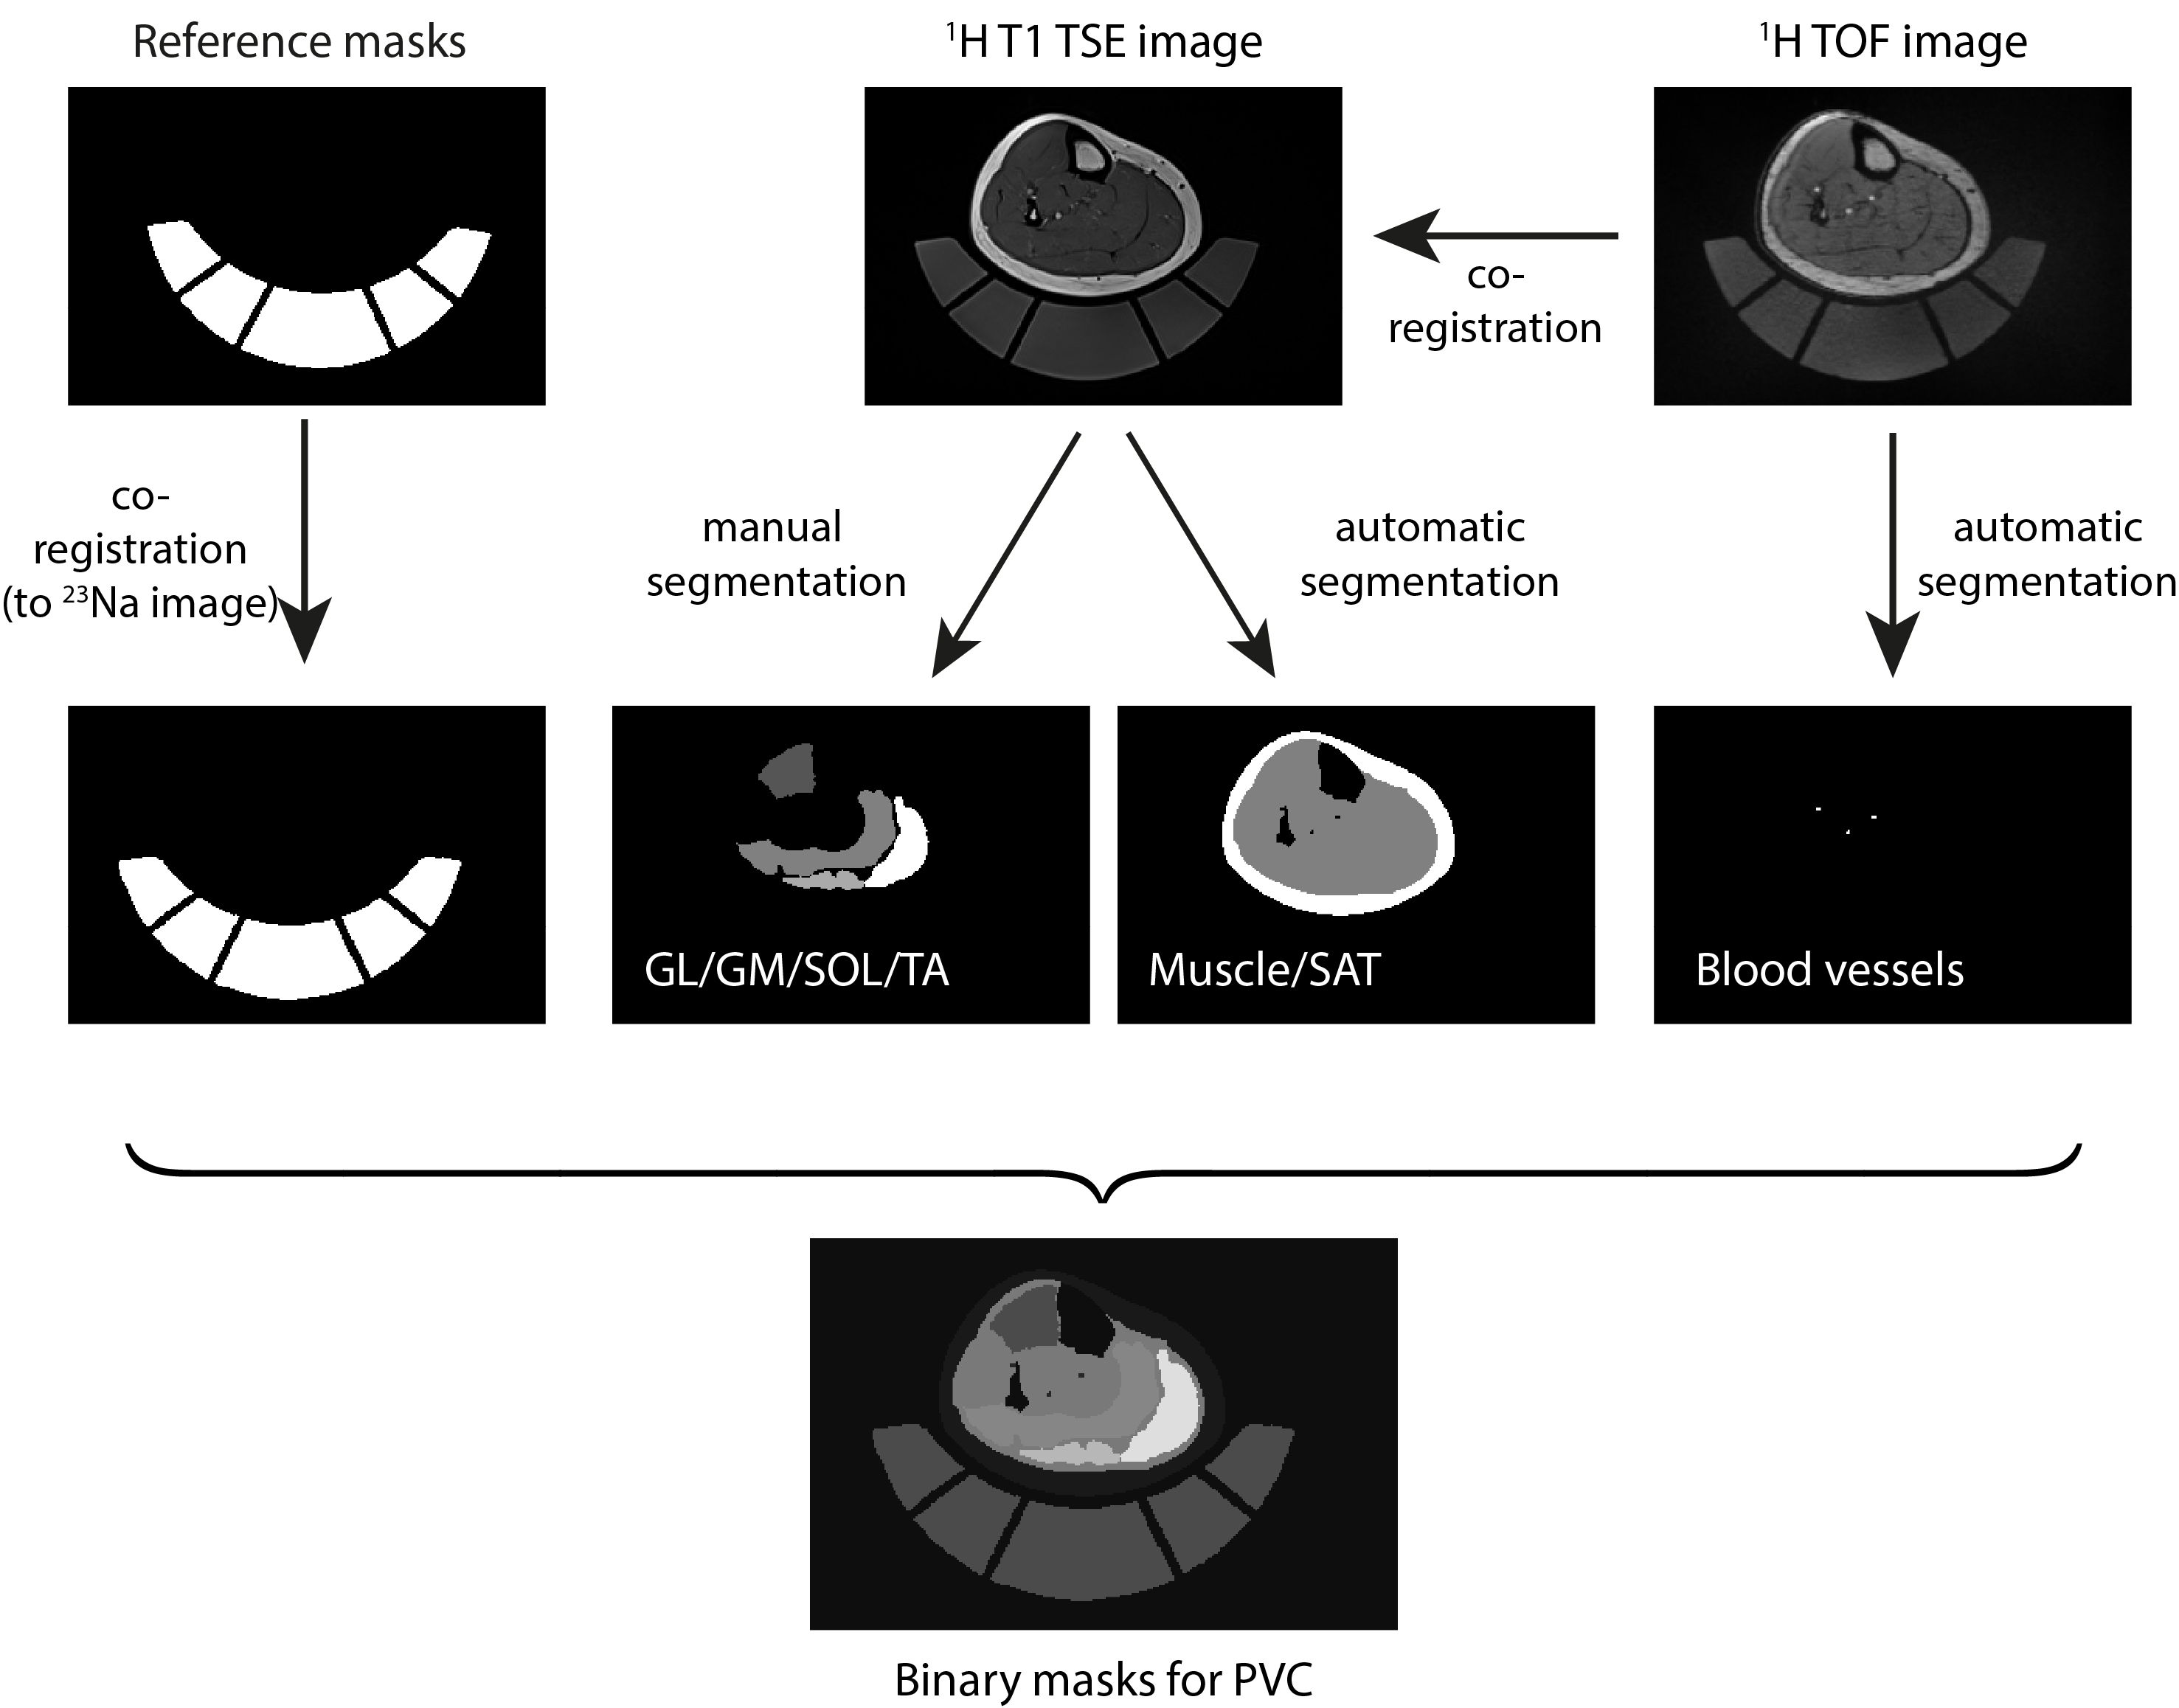
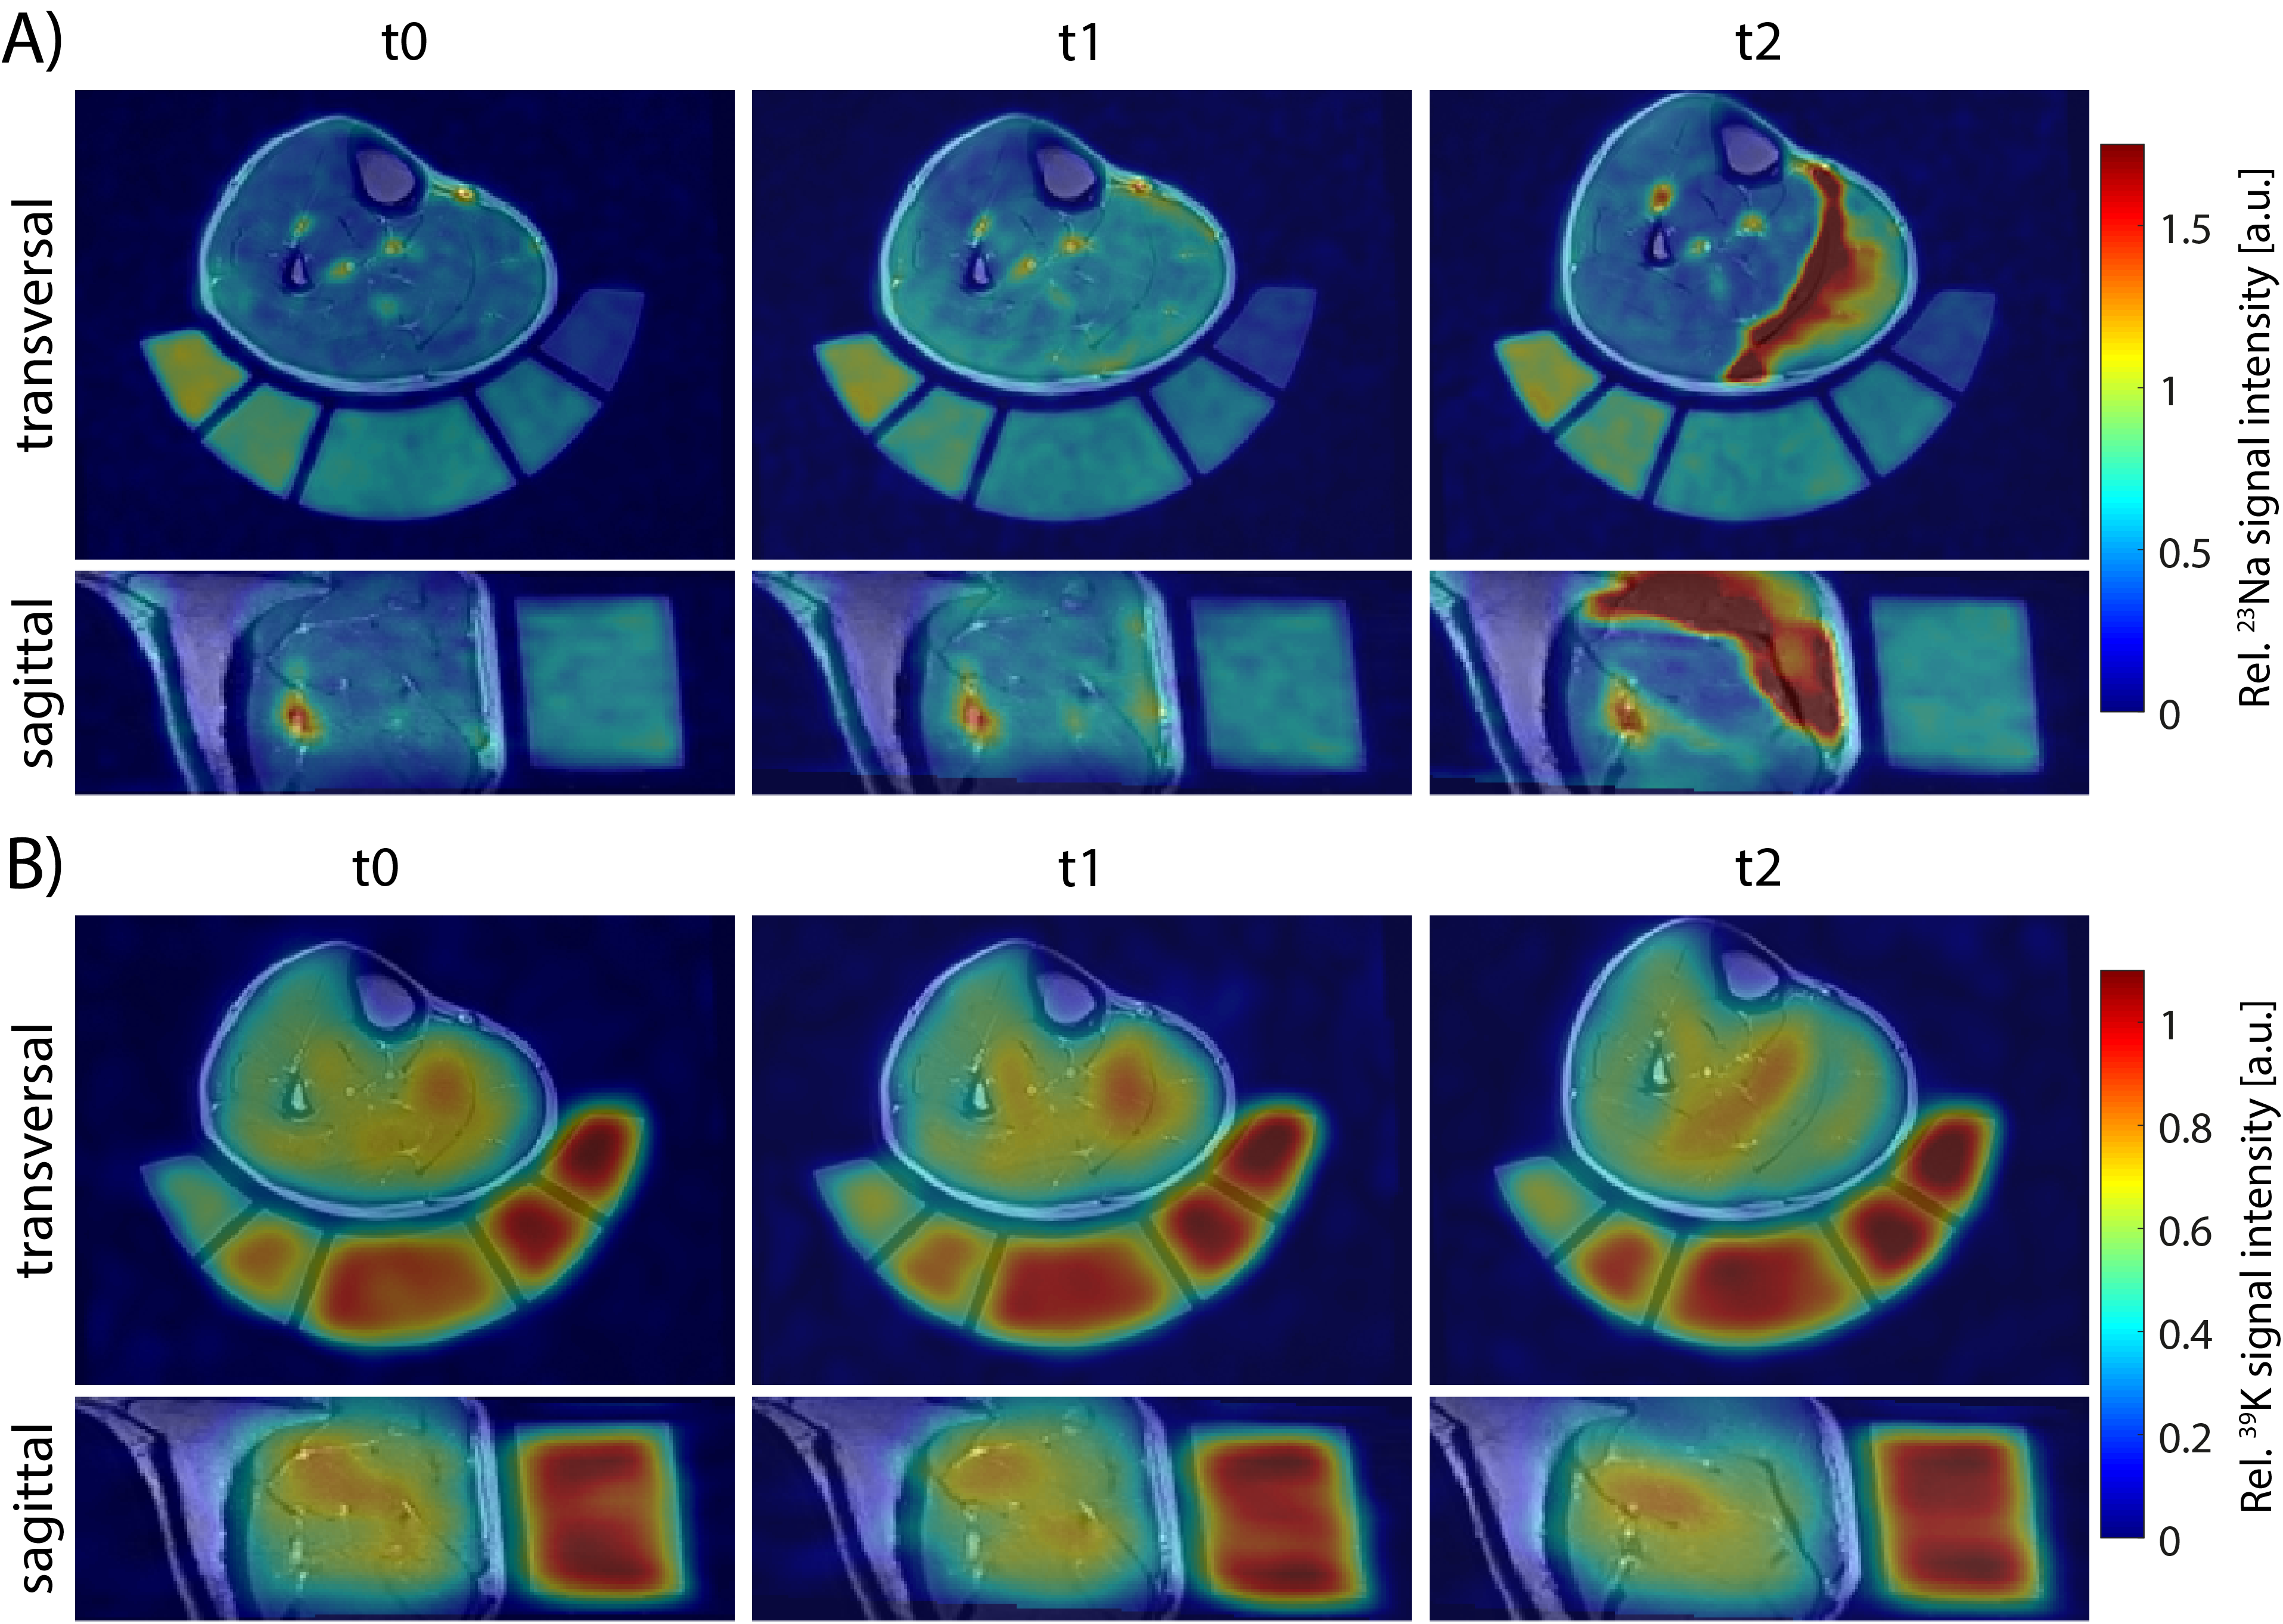
Figure 2: Transversal and sagittal view of 23Na (A) and 39K (B) MR images overlaid to 1H T1 TSE images of a “high CK” participant at different time points. During 23Na/39K measurements at 7T and 1H acquisitions at 3T, the leg was positioned on a holder containing reference solutions to improve image co-registration. 23Na/39K MR signal intensities were normalized to the mean signal intensity within the reference containing the highest ion concentration. The shown subject exhibited severe DOMS at t2, with a strongly increased 23Na and a reduced 39K signal intensity in exercised muscles.