0630
Deuterium labeling enables non-invasive 3D proton MR imaging of glucose and neurotransmitter metabolism in the human brain1High Field MR Center, Medical University of Vienna, Vienna, Austria, 2Department of Medicine III, Medical University of Vienna, Vienna, Austria, 3Center for Magnetic Resonance Research, University of Minnesota, Minneapolis, MN, United States, 4Department of Psychiatry ans Psychotherapy, Medical University of Vienna, Vienna, Austria, 5Department of Neurosurgery, Medical University of Vienna, Vienna, Austria
Synopsis
Recent studies have proposed deuterium (2H)-Magnetic Resonance Spectroscopic Imaging (MRSI) as a reliable, non-invasive, and safe method to quantify the human metabolism of 2H-labeled substrates such as glucose and their downstream metabolism and address the major drawbacks of positron emission tomography or carbon (13C)-MRS. Here, we pioneered a dynamic proton 3D (1H)-MRSI for indirect 2H-measurements in humans. In contrast to 2H-MRS(I), the method provides higher sensitivity and chemical specificity to differentiate glutamate, glutamine, and gamma-aminobutyric acid deuterated at specific molecular positions while simultaneously mapping both labeled and unlabeled metabolites without specialized hardware after peroral ingestion of 2H-labeled glucose.
Purpose
While current approaches for glucose metabolism assessments such as positron emission tomography (PET), 13C magnetic resonance spectroscopy (13C-MRS), and direct deuterium imaging1 are technically challenging when requiring special hardware or expensive synthesis of intravenous radioactive tracers, a recent animal study showed the incredible potential of indirect detection of deuterated compounds via proton magnetic resonance spectroscopy (1H-MRS) to quantify glucose (Glc) metabolism in the rat brain.2 The method of indirect 2H detection enables quantification of both oxidative and anaerobic Glc utilization and neurotransmitter synthesis. Thus, we aimed to establish, for the first time, non-invasive detection of deuterium enrichment of downstream Glc metabolites such as glutamate (Glu), glutamine (Gln), and gamma-aminobutyric acid (GABA) after peroral administration of 6,6’-2H2-glucose (Deu-Glc) using state-of-the-art 1H-MRS3/MRSI4 in the human brain.Methods
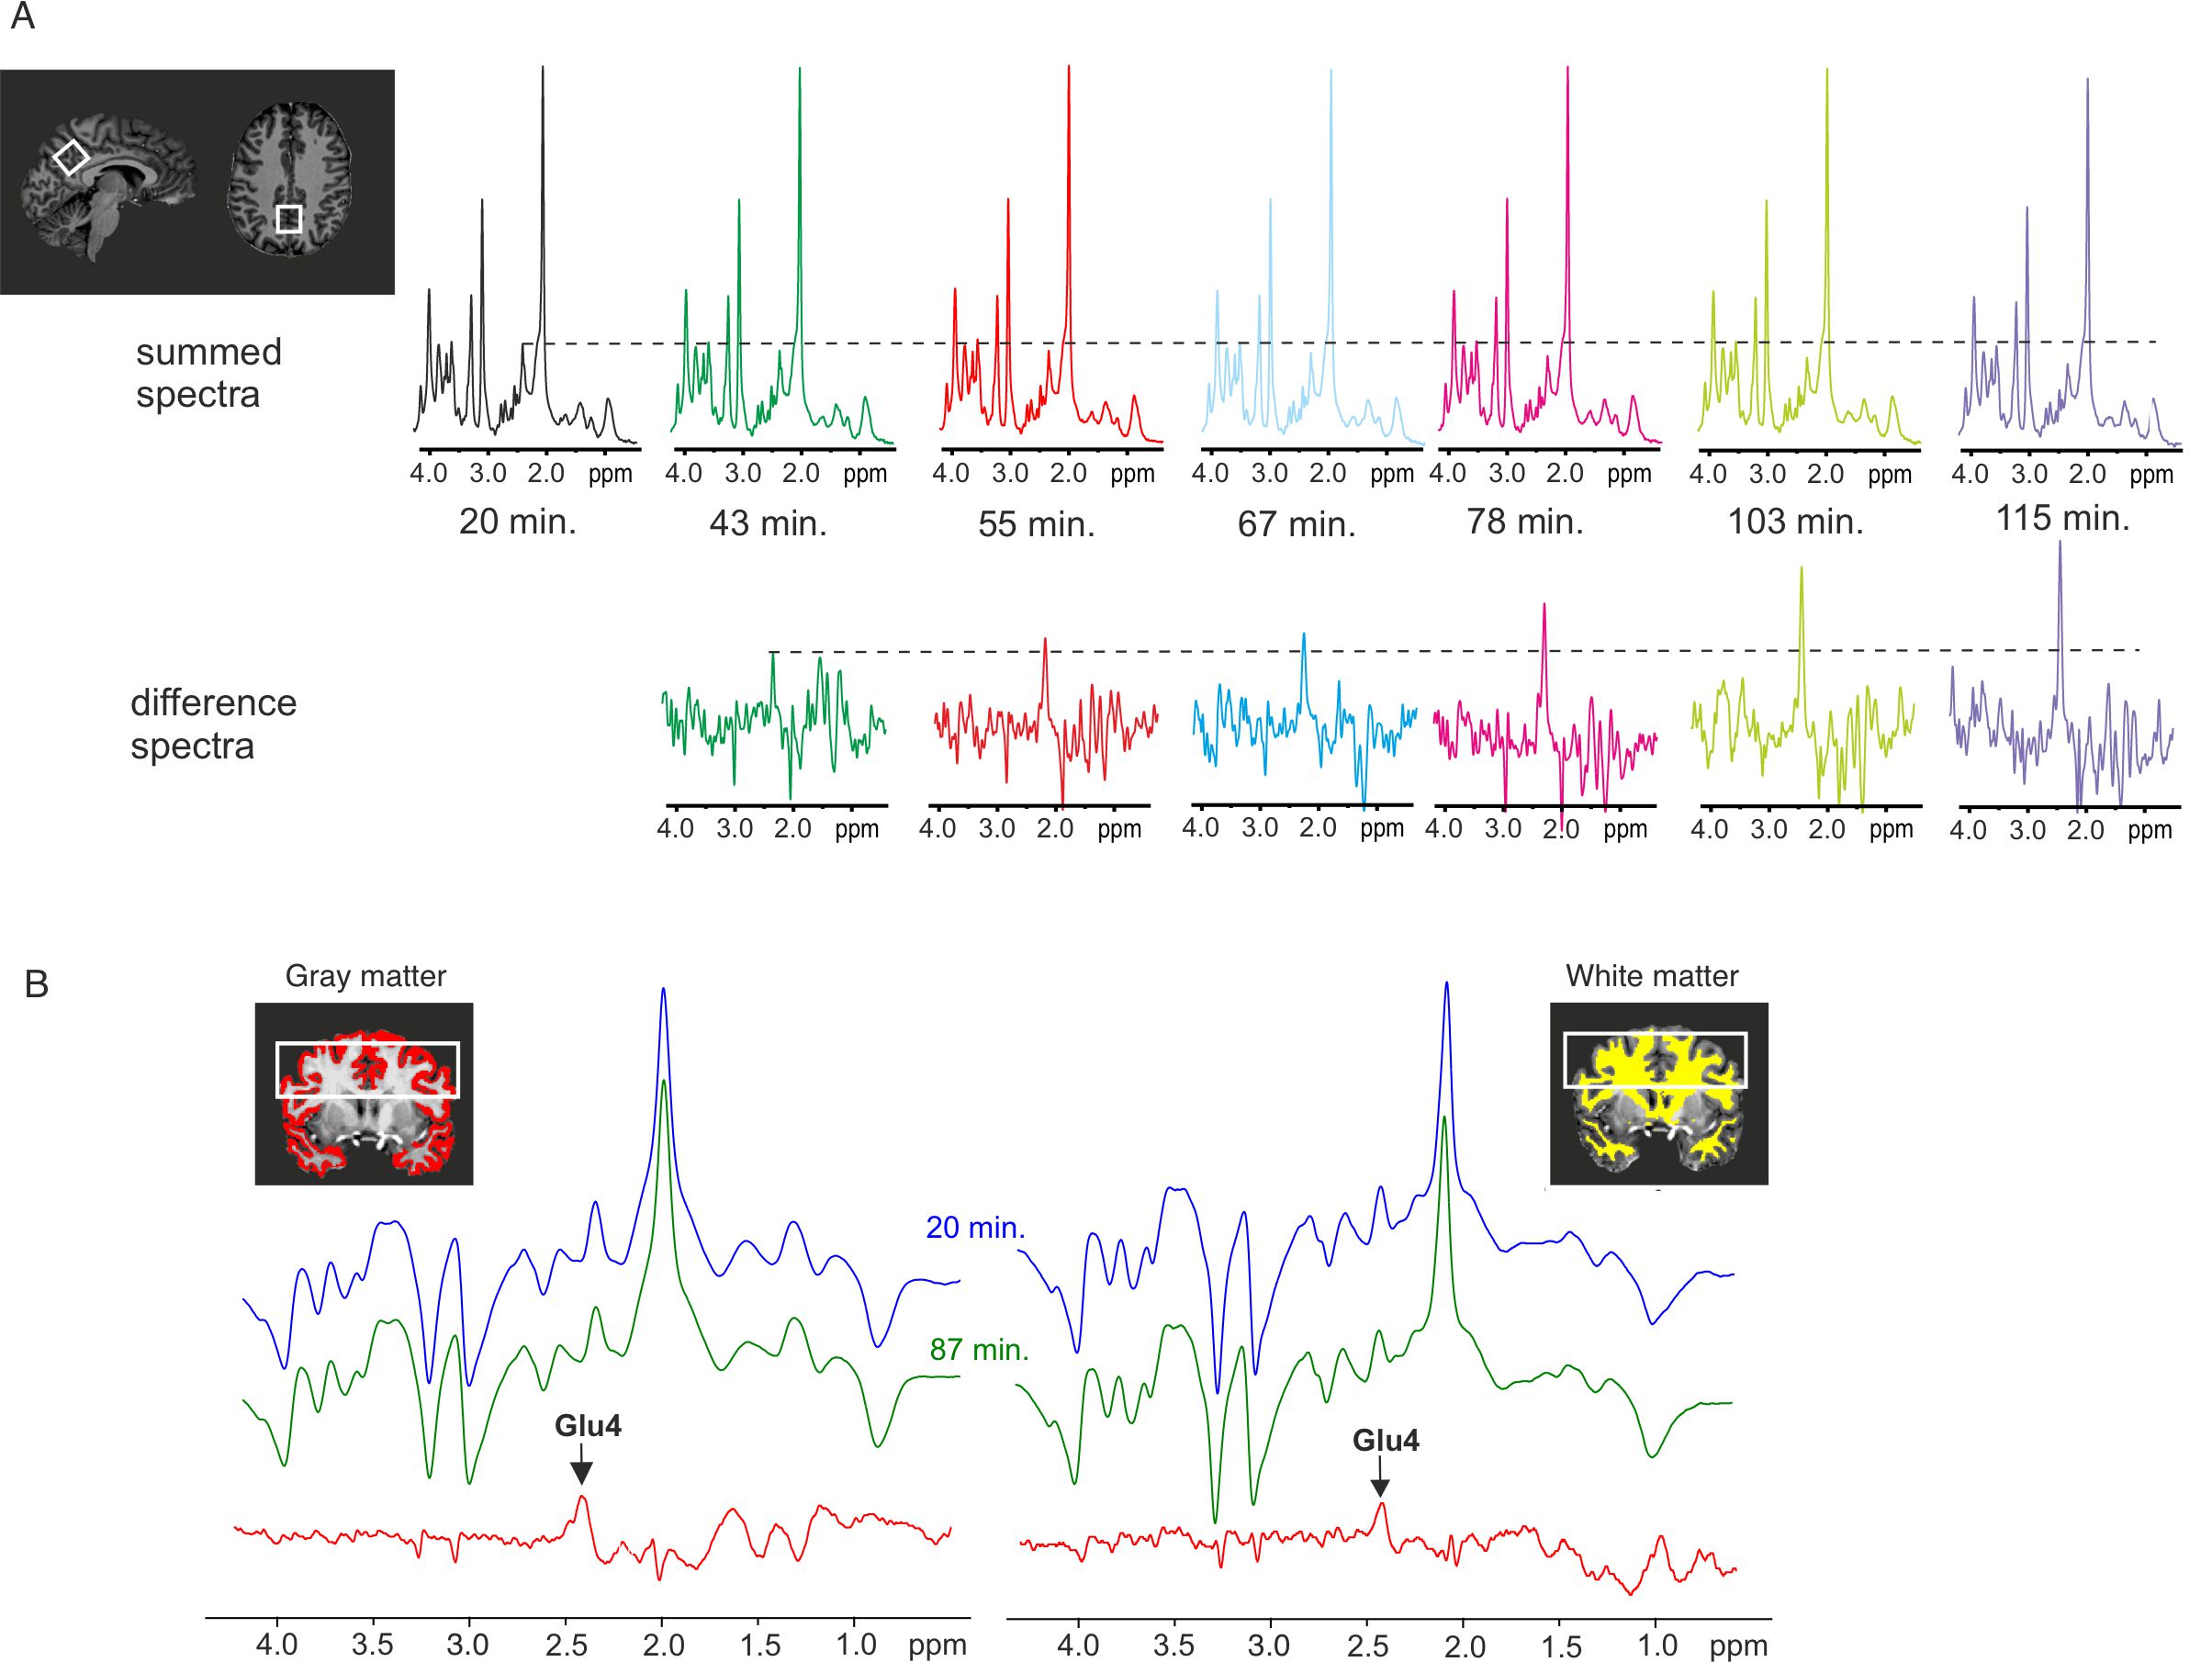
Five healthy lean volunteers (30±4 y.o., four males) were scanned after overnight fasting at 7T MR system utilizing a single-channel transmit/ 32-channel receive-array Nova head coil. Each participant had 2 separate MR sessions immediately after Deu-Glc and non-deuterated D-Glc (nonDeu-Glc) (0.8 g/kg) administration. MRSI and MRS data were interleaved with Siemens Autoalign navigator to assure the stable position of the localized volume.5 The first MRS/MRSI block was acquired after MRS calibrations and B0-shimming within 30 minutes after Deu-Glc/nonDeu-Glc administration. Standard 2nd-order B0-shimming was performed via an imaging-based approach (2 iterations) and FASTMAP6 for MRSI and MRS, respectively. Multivoxel FID-MRSI was performed with ultrashort TE of 1.3 ms, TR of 320 ms, 3D k-space concentric ring encoding, variable temporal interleaves, 36x36x26 matrix, and 5x5x4.8 mm3 voxel size.7The FOV was 180x180x110 mm to minimize acquisition time (3 min. per block) and lipid contamination. A four cm-thick slab was centered around the posterior cingulate region (PCC). Single-voxel MRS data were obtained from the PCC (22×20×20 mm) using a semi-LASER pulse sequence (TR = 7s, TE = 28 ms, AT = ~4 min.).8 The metabolite spectra were collected with VAPOR water suppression9 and outer volume suppression (number of excitations = 32). Unsuppressed water spectra were utilized to remove residual eddy currents and as a reference for quantification. Basis sets of simulated spectra for LCmodel included separated Glu4 and Glu2+3 components accounting for the prominent effect of deuteration on C4 position in Glu molecule. Separate Gln4 and GABA2 components allowed the stable fitting of MRS data but were not used to quantify MRSI.Results
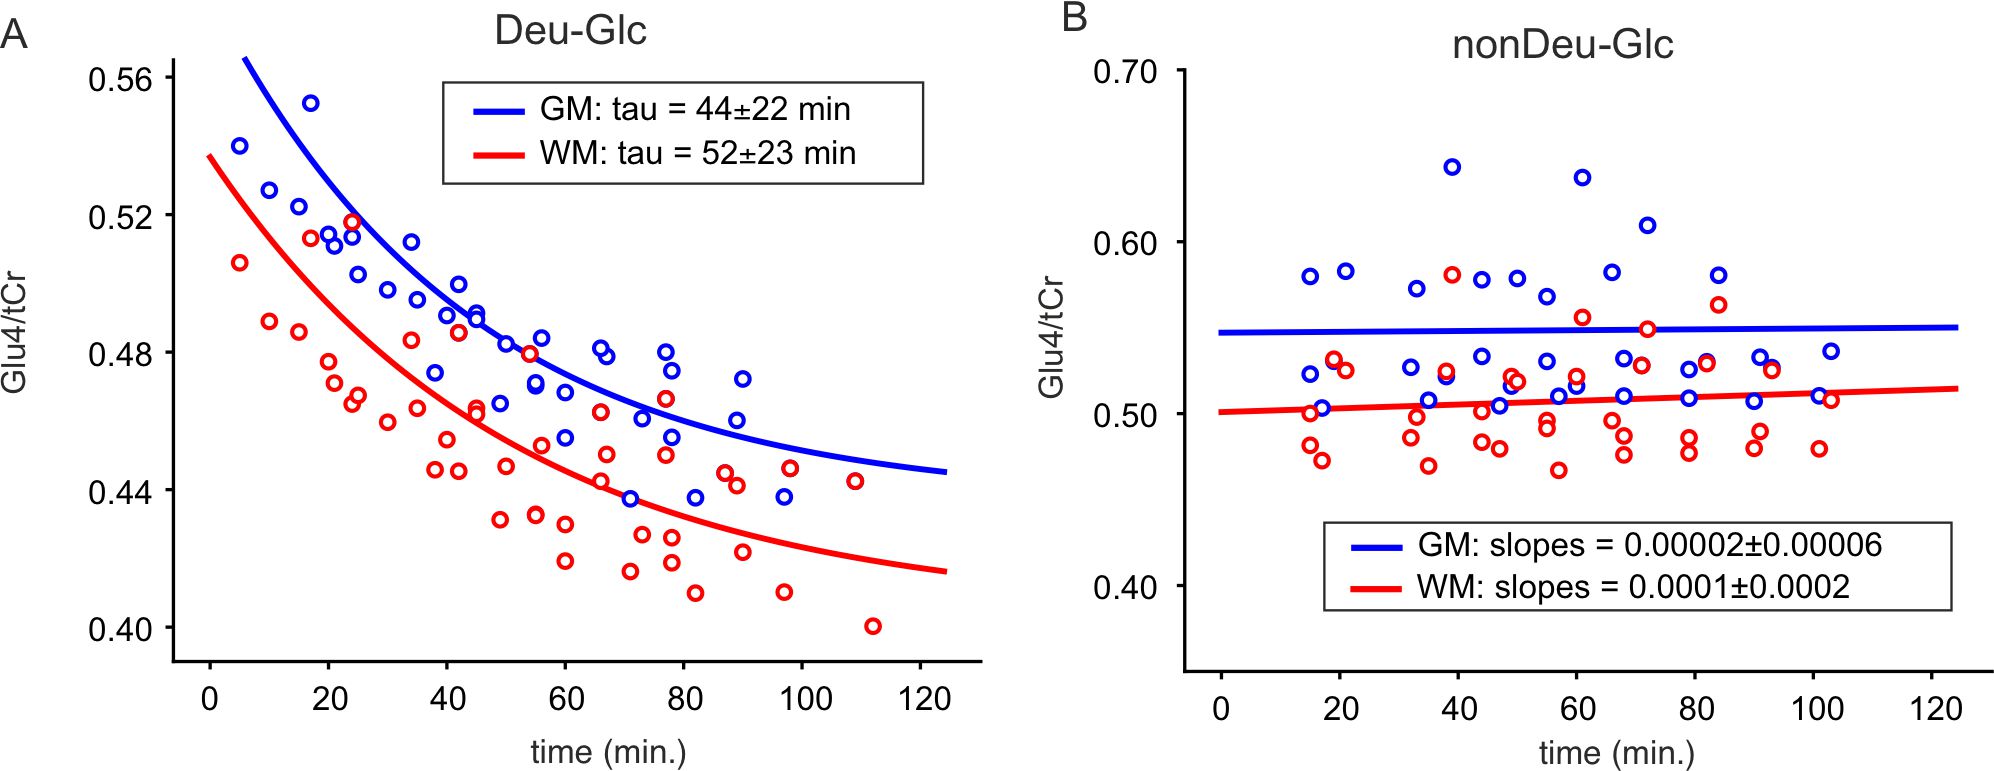
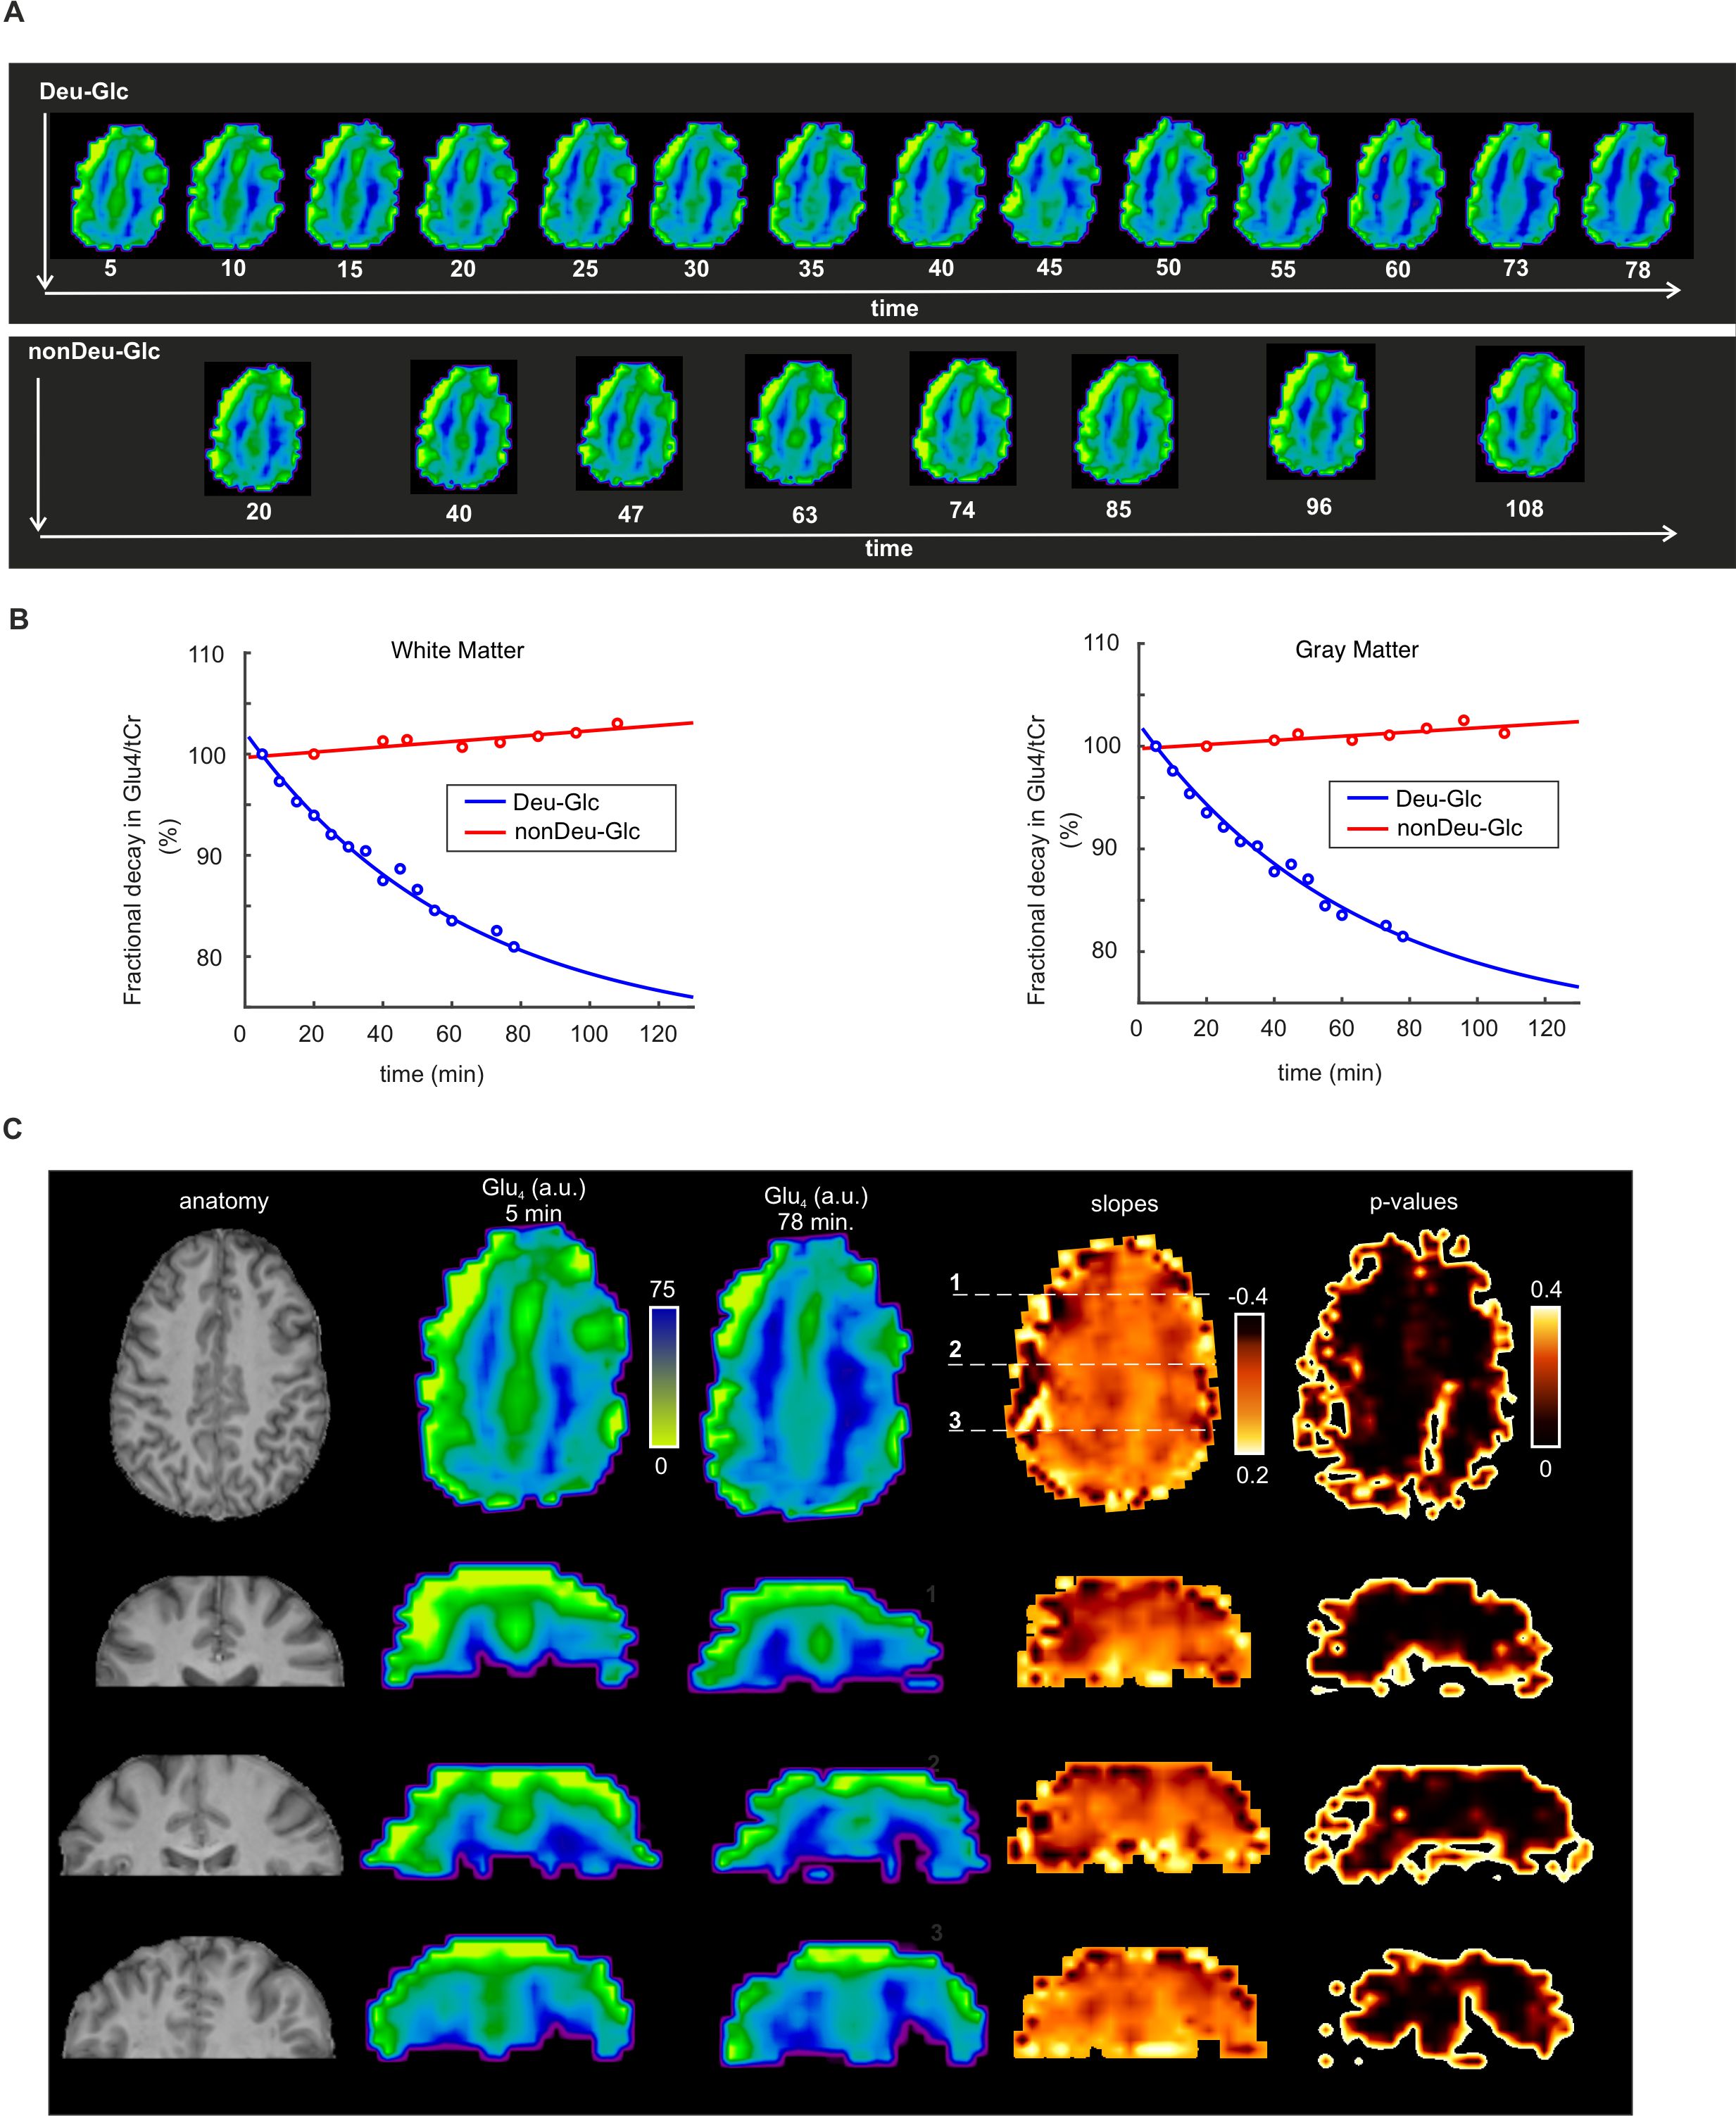
Significant decreases of Glu4 and Gln4 in the PCC (14±2%, 12±5% resp.) and 13±4% and 14±3% decrease of Glu4 in the whole gray (GM) and white matter (WM) after Deu-Glc (first minus last point) were detected using MRS and MRSI, respectively. All metabolites quantified in LCmodel did not change significantly after nonDeu-Glc. Glu4 was quantified with within-session CVs of ~2% as calculated in PCC and from regional averages in GM and WM, Gln4 of ~4% (MRS), and GABA2 of ~8% (MRS, nonDeu scan), allowing robust detection of Glu4 signal drop by both methods (Fig. 1) and non-significant results for GABA2 in the analysis of individual subject’s data. The exponential fits (M=M0*exp-t/tau+c) of Glu4 time-courses yielded time constants of the decay (tau) with inter-subject coefficients of variation of 25% (MRS, Fig. 2), 50% (GM), and 45 (WM, MRSI, Fig. 3). The time constants of the decay differed significantly between GM and WM and were ~18% lower in the GM. The higher Glu turnover in the GM resulted from voxel-wise fitting of single-subject data obtained with high time-resolution (Fig. 4). The first and last time-point spectra were pooled from all subjects, summed per session, and subtracted (Deu-Glc minus nonDeuGlc session, Fig. 5). The resulting difference spectrum represents the effect of deuterium incorporation into metabolite pathways and allowed quantification of GABA2 with CRLB of 16%.Discussion
The inter-subject variance in Glu rates of ~25-50% is slightly above the gold standard CMRGlc measures with FDG-PET, reported in the range of 19%-29% (mean – median)10 and can be mainly ascribed to high physiological variation in the resting brain metabolism. About 20% difference in the Glu turnover in GM/WM is in line with fluorodeoxyglucose ([18F]FDG) PET studies, which measured ~33% higher oxidative Glc consumption in the GM than WM.11 The voxel-wise fitting with linear regression yielded a contrast between GM/WM slopes, demonstrating feasible non-invasive mapping of Glu turnover without radioactive tracers and PET (Fig. 5). The method allowed to separate Glu from Gln, which is not feasible from deuterium-spectrum even at ultra-high 16.4T fields.12 The basis sets with separated Glu and Gln components on C4 position enabled to extract quantitative information about Glu and Gln turnover similar to technically challenging 13C-MRS. We expect a further boost of quantification of relatively low abundant J-coupled metabolites (i.e., GABA and Gln) by optimizing the sequences for fields above 7T and spectral editing techniques.13,14Conclusions
We introduced a novel, affordable approach for metabolic measures that utilizes widely available 1H MR scanner equipment to indirectly detect deuterated-compounds and can, thus, be easily used in clinical applications. The negligible risk associated with the deuterium administration compared to radioactive FDG predetermines the method for studies with a multi-session design. In contrast to direct deuterium-MRS, 1H-MRS allows quantification of a vastly extended neurochemical profile, including non-deuterated compounds.Acknowledgements
Acknowledgments: Authors thank Drs. Patrick Bolan and Chris Rogers for providing a tool to store and apply 7T B0-shims at 7T MR scanner. The authors acknowledge helpful discussions with Dr. Vladimir Mlynarik. PB was supported by the European Union’s Horizon 2020 research and innovation program under a Marie Skłodowska-Curie grant agreement, no. 846793, and by a NARSAD Young Investigator Grant from the Brain and Behavior Research Foundation, no. 27238. AS has received funding from the European Union’s Horizon 2020 research and innovation program under a Marie Skłodowska-Curie grant agreement, no. 794986. WB and GH acknowledge support by the Austrian Science Fund (FWF) grants P 30701, KLI 718 (WB), and KLI 646 (GH), respectively. TS was supported by FWF grant KLI 782.References
1.De Feyter. Sci Adv 2018; 4: eaat7314.2.Rich.Nat Biomed Eng 2020; 4: 335–342.3.Bednarik.J Cereb Blood Flow Metab 2015; 35: 601–610.4.Bednarik.ISMRM 2020.5.Dou. Magn Reson Mater Physics, Biol Med 2015. doi:10.1007/s10334-014-0469-9.6.Gruetter. Magn Reson Med 2000; 43: 319–323.7.Hingerl. Invest Radiol 2020; 55: 239–248.8.Oz. Magn Reson Med 2011; 65: 901–910.9.Tkac. Magn Reson Med 1999; 41: 649–656.10.Sundar. J Cereb Blood Flow Metab 2019; 39: 1516–1530.11.Yu. J Cereb Blood Flow Metab 2018. doi:10.1177/0271678X17708691.12.Lu.J Cereb Blood Flow Metab 2017; 37: 3518–3530.13.Moser.Neuroimage 2019; 184: 475–489.14.Magnusson. Magn Reson Med 2019. doi:10.1002/mrm.27450.Figures