0628
Real-time observation of postprandial hepatic glucose metabolism with interleaved 2H Metabolic Imaging and 13C-MRS at 7 T1Magnetic Resonance Methodology, Institute of Diagnostic and Interventional Neuroradiology, University of Bern, Bern, Switzerland, 2Translational Imaging Center, sitem-insel, Bern, Switzerland, 3Department of Diabetes, Endocrinology, Nutritional Medicine and Metabolism UDEM, Insel Hospital, University Hospital Bern, Bern, Switzerland, 4Department of Information Engineering (DEI), University of Padova, Padova, Italy
Synopsis
The liver takes a central role in the regulation of glucose homeostasis by storing glucose in the fed state and releasing it during food abstinence. As a consequence, the liver is critically involved in glucose homeostasis disorders. We propose a novel non-invasive approach combining Deuterium Metabolic Imaging (DMI) with 13C-MRS at 7 T to dynamically map hepatic glucose metabolism. Preliminary results support technical feasibility and provide first insights into distinct hepatic glucose profiles in patients with dysregulated glucose homeostasis. The proposed approach may open new avenues for a better understanding of pathophysiology of glucose dysregulation and development of targeted treatments.
Introduction
The liver plays a vital role in whole-body glucose (Glc) homeostasis. Hepatic Glc uptake and consequent conversion into glycogen is an important determinant of postprandial Glc control1. These processes are crucially influenced by Glc and insulin exposure of the liver. Hence, altered Glc absorption kinetics and hepatic insulin exposure, which occurs in patients with diabetes or who underwent bariatric surgery, are therefore likely to impact hepatic Glc metabolism2,3. Thus, deciphering metabolic processes in the liver may offer new avenues towards novel diagnostic and therapeutic targets. For decades, 18FDG-PET has been used to explore tissue-specific Glc metabolism4-6. However, the method precludes insights into metabolic processes beyond glucose uptake and its use for clinical research is limited by risks related to radiation exposure.Deuterium metabolic imaging (DMI)7,8 and 13C magnetic resonance spectroscopy (MRS)9 are attractive non-invasive MR techniques for dynamic in vivo mapping of deuterated Glc and natural-abundance glycogen levels in the liver or skeletal muscle. DMI can be performed with oral intake of [6,6’-2H2]-Glc, providing greater convenience and more physiological conditions. The aim of our project is to assess the trajectory of intrahepatic Glc and glycogen in patient populations with altered insulin and glucose kinetics compared to matched healthy controls. Here, we report on feasibility and initial results.
Methods
Cross-sectional study design with three groups, each eventually consisting of 10 participants (healthy adults (group-I), adults with type-1 diabetes (T1D, group-II) and adults after gastric bypass surgery (RYGB, group-III)). Here we report initial data for n=5 Group-I, n=2 Group-II, n=2 Group-III participants. For study procedures see Fig. 1. Blood was assayed for plasma concentrations of (enriched) glucose, insulin, glucagon and C-peptide to build a kinetic model. T1D received subcutaneous (s.c.) insulin to cover the Glc load and insulin requirements during the scanning period. The MR protocol considers different physiological Glc absorption and glycogen generation kinetics; hence, 2H-MRSI scans are more frequent until T50 and afterwards are equally interleaved with 13C-MRS. MR was performed at 7T (Terra, Siemens) using a triple-tuned 1H/2H/13C surface coil (Rapid, Biomedical GmbH). MR parameters were chosen as trade-off between signal-to-noise ratio optimum and time/spatial resolution and are described in detail in another contribution. In short: DMI: conventional 3D-MRSI (TR 500 ms, nominal resolution of 18.3x18.3x27.5 mm3, 4:08 min acquisition time). 13C-MRS: pulse-and-acquire sequence (TR 600 ms, Nuclear-Overhauser-enhancement, acquisition time 5:08 min). 22 time points for 2H-MRSI and 15 for 13C-MRS.Results and Discussion
Participants' characteristics (age, BMI, %female) were (34 ±12.7, 25.1 ±2.2, 67%) for Group-1, (44 ±15.6, 26.9 ±3.5, 50%) for Group-II and (43 ±4.9, 34 ±11.1, 100%) for Group-III.Fig. 2 illustrates data quality and spectral changes for DMI for three representative subjects as a function of time relative to Glc intake.
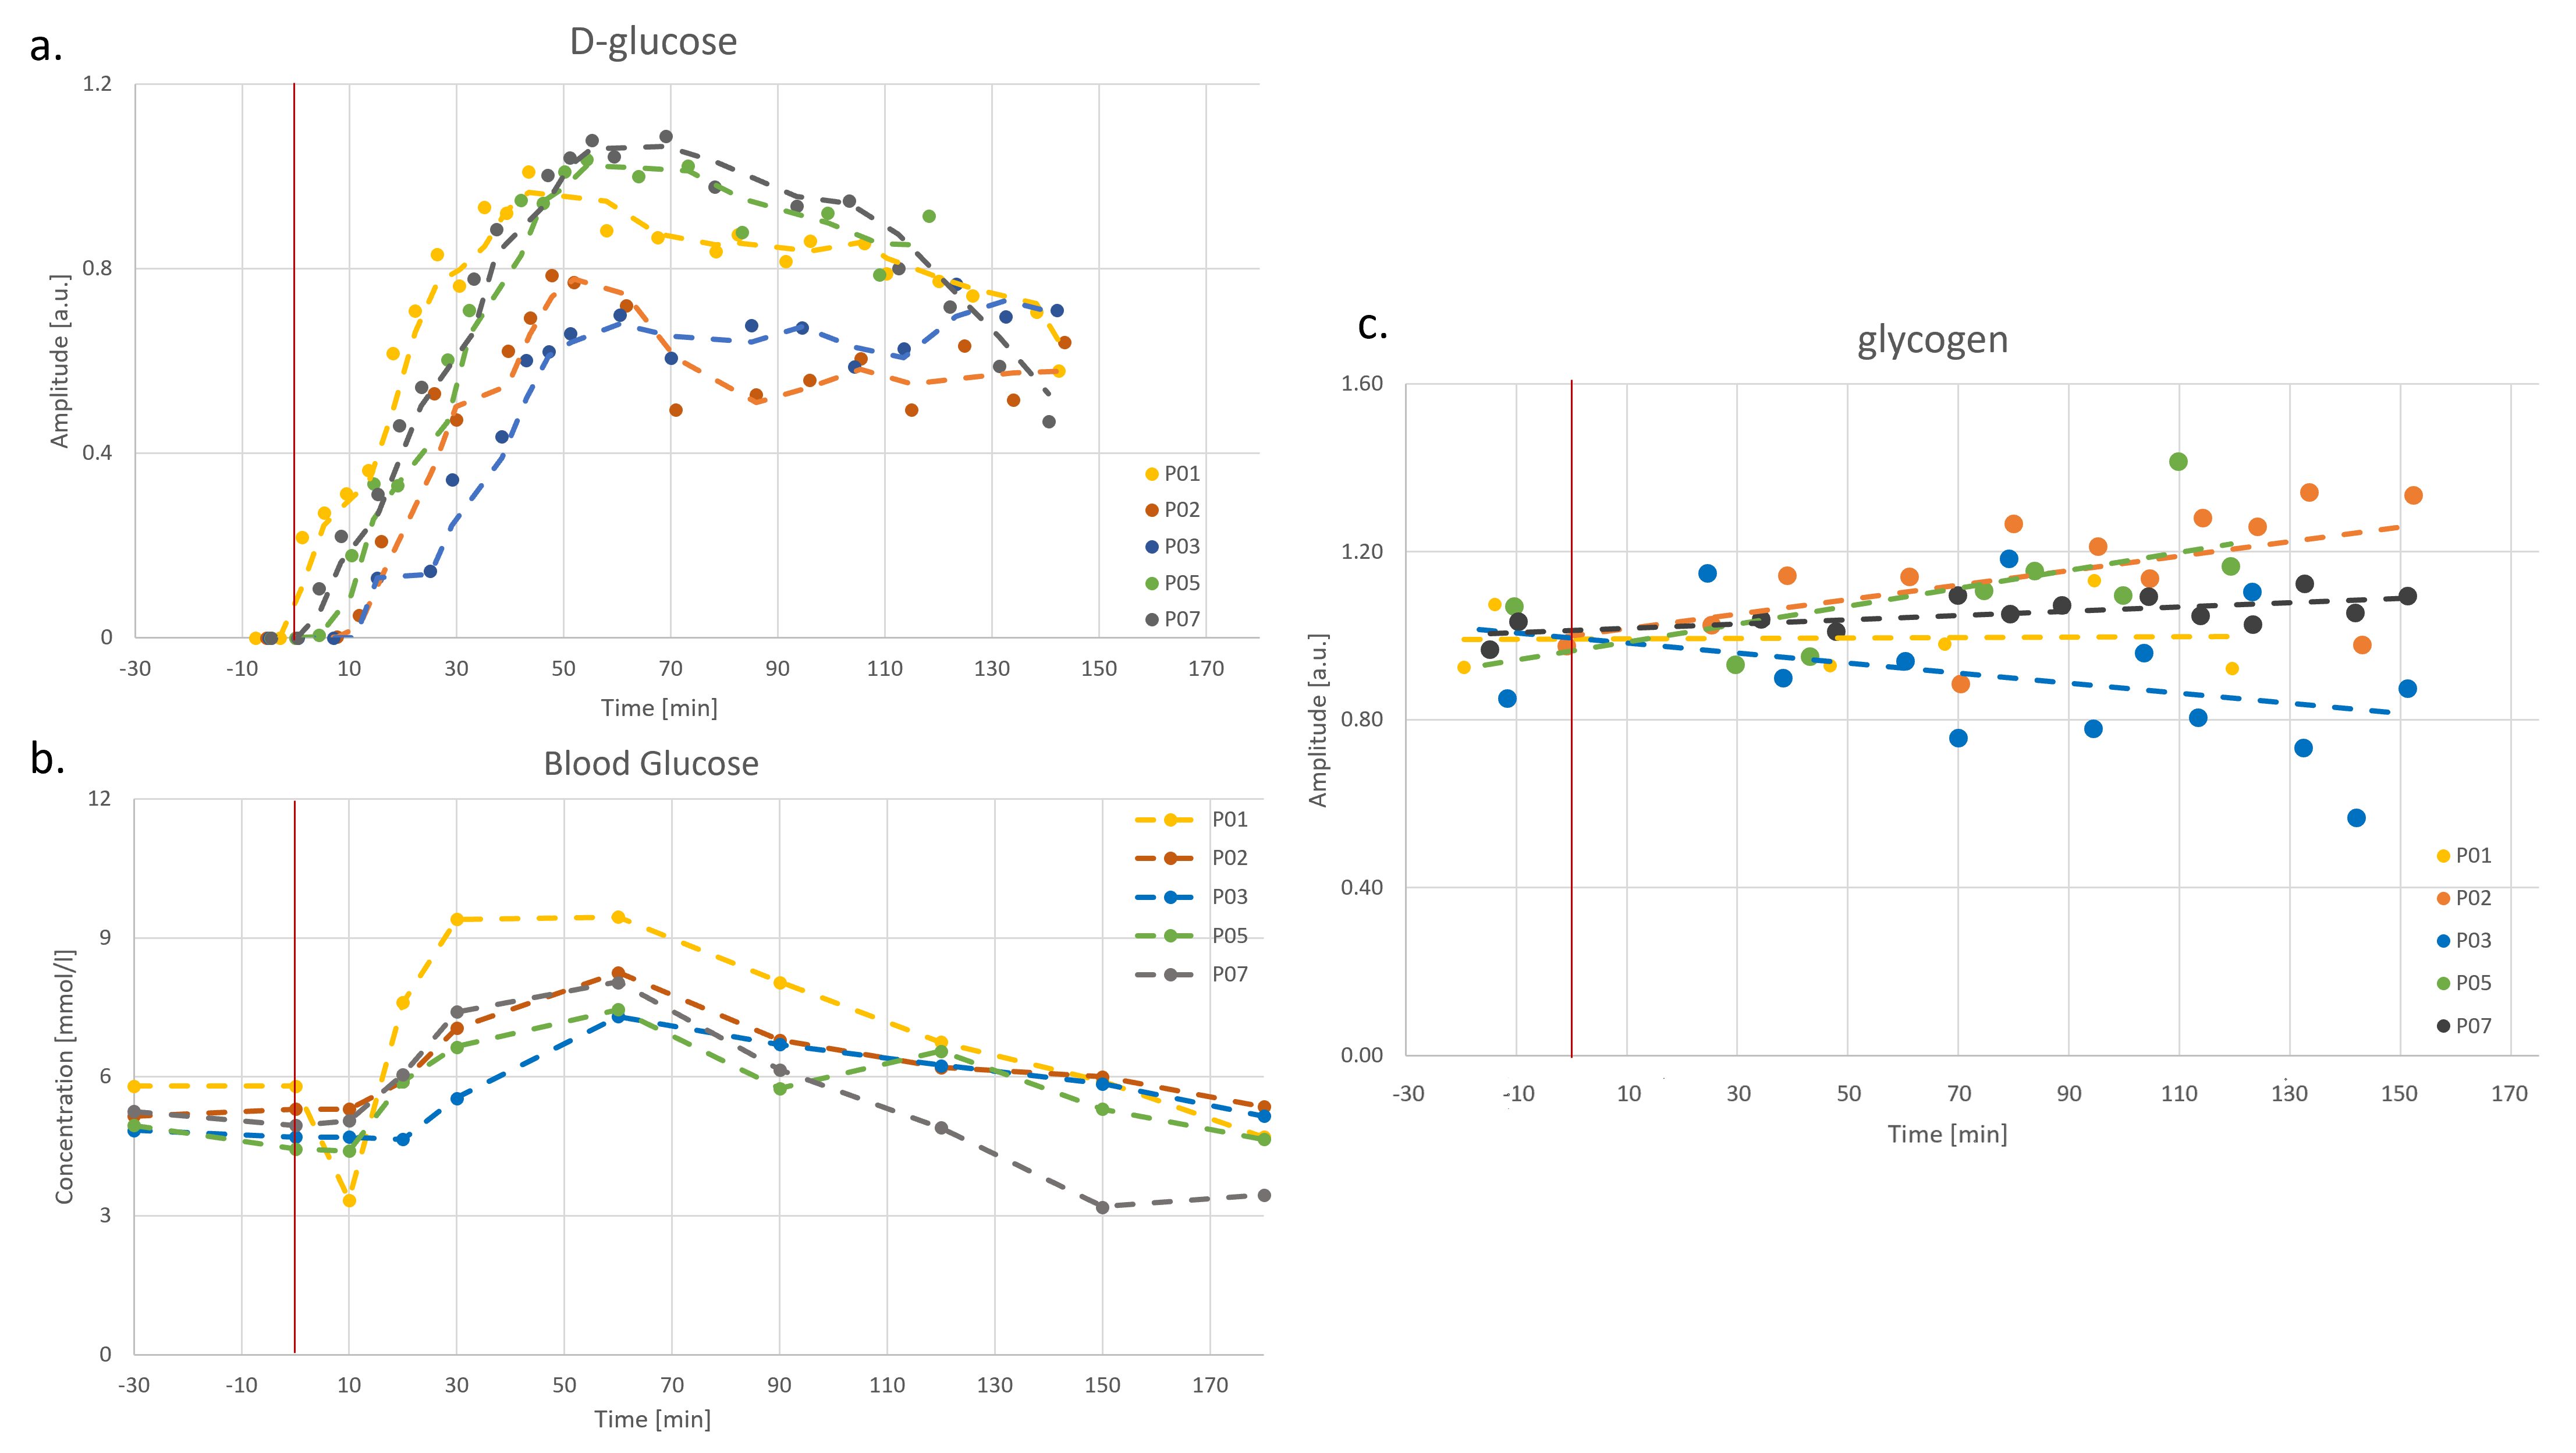
Fig. 3 shows the quantified evolution of D-glc with time both in the liver from 2H-MRSI (quantified with the initial natural-abundance water signal) and in peripheral blood, as well as the quantified hepatic glycogen signal (a.u.) for 5 healthy subjects. The D-Glc signal is absent before [6,6’-2H2]-Glc intake (T0), appears soon after T0 and consistently increases to its maximum around T45-T65. Later, D-Glc decreases towards baseline but remains well detectable until T150. Blood Glc also increases after the load and remains elevated until about T120. Glc entering the liver is either metabolized, released or stored in form of glycogen, measured as overall content (unrelated to deuteration). Its signal appears to increase linearly by ~10-15% for most subjects.
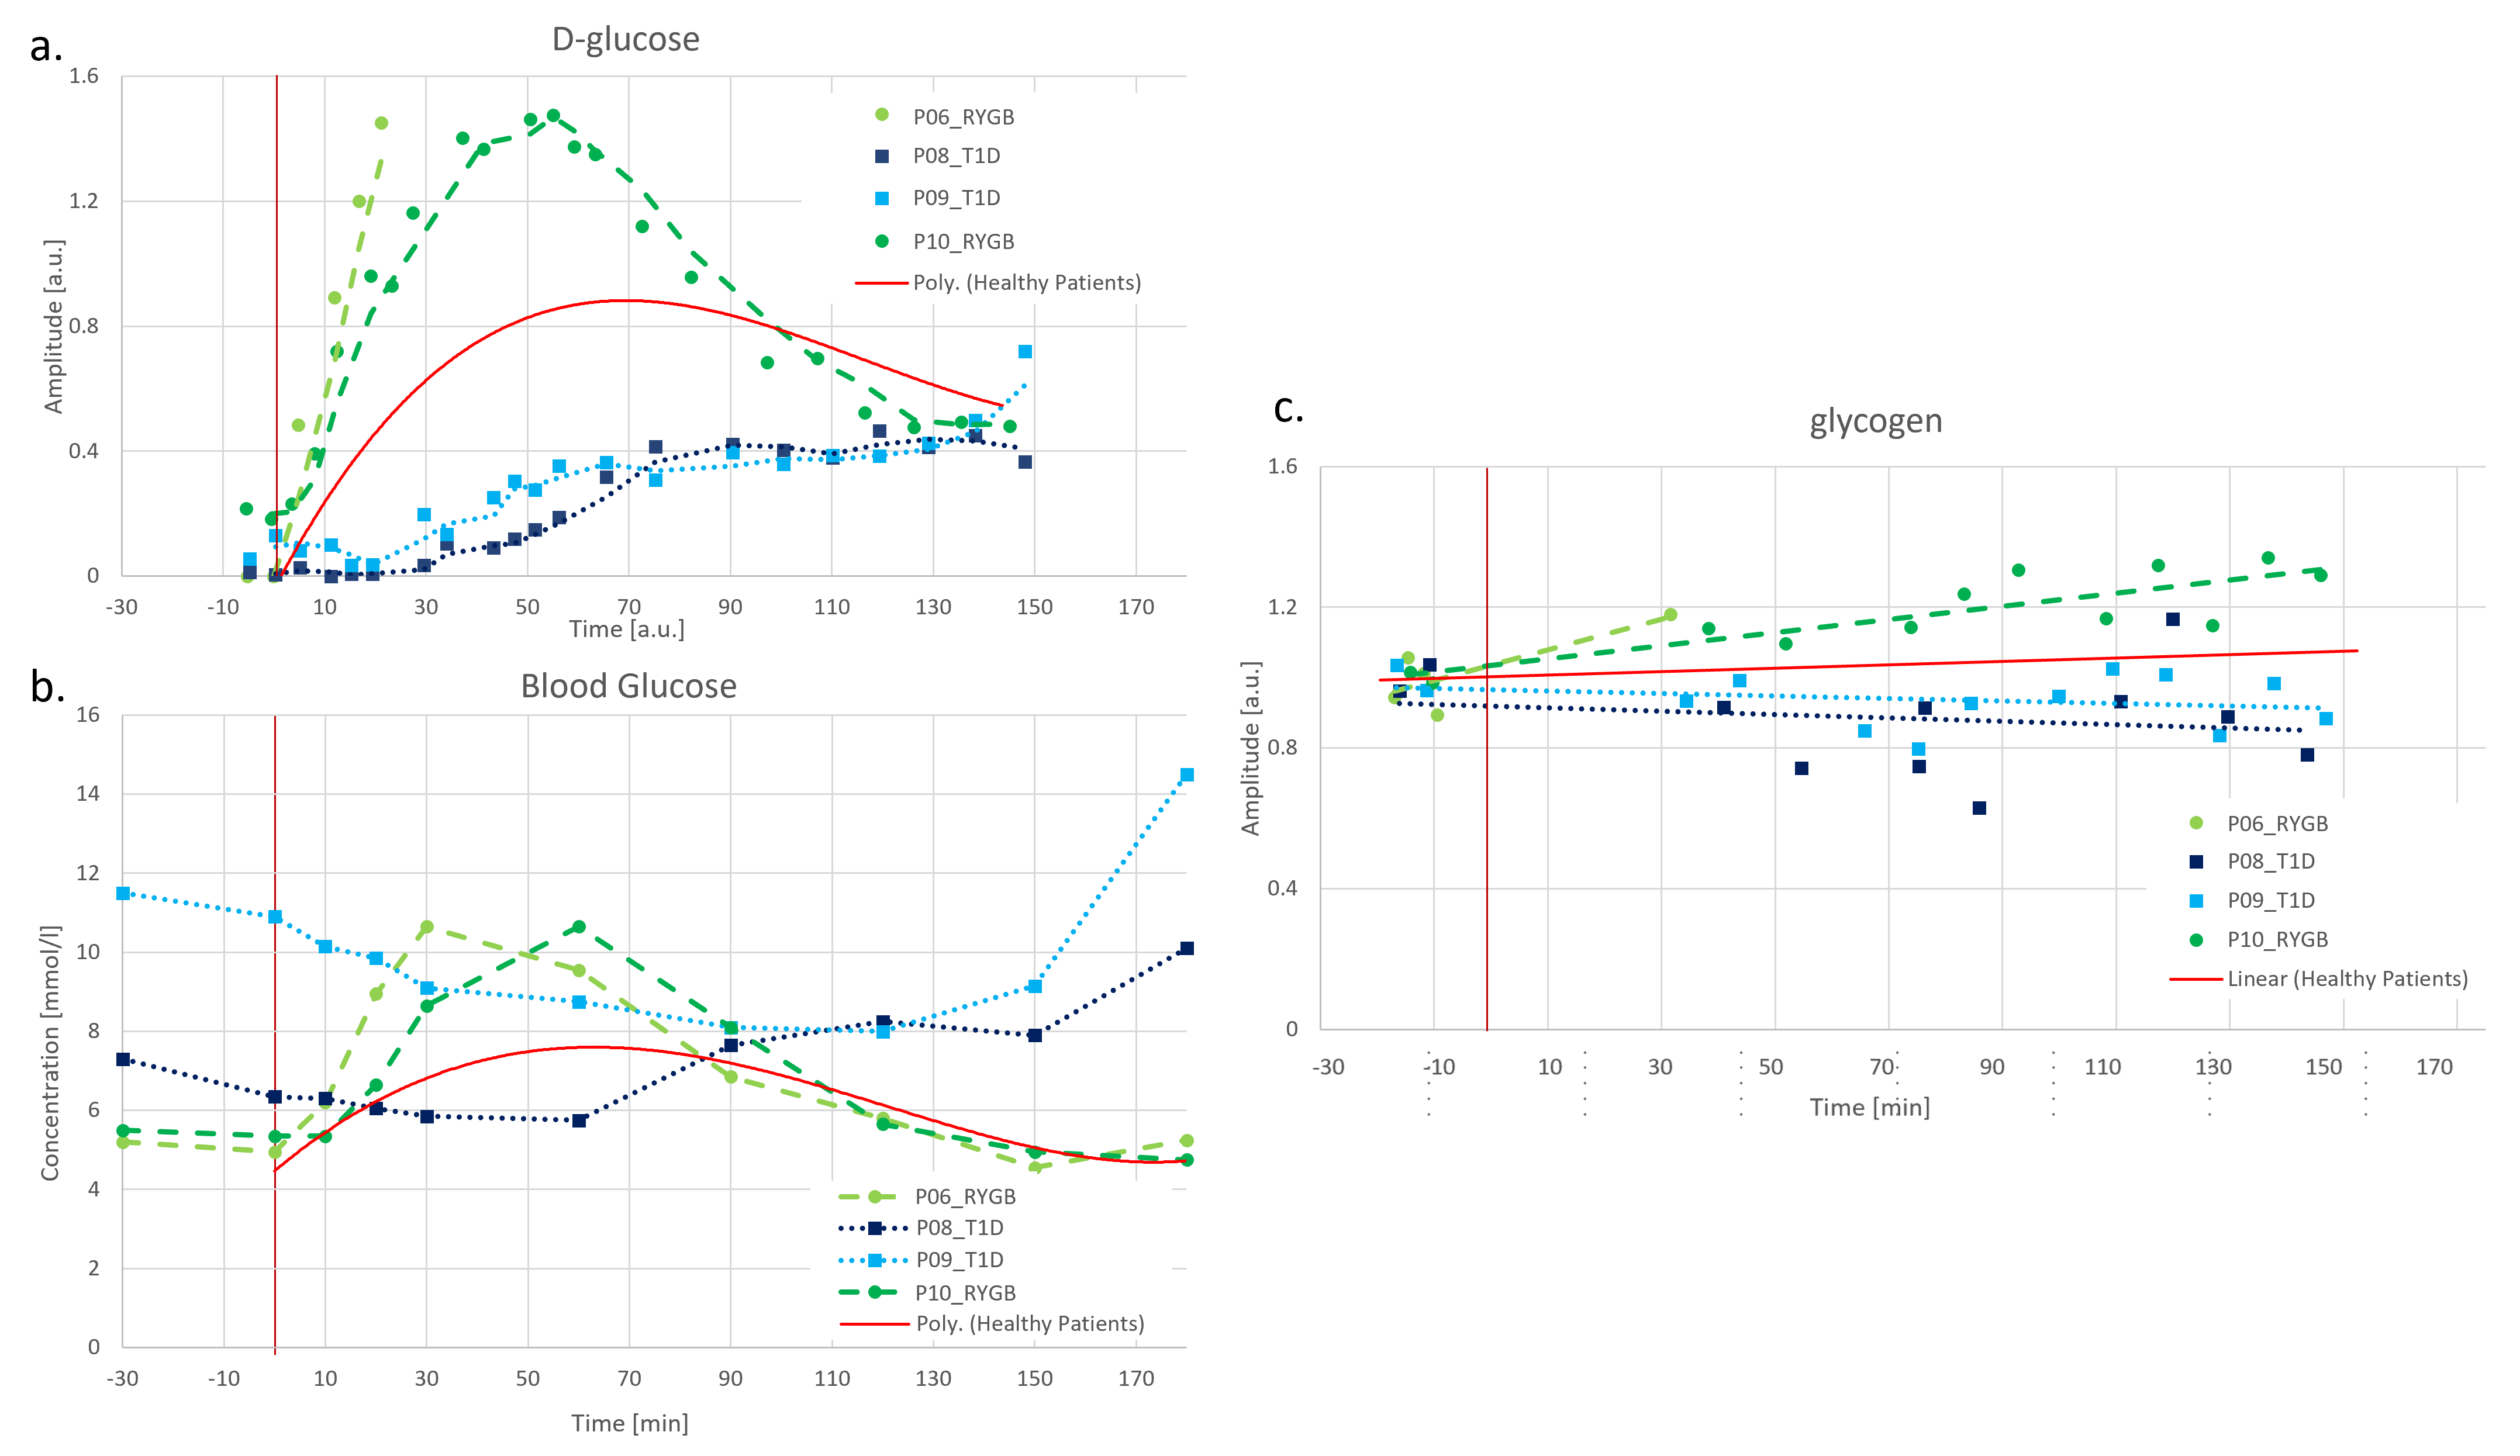
Fig. 4 includes individual data for two participants each with T1D and RYGB contrasted to the average signal of group-I, modelled as a polynomial function. Clearly, it is too early for conclusive observations, but the metabolic trends confirm initial hypotheses. Compared to healthy subjects, T1D patients appear to have a slower hepatic D-Glc increase and reach a plateau only around T70-T100. Hepatic D-Glc never reaches the level of healthy controls and glycogen levels seem to rather decrease over time. This may suggest that peripherally delivered s.c. insulin cannot replicate physiologic postprandial hepatic insulin exposure, thereby compromising early postprandial hepatic Glc uptake. The data for both RYBG patients show a rapid increase in D-Glc, in line with their well-established accelerated intestinal Glc absorption. For the one with complete data (one had to stop the scan for nausea) the peak level was higher and reached earlier than for Group-I. Also glycogen increased faster in line with the hypothesis that most of the accumulated intestinal Glc is shifted into glycogen. This may indicate that the re-arrangement of the gastrointestinal tract substantially alters the portal milieu by accelerated Glc fluxes and consequently heightened early postprandial hepatic insulin exposure.
Conclusions
Intake of 60g [6,6’-2H2]-Glc resulted in gradual increase of intrahepatic Glc, peaking at T45-T65. This was paralleled by an 10-15% increment in hepatic glycogen. In diseases with dysregulated glucose-insulin homeostasis, liver glucose and glycogen signals portray the respective altered Glc and insulin exposure of the liver. Compared to healthy controls, RYGB subjects showed higher hepatic Glc and glycogen signals, in line with the left shifted blood Glc and insulin profile. Conversely, subjects with T1D applying s.c. insulin, hepatic Glc showed a flattened profile reflecting attenuated hepatic Glc uptake as a consequence of lower hepatic insulin exposure.Acknowledgements
This is project is supported by the Swiss National Science Foundation (PCEGP3_186978) and Diabetes Center Bern. We further acknowledge the support received from the study nurse team (Valérie Brägger, Joana Filipa Rodrigues Cunha Freitas, Sandra Tenisch), Andreas Melmer and Laura Goetschi from the Department of Diabetes, Endocrinology, Nutritional Medicine and Metabolism, Inselspital, Bern University Hospital. Simone Poli and Ahmed Emara have equal contribution to this project.References
[1] Petersen MC, Vatner DF, Shulman GI. Regulation of hepatic glucose metabolism in health and disease. Nat Rev Endocrinol. 2017; 13(10):572-587.
[2] Pagliassotti MJ, Holste LC, Moore MC, Neal DW, Cherrington AD. Comparison of the time courses of insulin and the portal signal on hepatic glucose and glycogen metabolism in the conscious dog. J Clin Invest. 1996; 97(1):81-91.
[3] Edgerton DS, Scott M, Farmer B, Williams PE, Madsen P, Kjeldsen T, Brand CL, Fledelius C, Nishimura E, Cherrington AD. Targeting insulin to the liver corrects defects in glucose metabolism caused by peripheral insulin delivery. JCI Insight. 2019; 5(7):e126974.
[4] Patlak CS, Blasberg RG, Fenstermacher JD. Graphical evaluation of blood-to-brain transfer constants from multiple-time uptake data. J Cereb Blood Flow Metab. 1983; 3(1):1-7.
[5] Iozzo P, Geisler F, Oikonen V, et al. Insulin stimulates liver glucose uptake in humans: an 18F-FDG PET Study. J Nucl Med. 2003;44(5):682-689.
[6] Verloh N, Einspieler I, Utpatel K, et al. In vivo confirmation of altered hepatic glucose metabolism in patients with liver fibrosis/cirrhosis by. EJNMMI Res. 2018; 8(1):98.
[7] Lu M, Zhu XH, Zhang Y, Mateescu G, Chen W. Quantitative assessment of brain glucose metabolic rates using in vivo deuterium magnetic resonance spectroscopy. J Cereb Blood Flow Metab. 2017; 37(11):3518-3530.
[8] De Feyter HM, Behar KL, Corbin ZA, et al. Deuterium metabolic imaging (DMI) for MRI-based 3D mapping of metabolism in vivo. Sci Adv. 2018; 4(8):eaat7314.
[9] Valette J, Tiret B, Boumezbeur F. Experimental strategies for in vivo13C NMR spectroscopy. Anal Biochem. 2017; 529:216-228.
[10] Harris JA, Benedict FG. A Biometric Study of Human Basal Metabolism. Proc Natl Acad Sci U S A. 1918; 4(12):370-373.
Figures
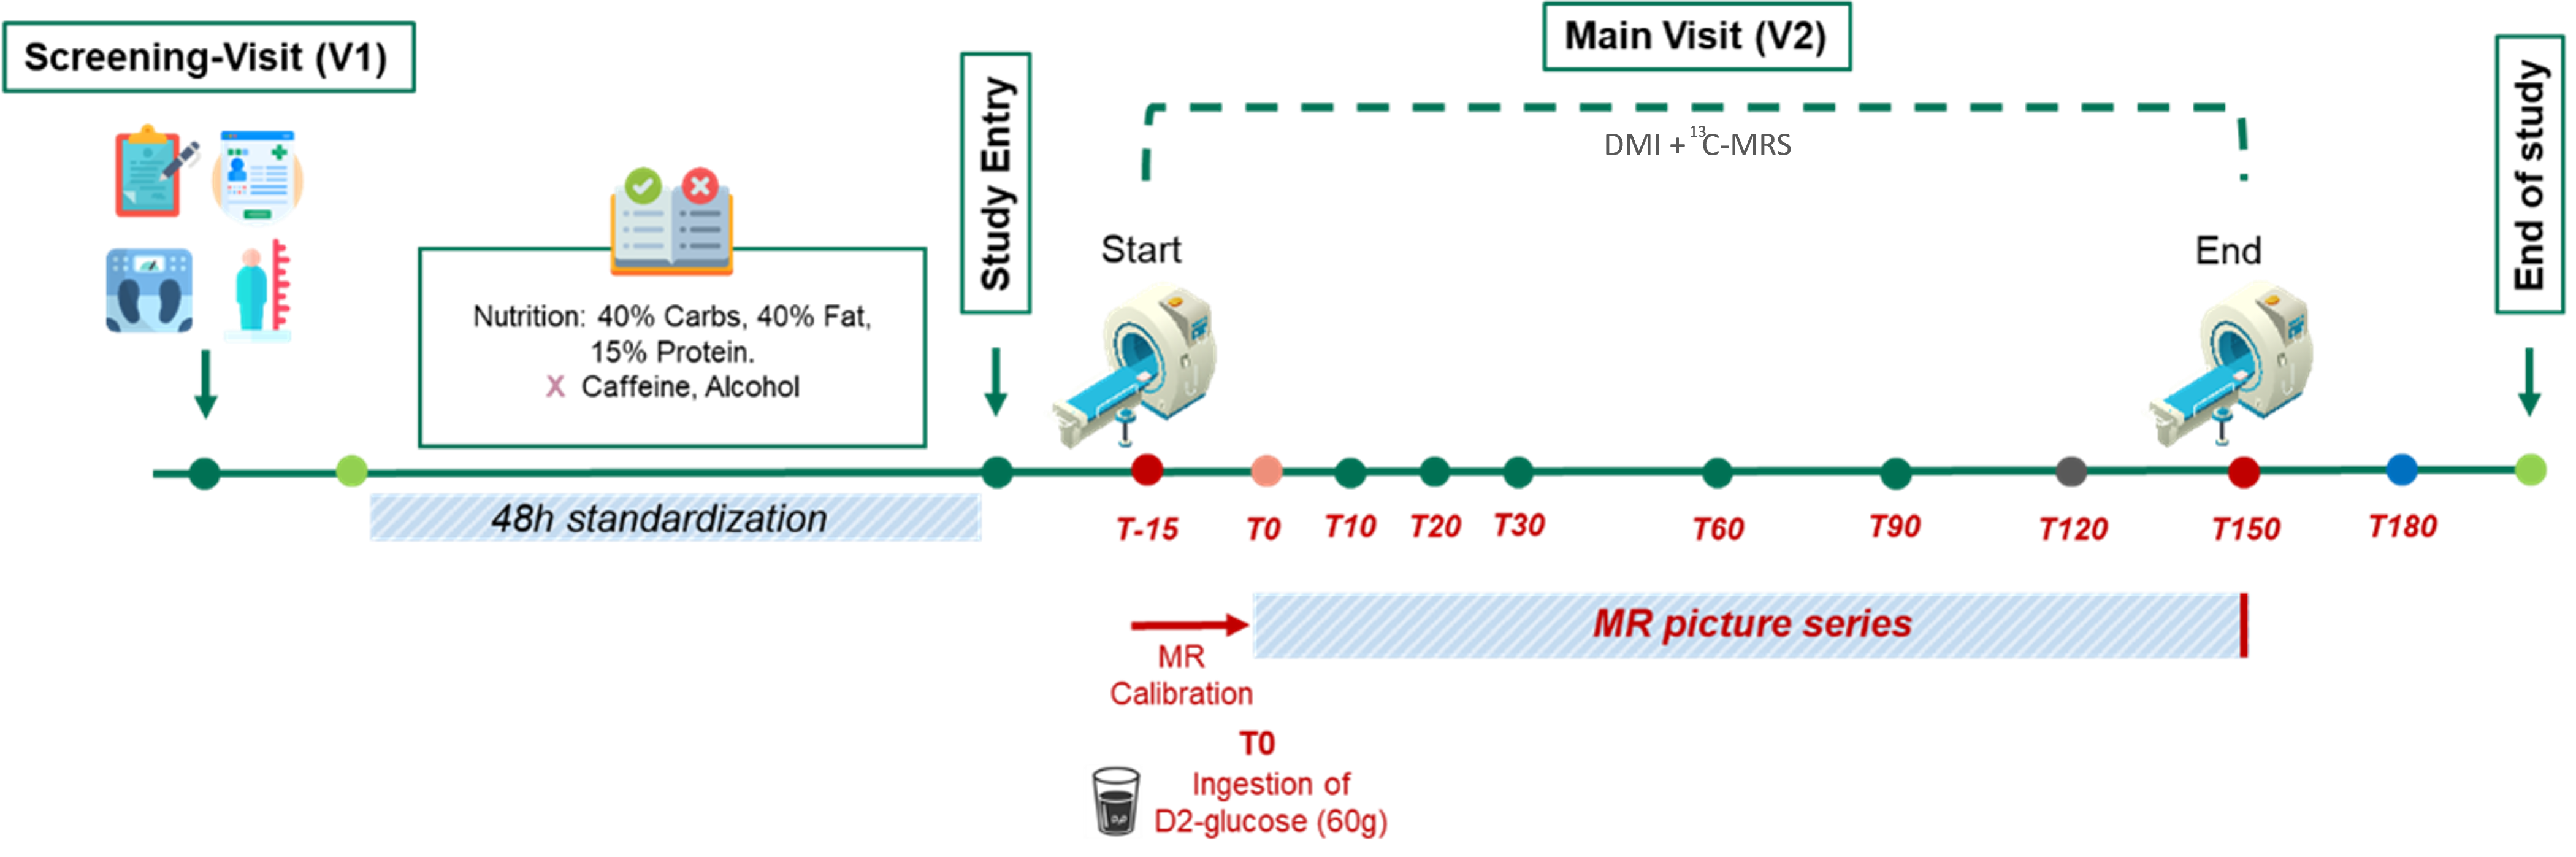
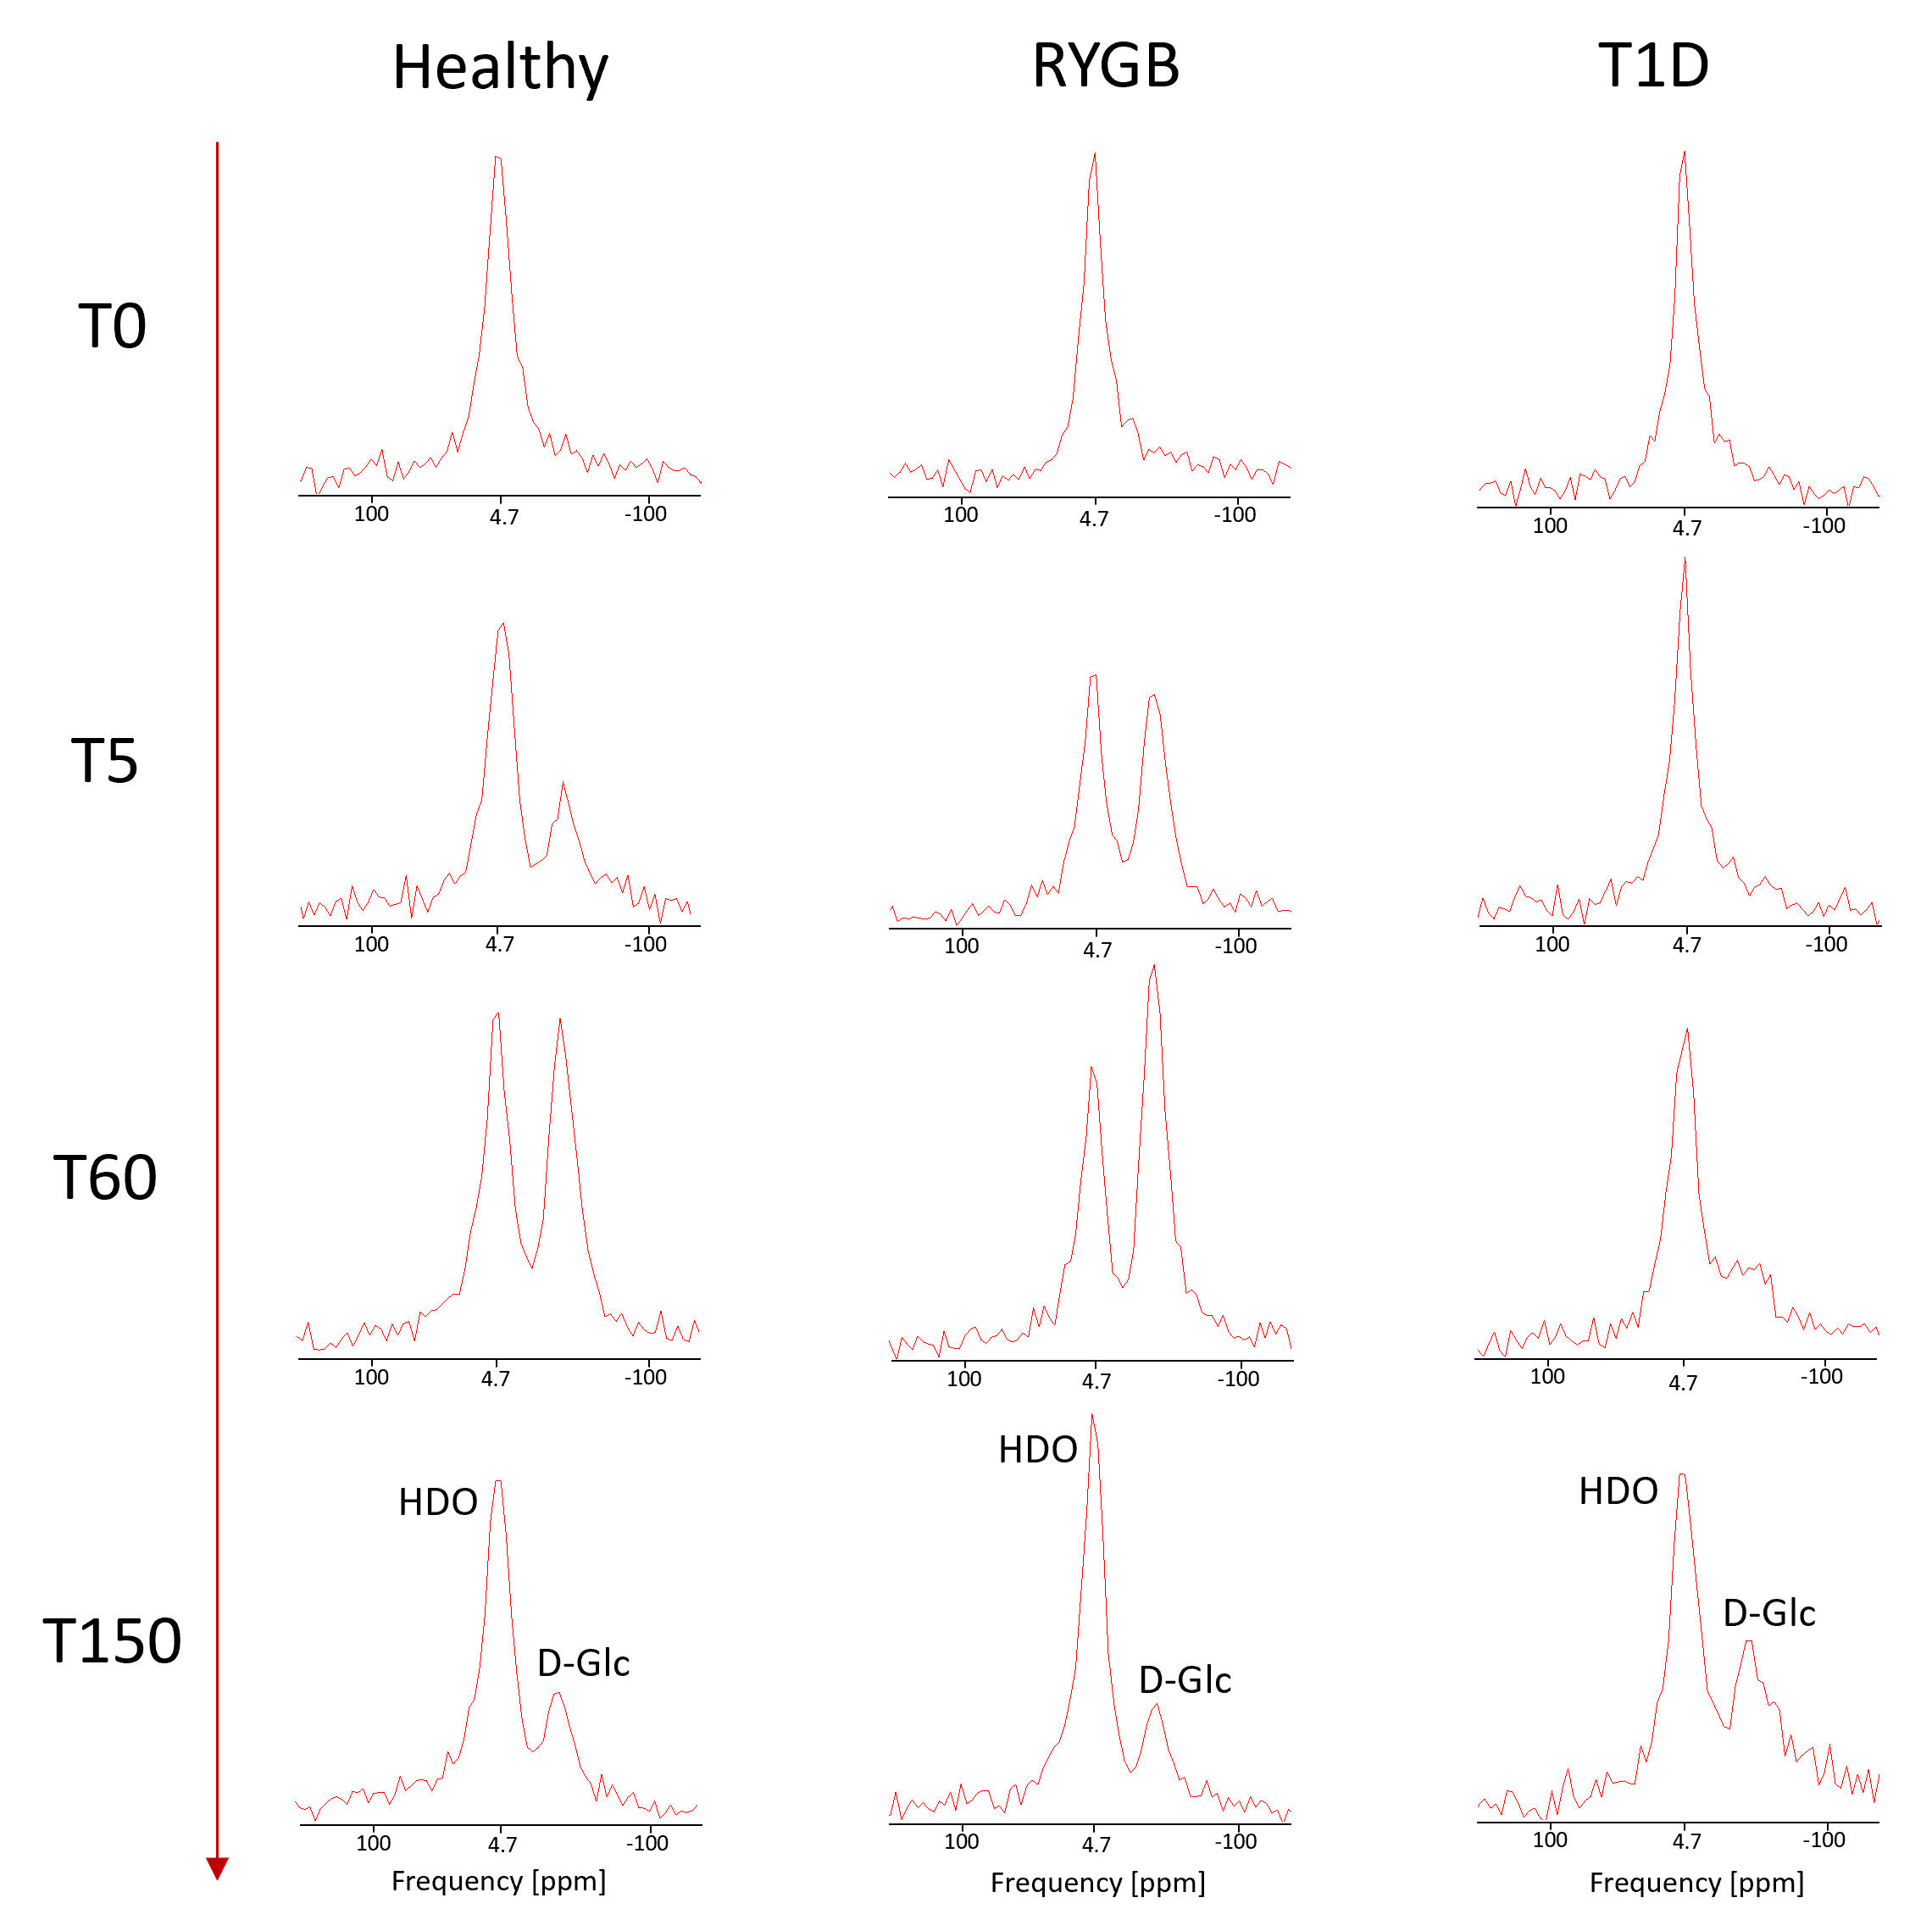
Fig. 2. 2H-MRSI spectra presented without apodization from DMI datasets of one subject from each population (healthy, RYGB, T1D), and time points [T0, T5, T60, T150]. Each spectrum represents an average of 6 central MRSI voxels in the liver, where the spatial matrix had been zero-filled to 16x16x8 yielding nominal volumes of 13.7x13.7x18.3 mm3 per single voxel.