0626
Parallel Transmit T2 Preparation for 3D T2 Mapping at Ultra-High Field1Advanced Clinical Imaging Technology, Siemens Healthcare AG, Bern, Switzerland, 2Magnetic Resonance Methodology, Institute of Diagnostic and Interventional Neuroradiology, University of Bern, Bern, Switzerland, 3Translational Imaging Center, sitem-insel, Bern, Switzerland, 4Siemens Healthcare GmbH, Erlangen, Germany, 5Siemens AG, Munich, Germany, 6Advanced Clinical Imaging Technology, Siemens Healthcare AG, Lausanne, Switzerland, 7Department of Radiology, University Hospital (CHUV) and University of Lausanne (UNIL), Lausanne, Switzerland, 8LTS5, École Polytechnique Fédérale de Lausanne, Lausanne, Switzerland
Synopsis
T2 relaxometry at ultra-high field has the potential to become an important quantitative MRI biomarker thanks to its sensitivity to pathology. However, acquiring high-resolution isotropic T2 maps is challenging due to signal-to-noise and specific absorption rate constraints. We present a T2-mapping method for ultra-high-field MRI based on a parallel transmit T2-preparation (T2p) module integrated in a compressed sensing accelerated segmented 3D FLASH sequence. The proposed parallel transmit T2p module is investigated in phantom and in vivo experiments and compared to an adiabatic T2p module. Preliminary tests show feasibility for sub-millimeter T2 relaxometry at 7 T.
INTRODUCTION
T2-weighted imaging and relaxometry play an important role in the study of brain pathologies [1,2]. However, conventional spin-echo-based sequences for T2 mapping are limited to 2D or 3D-slab imaging with anisotropic resolutions due to specific-absorption-rate (SAR) and acquisition time limitations. T2 preparation (T2p) approaches [3] combined with fast sequences [4] allow for isotropic high-resolution 3D T2 mapping of the entire brain [5]. These techniques are especially advantageous at ultra-high field where they can benefit from an improved signal-to-noise ratio. However, B1 inhomogeneity remains a challenge for the large flip-angle pulses of T2p and conventional adiabatic pulses may still be limited by SAR. Here, we investigate the use of k-t point pulses [6] for T2 preparation of an accelerated 3D FLASH sequence for T2 mapping of the entire brain at 7T with sub-millimeter resolution. We report preliminary in vitro and in vivo tests of the proposed method in comparison to an adiabatic T2p [7] module.METHODS
IRB-approved experiments were performed at 7T (MAGNETOM Terra, Siemens Healthcare, Erlangen, Germany) using an 8-channel TX/32-channel RX head coil (Nova Medical, Wilmington, MA). In the first experiment a multi-purpose phantom (five compartments with different concentrations of MnCl2·4H2O, Siemens) was scanned and in the second, one healthy volunteer (female, 21 yo) was scanned for proof of concept.Images were acquired with a segmented 3D FLASH [4] prototype sequence employing a Cartesian spiral-phyllotaxis sampling pattern [8] with 6.9-fold acceleration. After T2 preparation, readouts of the FLASH block followed a center-out radial-like trajectory (Figure 1A-B). Two T2p modules were tested. An adiabatic T2p was obtained by modifying a B1-Insensitive Rotation (BIR4) pulse with symmetric delays between the pulse segments [9] (Figure 1C). A parallel transmit (PTX) T2p module was designed with three k-t-point pulses, independently optimized for the tip-down (90° excitation, seven sub-pulses), refocusing (180° plane rotation, 90° phase, eight sub-pulses), and tip-up (90° plane rotation, 180° phase, seven sub-pulses) (Figure 1D). An interior-point optimizer was used to solve the complex least square problem to minimize the deviation between the simulated and the target flip angles, with SAR (surrogate limit of 10 J/kg) and hardware (max RF amplitude=150 V) constraints [10, 11]. PTX pulses were designed off-line in MATLAB (The MathWorks Inc., Natick, MA) before the scan and after the acquisition of B0 and B1+ maps that were used as input.
The tip-down/tip-up inter-pulse duration (TEp) was changed to obtain different T2 weightings. Three volumes were acquired consecutively with TEp=25, 62, and 100 ms with each T2p module. Other protocol parameters for both T2p sequences were: 7° FLASH RF-excitation angle, 158 readouts/TR, FLASH-TR/TE=6.5/1.95 ms, FOV=256x192x256 mm3, resolution=0.8x0.8x0.8 mm3, TR=6 s, acquisition time=5:57 min/volume.
Images were reconstructed on the scanner with a prototype compressed sensing algorithm [12]. T2 maps were generated offline (MATLAB) using a log-linear voxel-wise fit of $$$M_{TE_{p}}=M_{0}exp(-TE_{p}/T_{2})$$$, and after rigid registration [13] to account for motion between the volumes.
For the phantom experiment, a 2D single-echo spin-echo sequence with ten incremental TEs (TE=10 to 100 ms, TR=3 s, voxel size=1.5x1.5x4 mm3) was used as reference. Median values were computed from manually drawn ROIs in the five compartments and compared to those of the T2p sequences in a scatter plot.
For the volunteer experiment, an MPRAGE [14] sequence was acquired to segment nine bilateral volumes-of-interest (VOI) [15]. Median T2 values were extracted from each VOI in the T2-map and compared between the two T2p sequences.
RESULTS AND DISCUSSION
PTX-T2p RF and gradient pulses were computed in ~10 s/pulse and resulted in a duration of 3.2/5/5 ms for tip-down/refocusing/tip-up pulses (Figure 1E-G). The T2-prepared scans were reconstructed in ~5 min/volume.Reference spin-echo T2 values in compartments #1 to #5 were 104/52/27/14/10 ms (Figure 2A). Compartments #4 and #5 could not be estimated with the T2-prepared sequences using minimum TEp=25 ms allowed by BIR4-T2p. T2 values of compartments #1 to #3 resulted in 107/101/53 ms for BIR4-T2p (Figure 2B) and 97/40/32 for PTX-T2p (Figure 2C). Best agreement with the reference was found for PTX T2p (Figure 2D-E). Note PTX-T2p allowed for shorter TEp=17 ms but 25 ms was used for comparison.
In vivo, both T2p methods showed good image quality and contrast through different T2 weightings (Figure 3). PTX-T2p showed qualitatively higher signal than BIR4 at same TEp, despite signal dropouts in the cerebellum (arrows, Figure 3).
Orthogonal views of the maps showed a more homogenous T2 distribution for PTX-T2p and better depiction of the anatomy (Figure 4, arrows), possibly due to a better RF power distribution throughout the brain. Accordingly, the VOI analysis showed a trend for higher values for BIR4-T2p in white and gray matter with larger variation in gray matter (Figure 5).
CONCLUSION
High-resolution whole-brain T2 mapping is feasible at 7T with the proposed method. In vitro, PTX-T2p showed good agreement with reference T2 values. In vivo, PTX-T2p T2 maps showed better homogeneity in comparison to an adiabatic T2p. Despite the need of field maps and ad-hoc pulse optimization, PTX offers the potential for i) more homogeneous magnetization preparation, ii) shorter TEp, and iii) lower pulse power resulting in shorter TRs and less magnetization transfer effects. These advantages may enable more accurate and faster T2 mapping.Acknowledgements
The authors would like to thank Dr. Ali Aghaeifar, Siemens Healthcare Ltd., United Kingdom, for helping with B0 shimming and Dr. Raphaël Tomi-Tricot, Siemens Healthcare Ltd., United Kingdom, for helping with B1+ mapping.References
1. van der Kolk AG, et al. Intracranial Vessel Wall Imaging at 7.0-T MRI. Stroke 2011;42:2478–2484.2. Saranathan M, et al. Optimization of Magnetization-Prepared 3-Dimensional Fluid Attenuated Inversion Recovery Imaging for Lesion Detection at 7 T. Invest Radiol 2014;49:290–298.
3. Brittain JH, Hu BS, Wright GA, Meyer CH, Macovski A, Nishimura DG. Coronary angiography with magnetization-prepared T2 contrast. Magn Reson Med 1995;33(5):689-696.
4. Haase A, Frahm J, Matthaei D, Hänicke W, Merboldt K‐D. FLASH imaging: rapid NMR imaging using low flip angle pulses. J Magn Reson 1986; 67: 258–266.
5. Mussard, E. P. C., Hilbert, T., Forman, C., Meuli, R., Thiran, J. P., & Kober, T. (2017). High-resolution 3D T2 mapping of the Brain Using T2-prepared Cartesian Spiral Phyllotaxis FLASH and Compressed Sensing. In Intl. Soc. Mag. Reson. Med (Vol. 25).
6. Cloos MA, Boulant N, Luong M, et al. kT -points: short three-dimensional tailored RF pulses for flip-angle homogenization over an extended volume. Magn Reson Med. 2012;67:72-80.
7. Bonanno G, et al. (2021) High-resolution T2 maps of the whole brain at 7 Tesla: a proof-of-concept study using adiabatic T2-prepared FLASH and compressed sensing. Proc. Of Intl. Soc. Mag. Reson. Med. (Vol. 30) P3047.
8. Forman C, et al. High-resolution 3D whole-heart coronary MRA: a study on the combination of data acquisition in multiple breath-holds and 1D residual respiratory motion compensation. Magn Reson Mater Phy 2014;27:435-443.
9. Nezafat R at al., Spectrally Selective B1-Insensitive T2 MagnetizationPreparation Sequence Magnetic Resonance in Medicine 61:1326–1335 (2009).
10. K. Majewski, D. Ritter. First and second order derivatives for optimizing parallel RF excitation waveforms. Journal of Magnetic Resonance 258 (2015) 65–80.
11. Kurt Majewski. Simultaneous optimization of radio frequency and gradient waveforms with exact Hessians and slew rate constraints applied to kT-points excitation. Journal of Magnetic Resonance. Volume 326, 2021, 106941.
12. Wetzl J, Forman C, Wintersperger BJ, et al. High‐resolution dynamic CE‐MRA of the thorax enabled by iterative TWIST reconstruction. Magn Reson Med. 2017;77:833–840.
13. S. Klein, M. Staring, K. Murphy, M.A. Viergever, J.P.W. Pluim, "elastix: a toolbox for intensity based medical image registration," IEEE Transactions on Medical Imaging (2010), vol. 29, no. 1, pp. 196 - 205.
14. Mugler JP 3rd, Brookeman JR. Three-dimensional magnetization-prepared rapid gradient-echo imaging (3D MP RAGE). Magn Reson Med. 1990 Jul;15(1):152-7. doi: 10.1002/mrm.1910150117. PMID: 2374495.
15. Schmitter, Daniel, et al. "An evaluation of volume-based morphometry for prediction of mild cognitive impairment and Alzheimer's disease." NeuroImage: Clinical 7 (2015): 7-17.
Figures
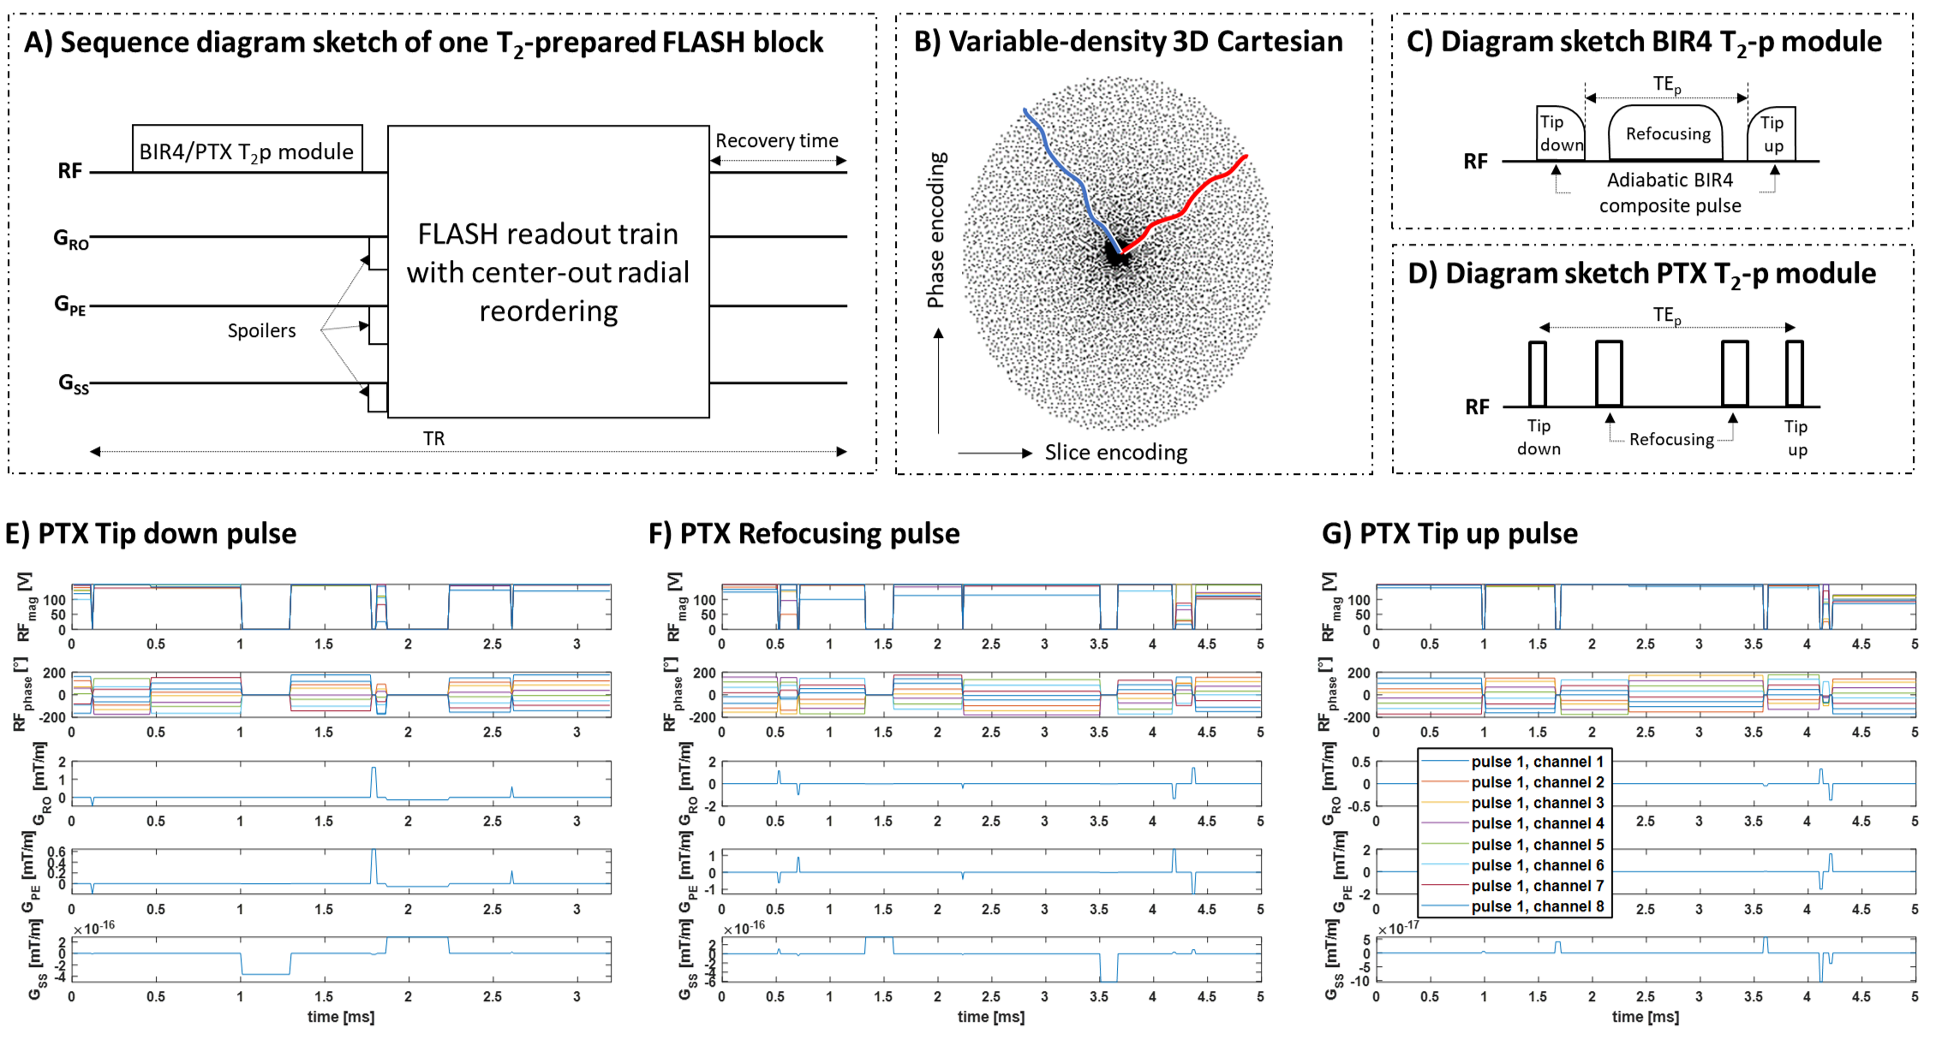
Figure 1. A) Proposed segmented T2p FLASH sequence with Cartesian spiral-phyllotaxis pattern undersampled in phase- and slice-encoding dimensions. B) Black dots indicate sampled readout lines. The red and blue lines show examples of the center-out radial-like k-space trajectory. C) Adiabatic T2p using a BIR4 composite pulse with delays between the tip (10-ms duration) and refocusing (20-ms duration) pulse segments. D) PTX-T2p module was composed of a tip-down (E), two refocusing (F), and a tip-up (G) pulses that resulted in 3.2/5/5 ms duration respectively after optimization.
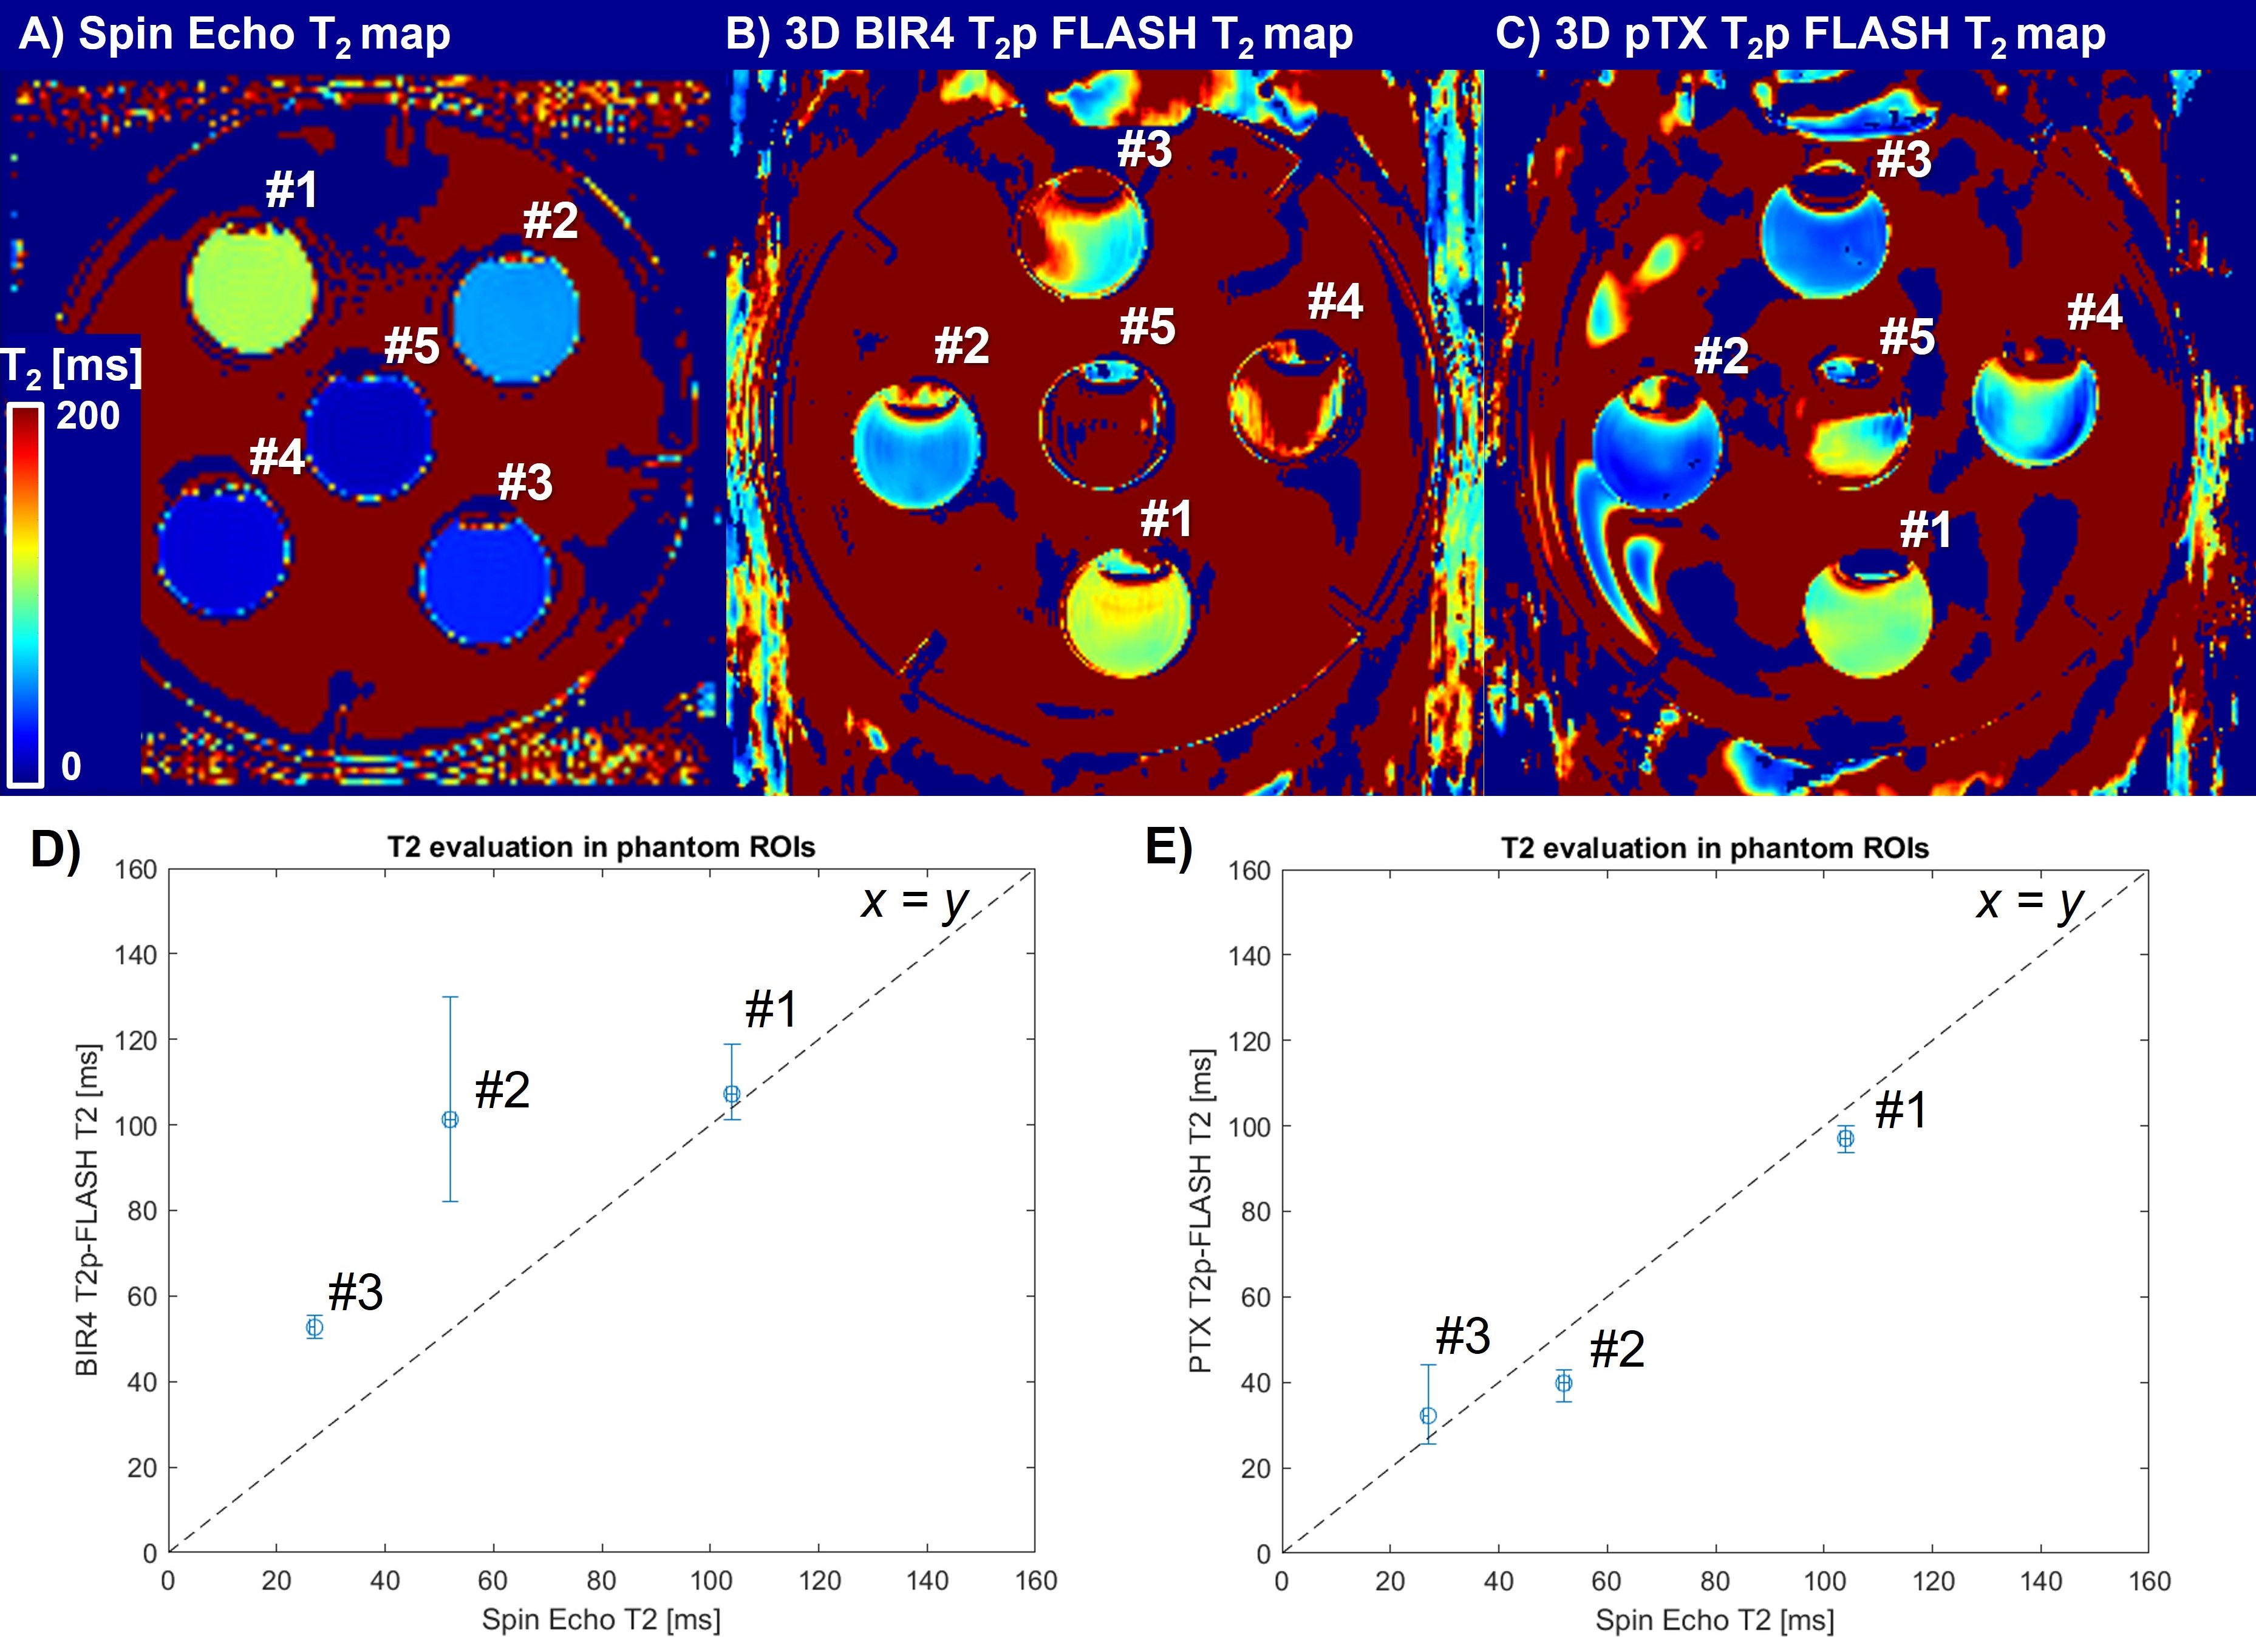
Figure 2. Phantom validation of the T2p sequences against reference spin-echo sequence. A) Using multiple single-echo spin-echo sequences with TE=10 to 40 ms, the T2 values of the compartments #1 to #5 could be estimated as: 104, 52, 27, 14, 10 ms. B-C) The T2p sequences using shortest T2p-time of 25 ms, limited by the BIR4 refocusing pulse duration, estimated compartments #1 to #3. D-E) Scatter plots of T2 medians show better agreement for PTX-T2p compared to the x=y line (dashed). Upper/lower error bars indicate the 75/25-th percentile of the estimated T2 values in the compartment ROIs.
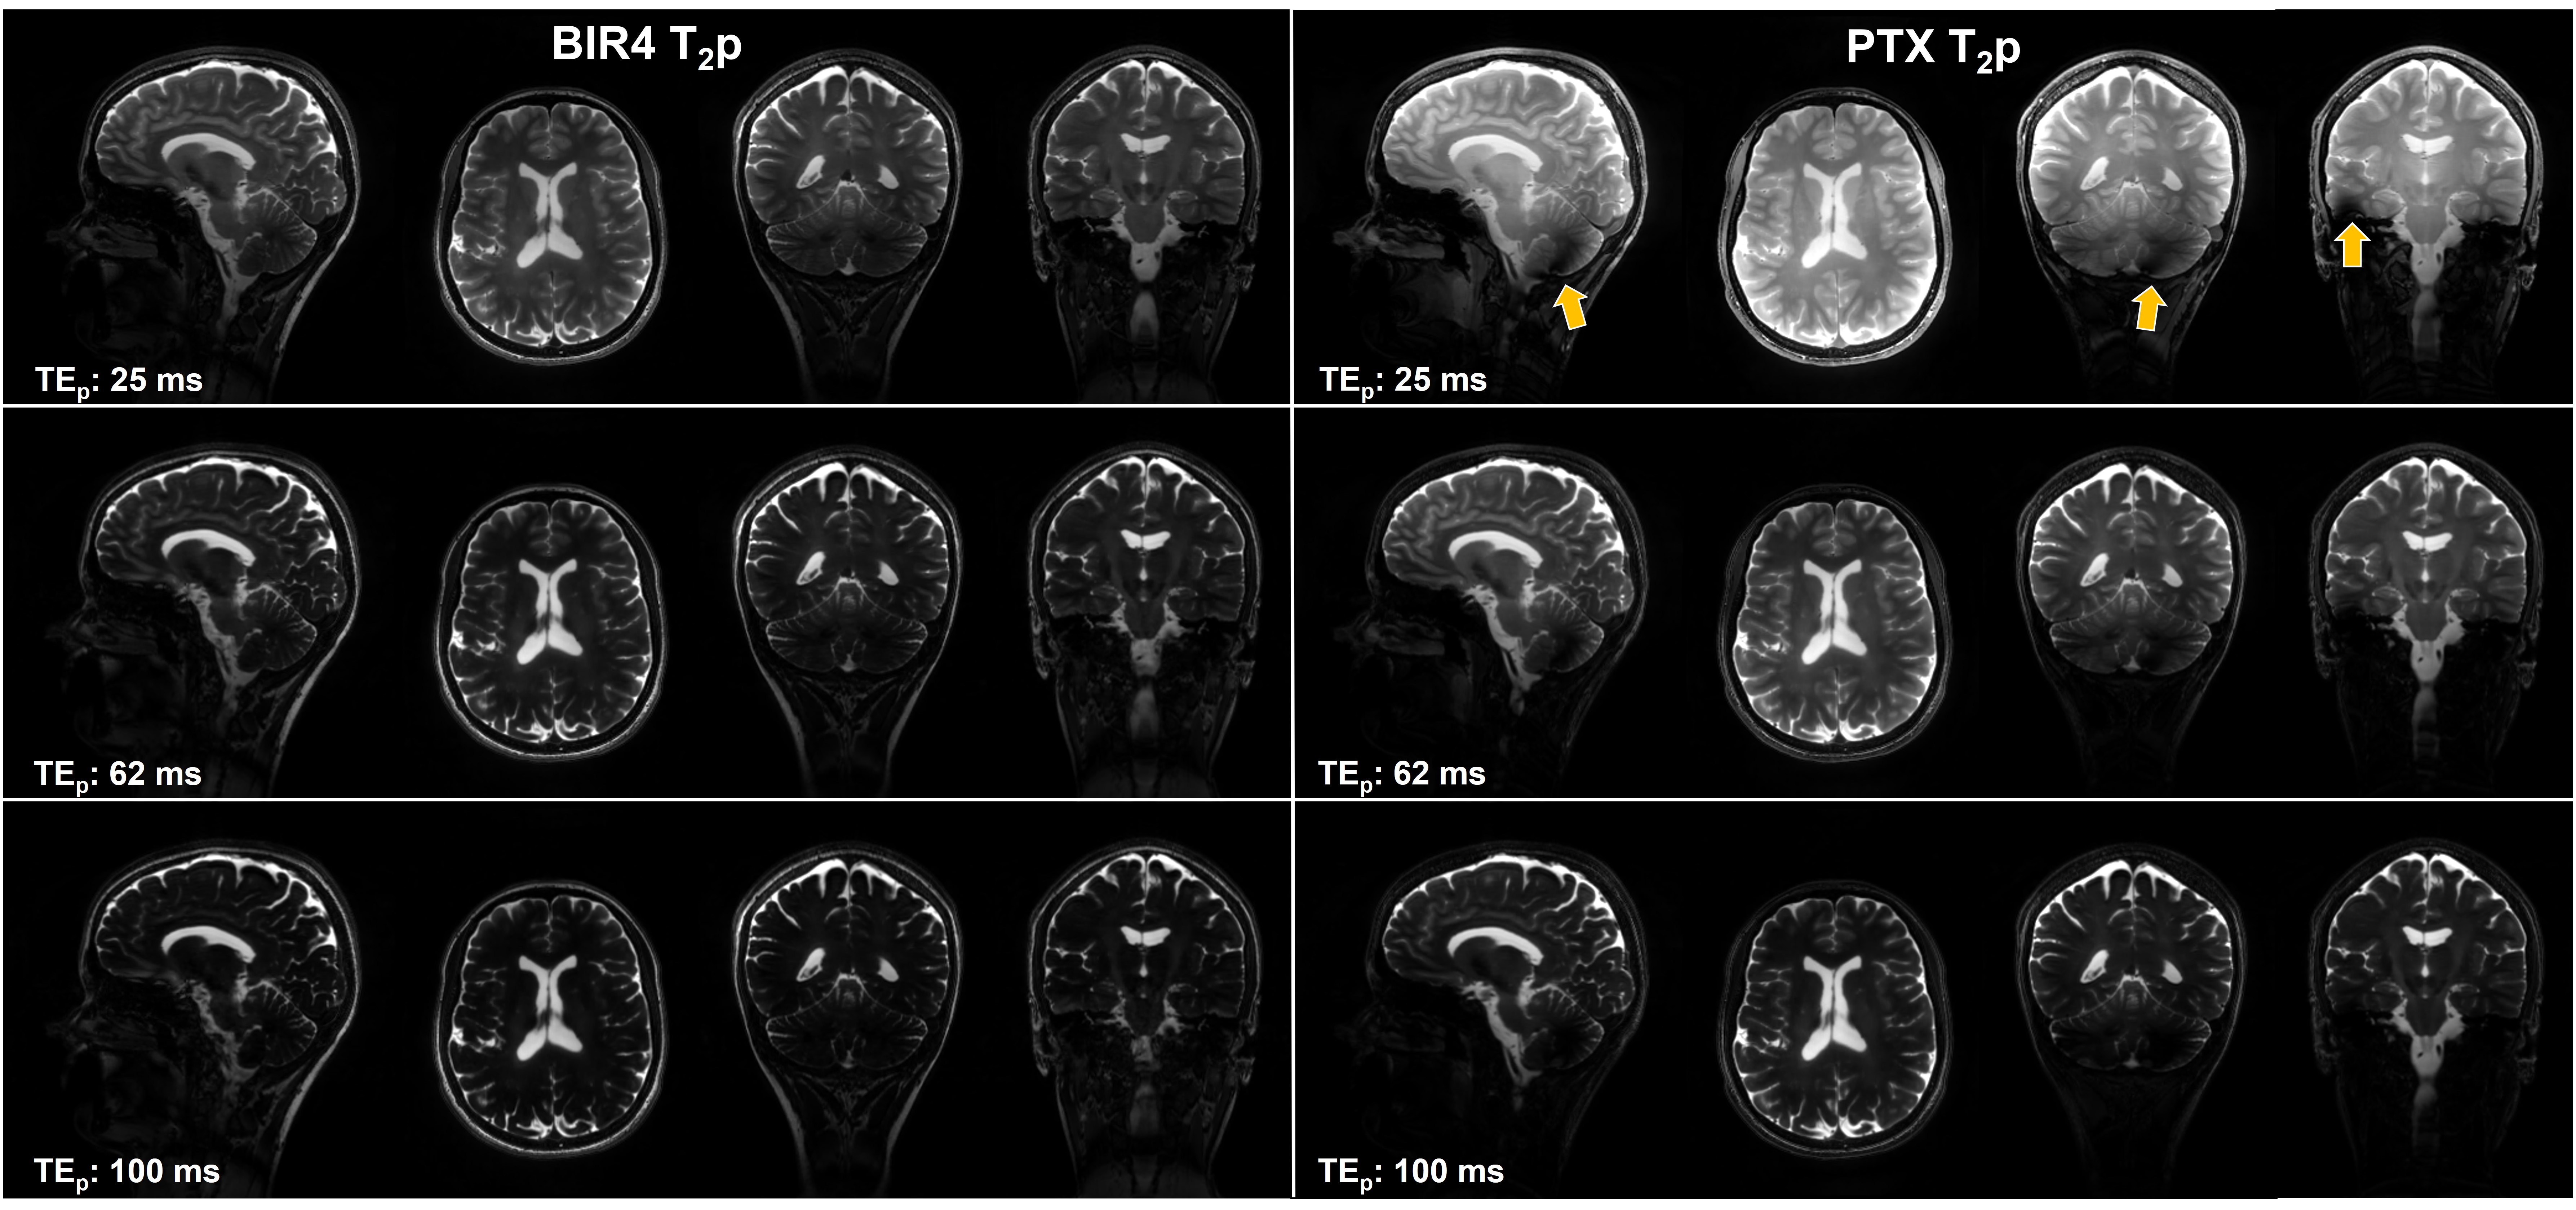
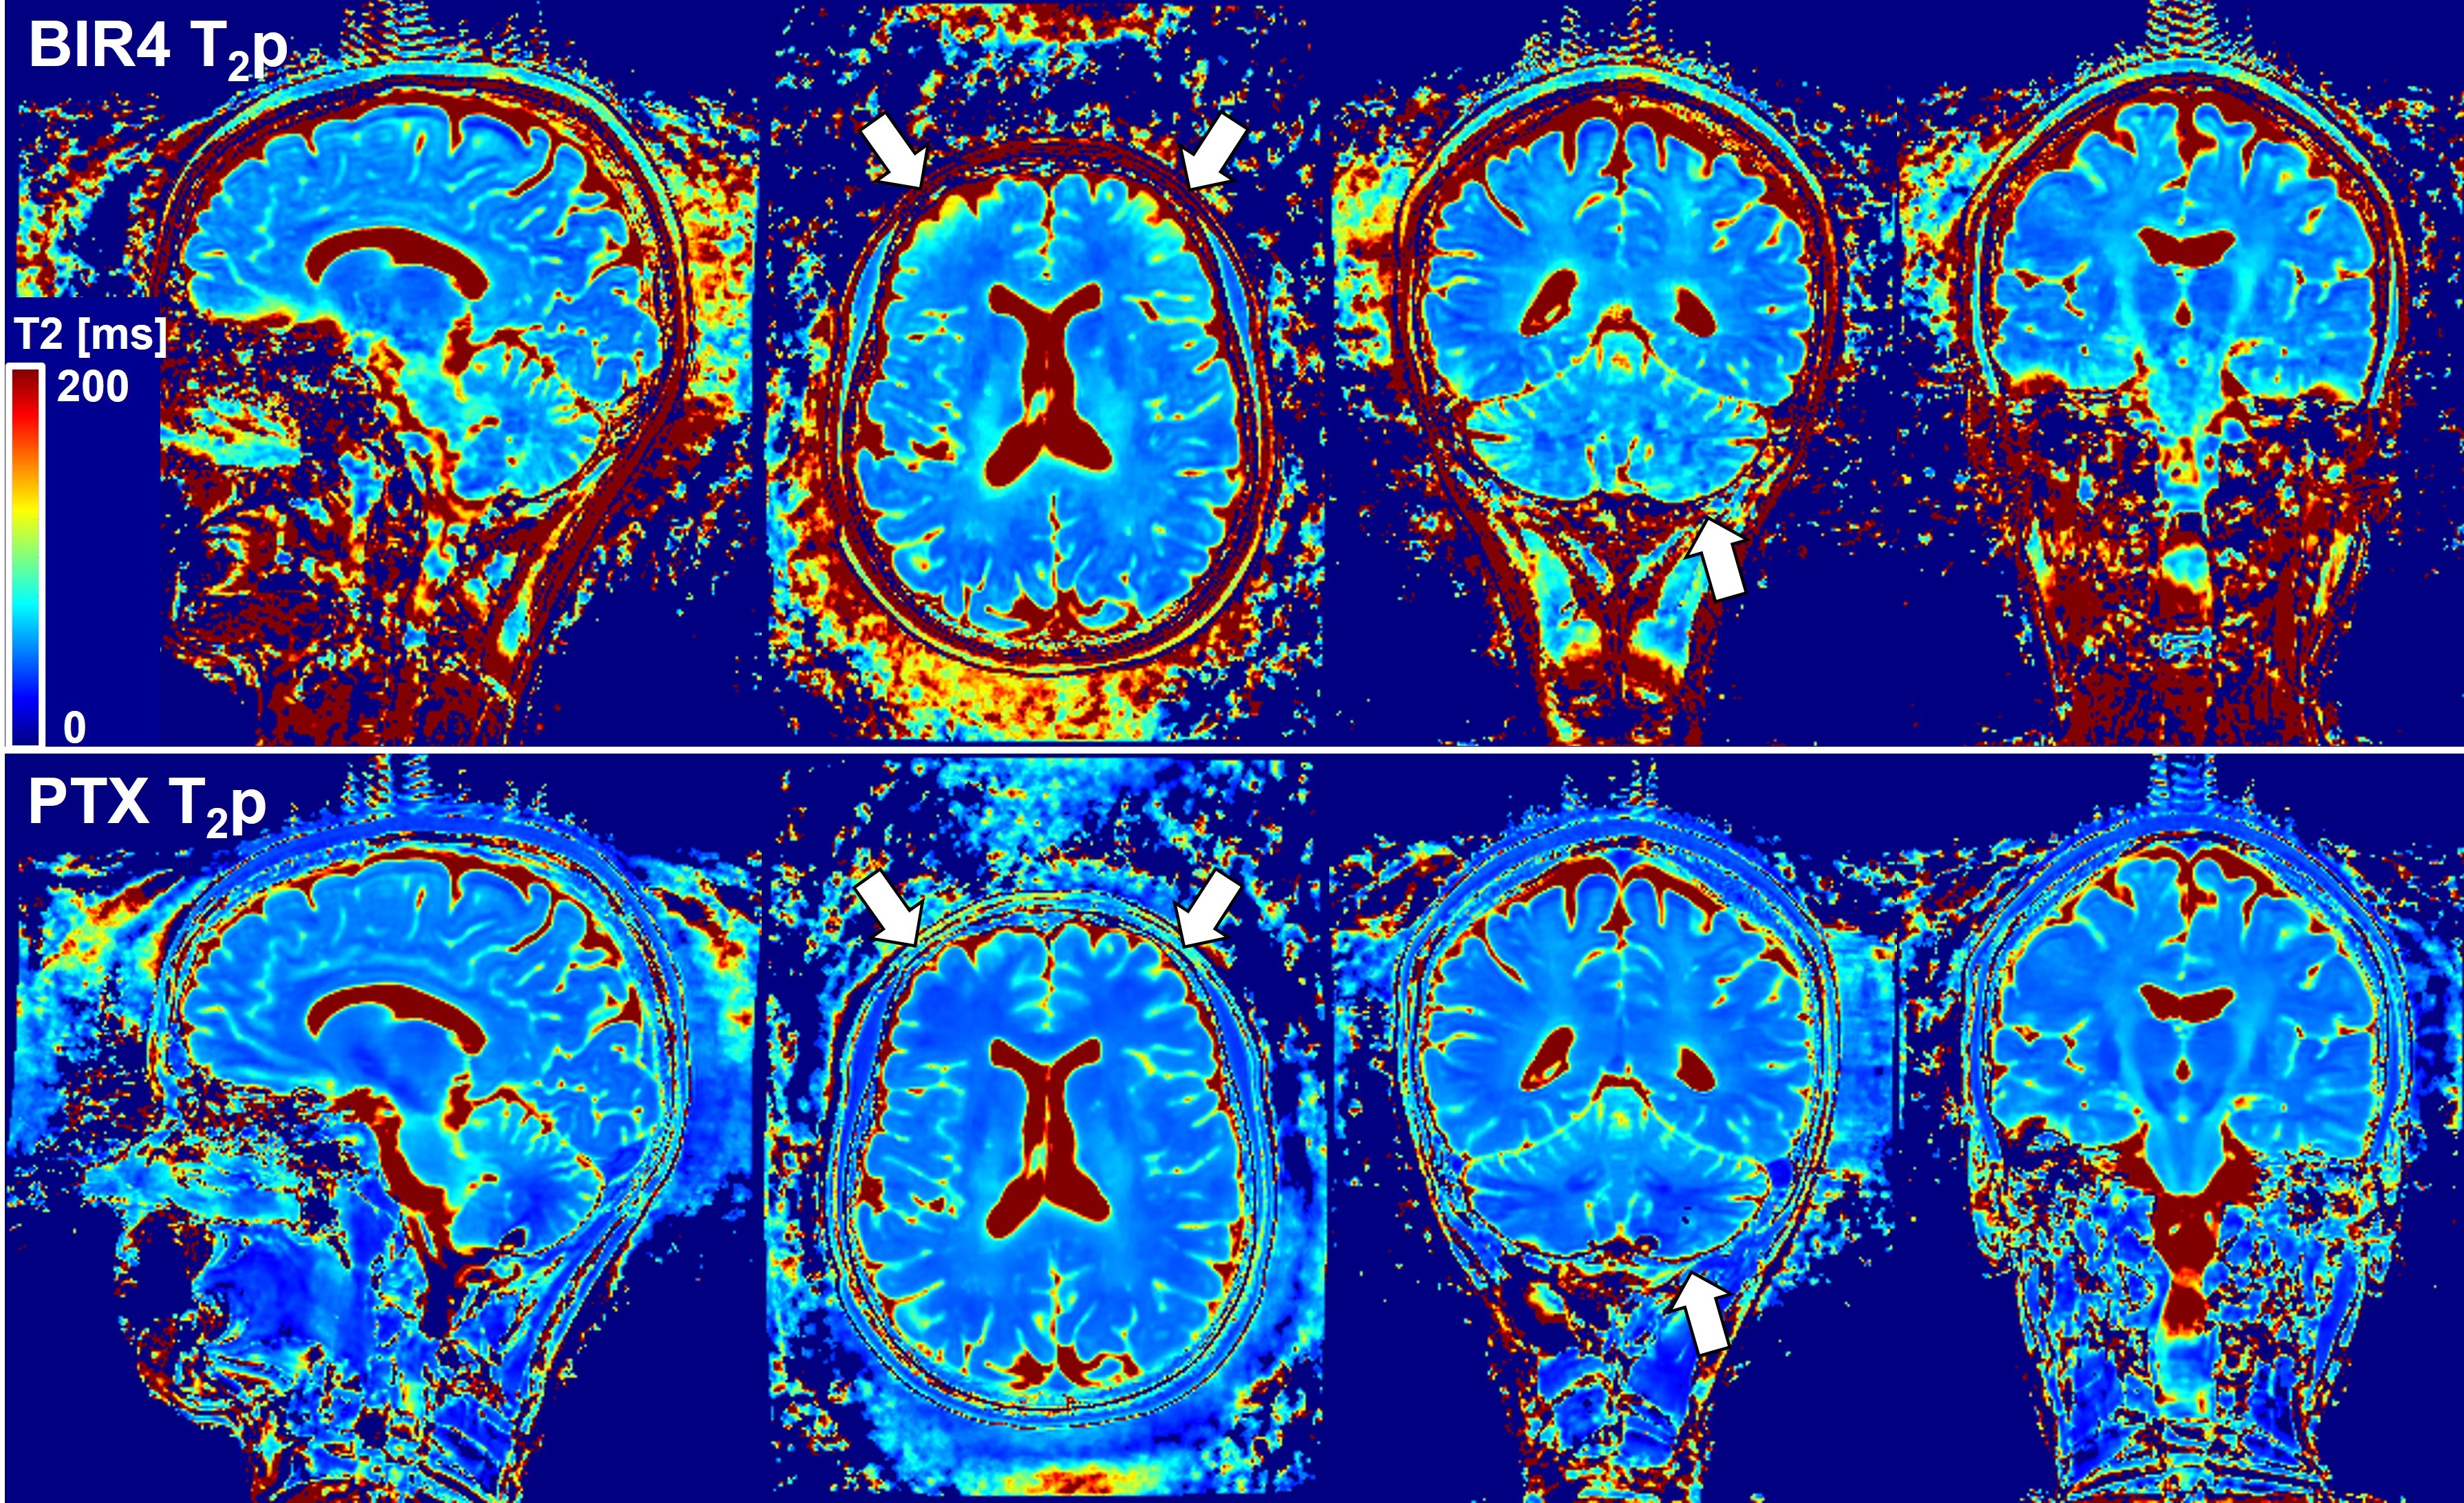
Figure 4. T2 map generated from T2p volumes shown in figure 3. T2 values show good contrast between gray matter and white matter structures with both methods. Despite signal dropouts in the cerebellum, PTX-T2p shows better signal homogeneity throughout the brain than BIR4, especially in the frontal lobe (arrows). T2 estimation may still be compromised in the inferior portion of the cerebellum due to residual B1-inhomogeneity.
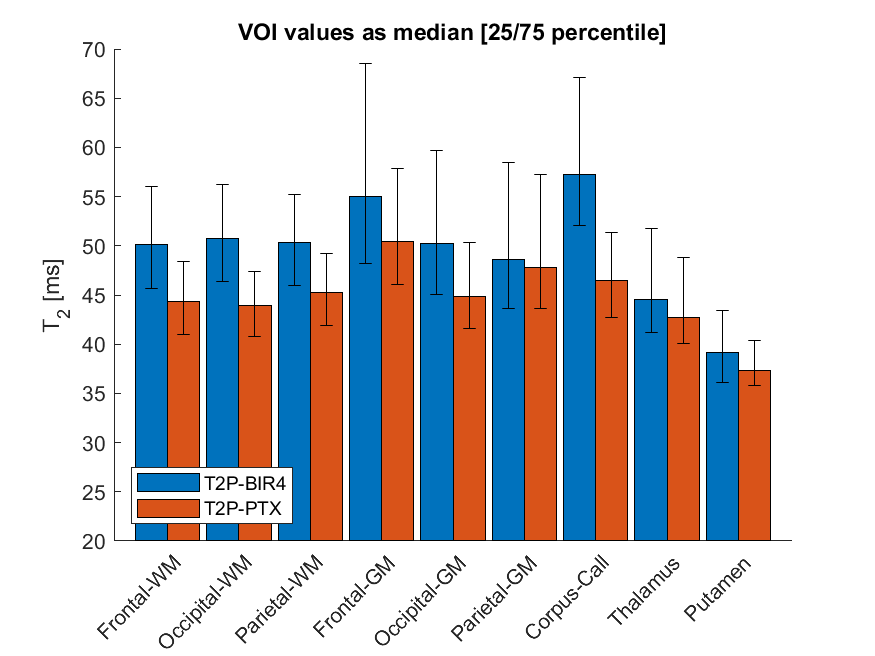
Figure 5. Quantitative results from BIR4-T2p and PTX-T2p maps in the healthy subject shown in figures 3 and 4. The BIR4-T2p sequence showed a trend for higher median T2 values than those of the PTX-T2p sequence in white and gray matter structures, as well as higher variation in gray matter. Lower/upper error bars indicate 25/75-th percentile.