0624
Efficient Time-dependent Diffusion MRI Using Multiple Stimulated Echoes1Center for Magnetic Resonance Research, University of Illinois at Chicago, Chicago, IL, United States, 2Department of Biomedical Engineering, University of Illinois at Chicago, Chicago, IL, United States, 3Departments of Radiology and Neurosurgery, University of Illinois at Chicago, Chicago, IL, United States
Synopsis
Studies on temporal diffusion characteristics can reveal a wealth of tissue microstructural information for disease evaluation, but typically require a long scan time because multiple diffusion times are need with each requiring a separate acquisition acquire. We herein report a time-efficient pulse sequence that acquires multiple diffusion-weighted images with different diffusion times in a single shot by utilizing multiple stimulated echoes with variable flip angles. This technique has been implemented on a 3T human scanner and successfully demonstrated in a quantitative diffusion phantom, the human brain gray and white matters, and the prostate peripheral zone and central grand.
Introduction
Studies on temporal diffusion characteristics can reveal a wealth of tissue microstructural information1-6. Central to all these studies is to vary the diffusion time (Δ) over a broad range in a series of diffusion MRI acquisitions7. Conventional spin-echo EPI sequence has limited flexibility in varying the diffusion time due to T2-induced signal decay. Stimulated-echo sequence (STEAM), on the other hand, can incorporate a broad range of diffusion times6,7. The total scan times, however, can be prohibitively long for human applications because each sequence corresponds to a single Δ and multiple Δ’s are needed to investigate diffusion time dependency. We herein introduce a diffusion-weighted (DW) sequence using multiple stimulated echoes with variable flip angles (DW-mSTE-VFA) to reduce the scan times by acquiring multiple DW images with different Δ’s in a single shot. We demonstrate this sequence in a diffusion phantom, human brain, and prostate.Methods
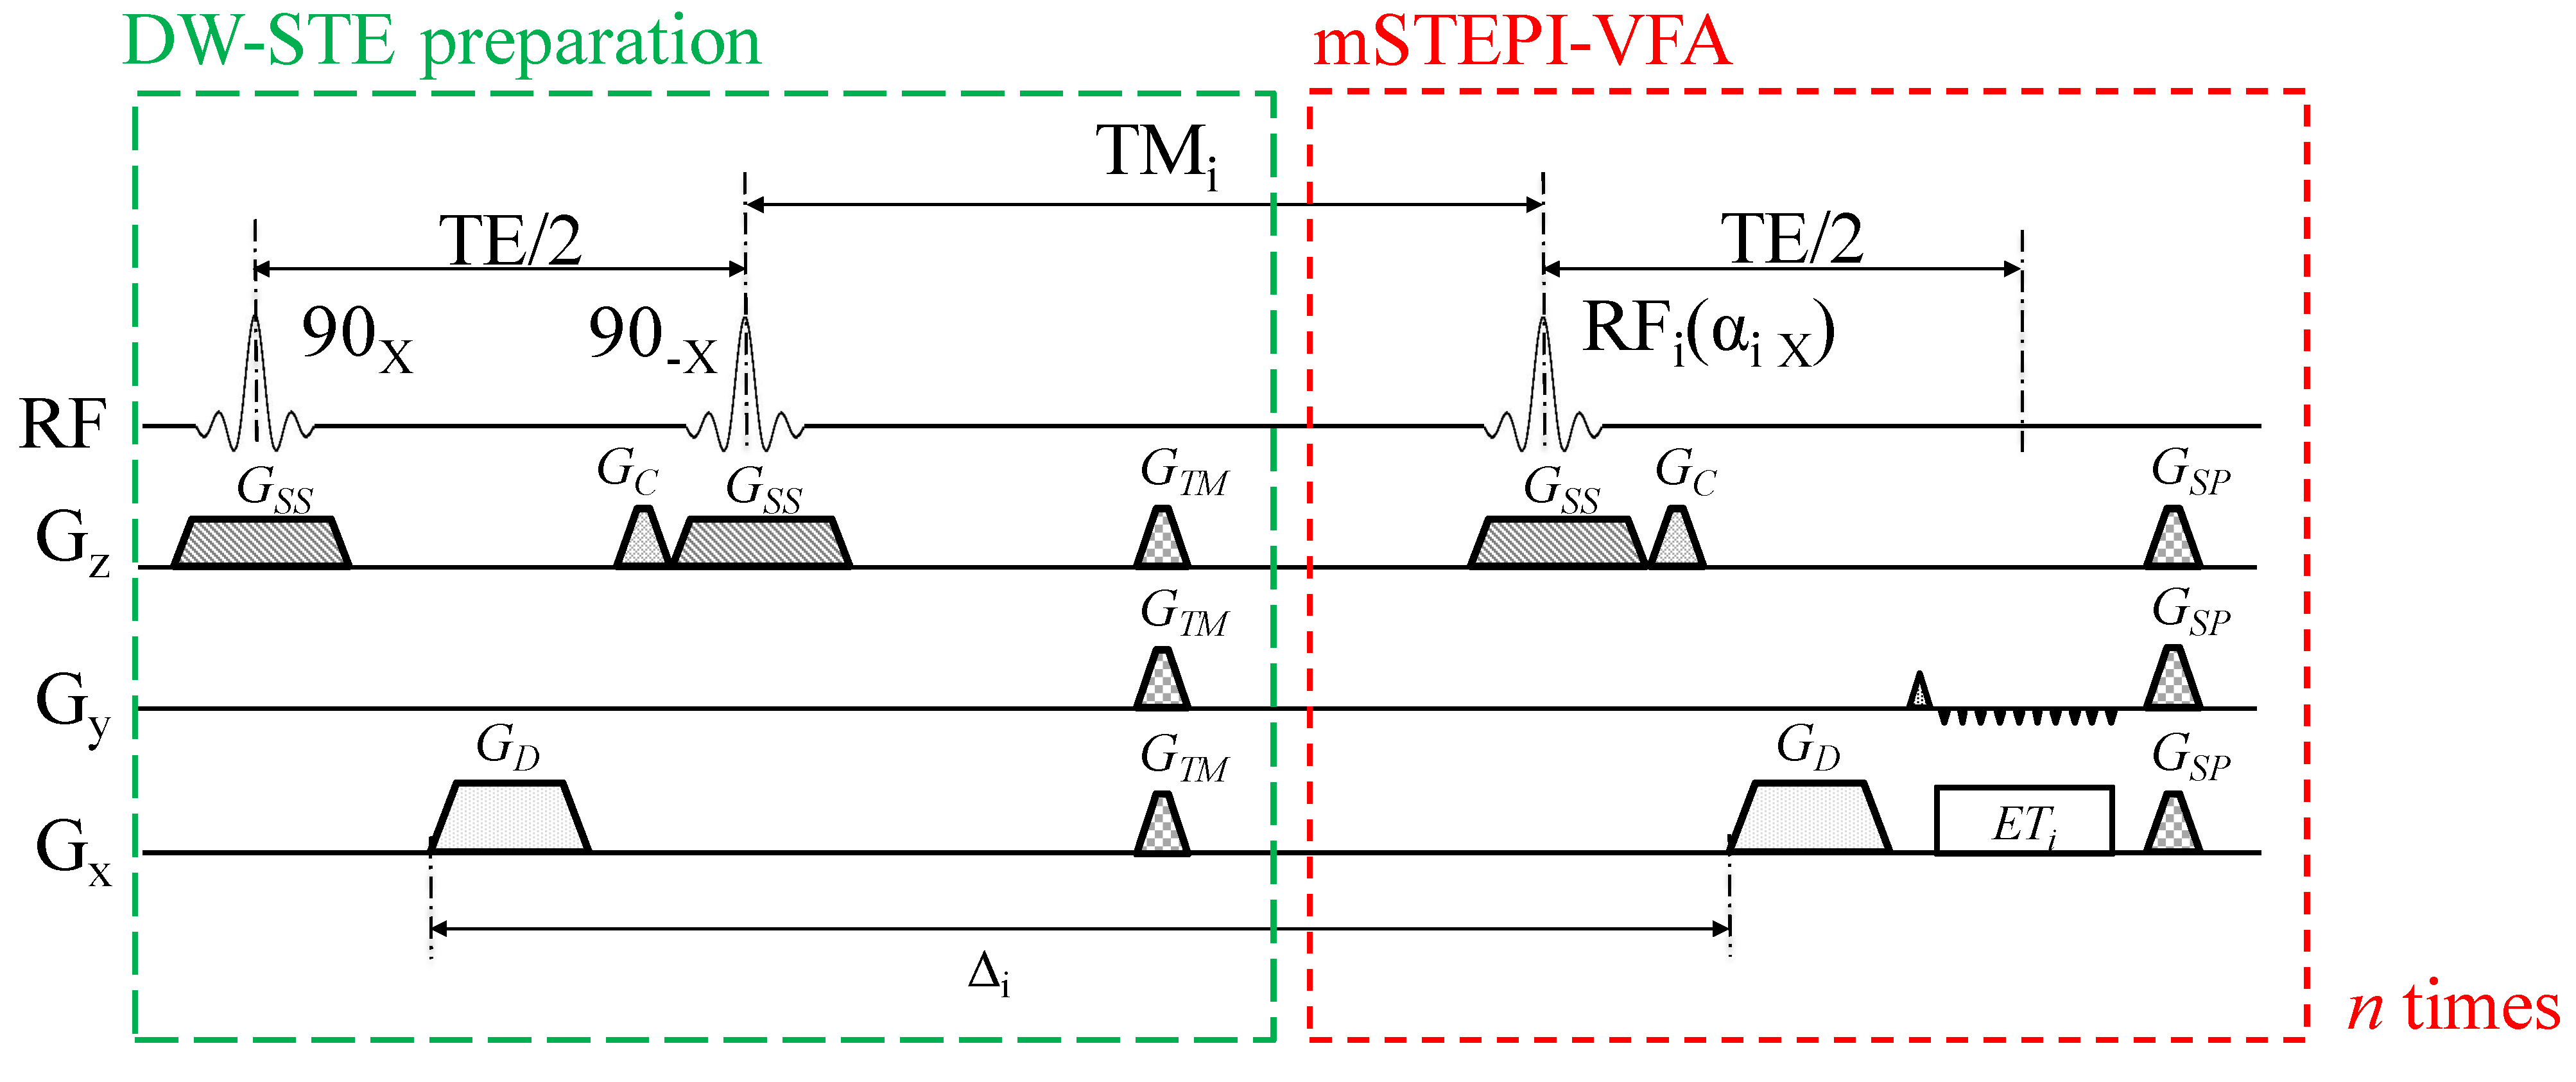
Pulse sequence design:The DW-mSTE-VFA sequence (Figure 1) consists of a module for diffusion-weighted stimulated-echo (DW-STE) preparation and another module for multi-stimulated echo acquisitions using variable flip angles (mSTEPI-VFA). The DW-STE module contains two 90° RF pulses to excite and restore half of the magnetization with a diffusion gradient lobe GD in between. This gradient serves as the first half of a Stejskal-Tanner gradient pair. In the mSTEPI-VFA module, a total of n RF pulses with VFA are played out, each followed by the second half of the Stejskal-Tanner gradient pair. Each of the resulting multiple stimulated echoes is acquired with an EPI echo-train (ETi, where i is the echo-train index) that corresponds to a distinctive different Δi. As such, the train of multiple stimulated echoes produces a set of DW images with varying diffusion times in a single shot.
Image acquisition and analysis:
The DW-mSTE-VFA sequence was implemented on a GE MR750 3T scanner. n = 3 was chosen with VFA of 35.3°, 45.0°, and 90.0°, respectively.
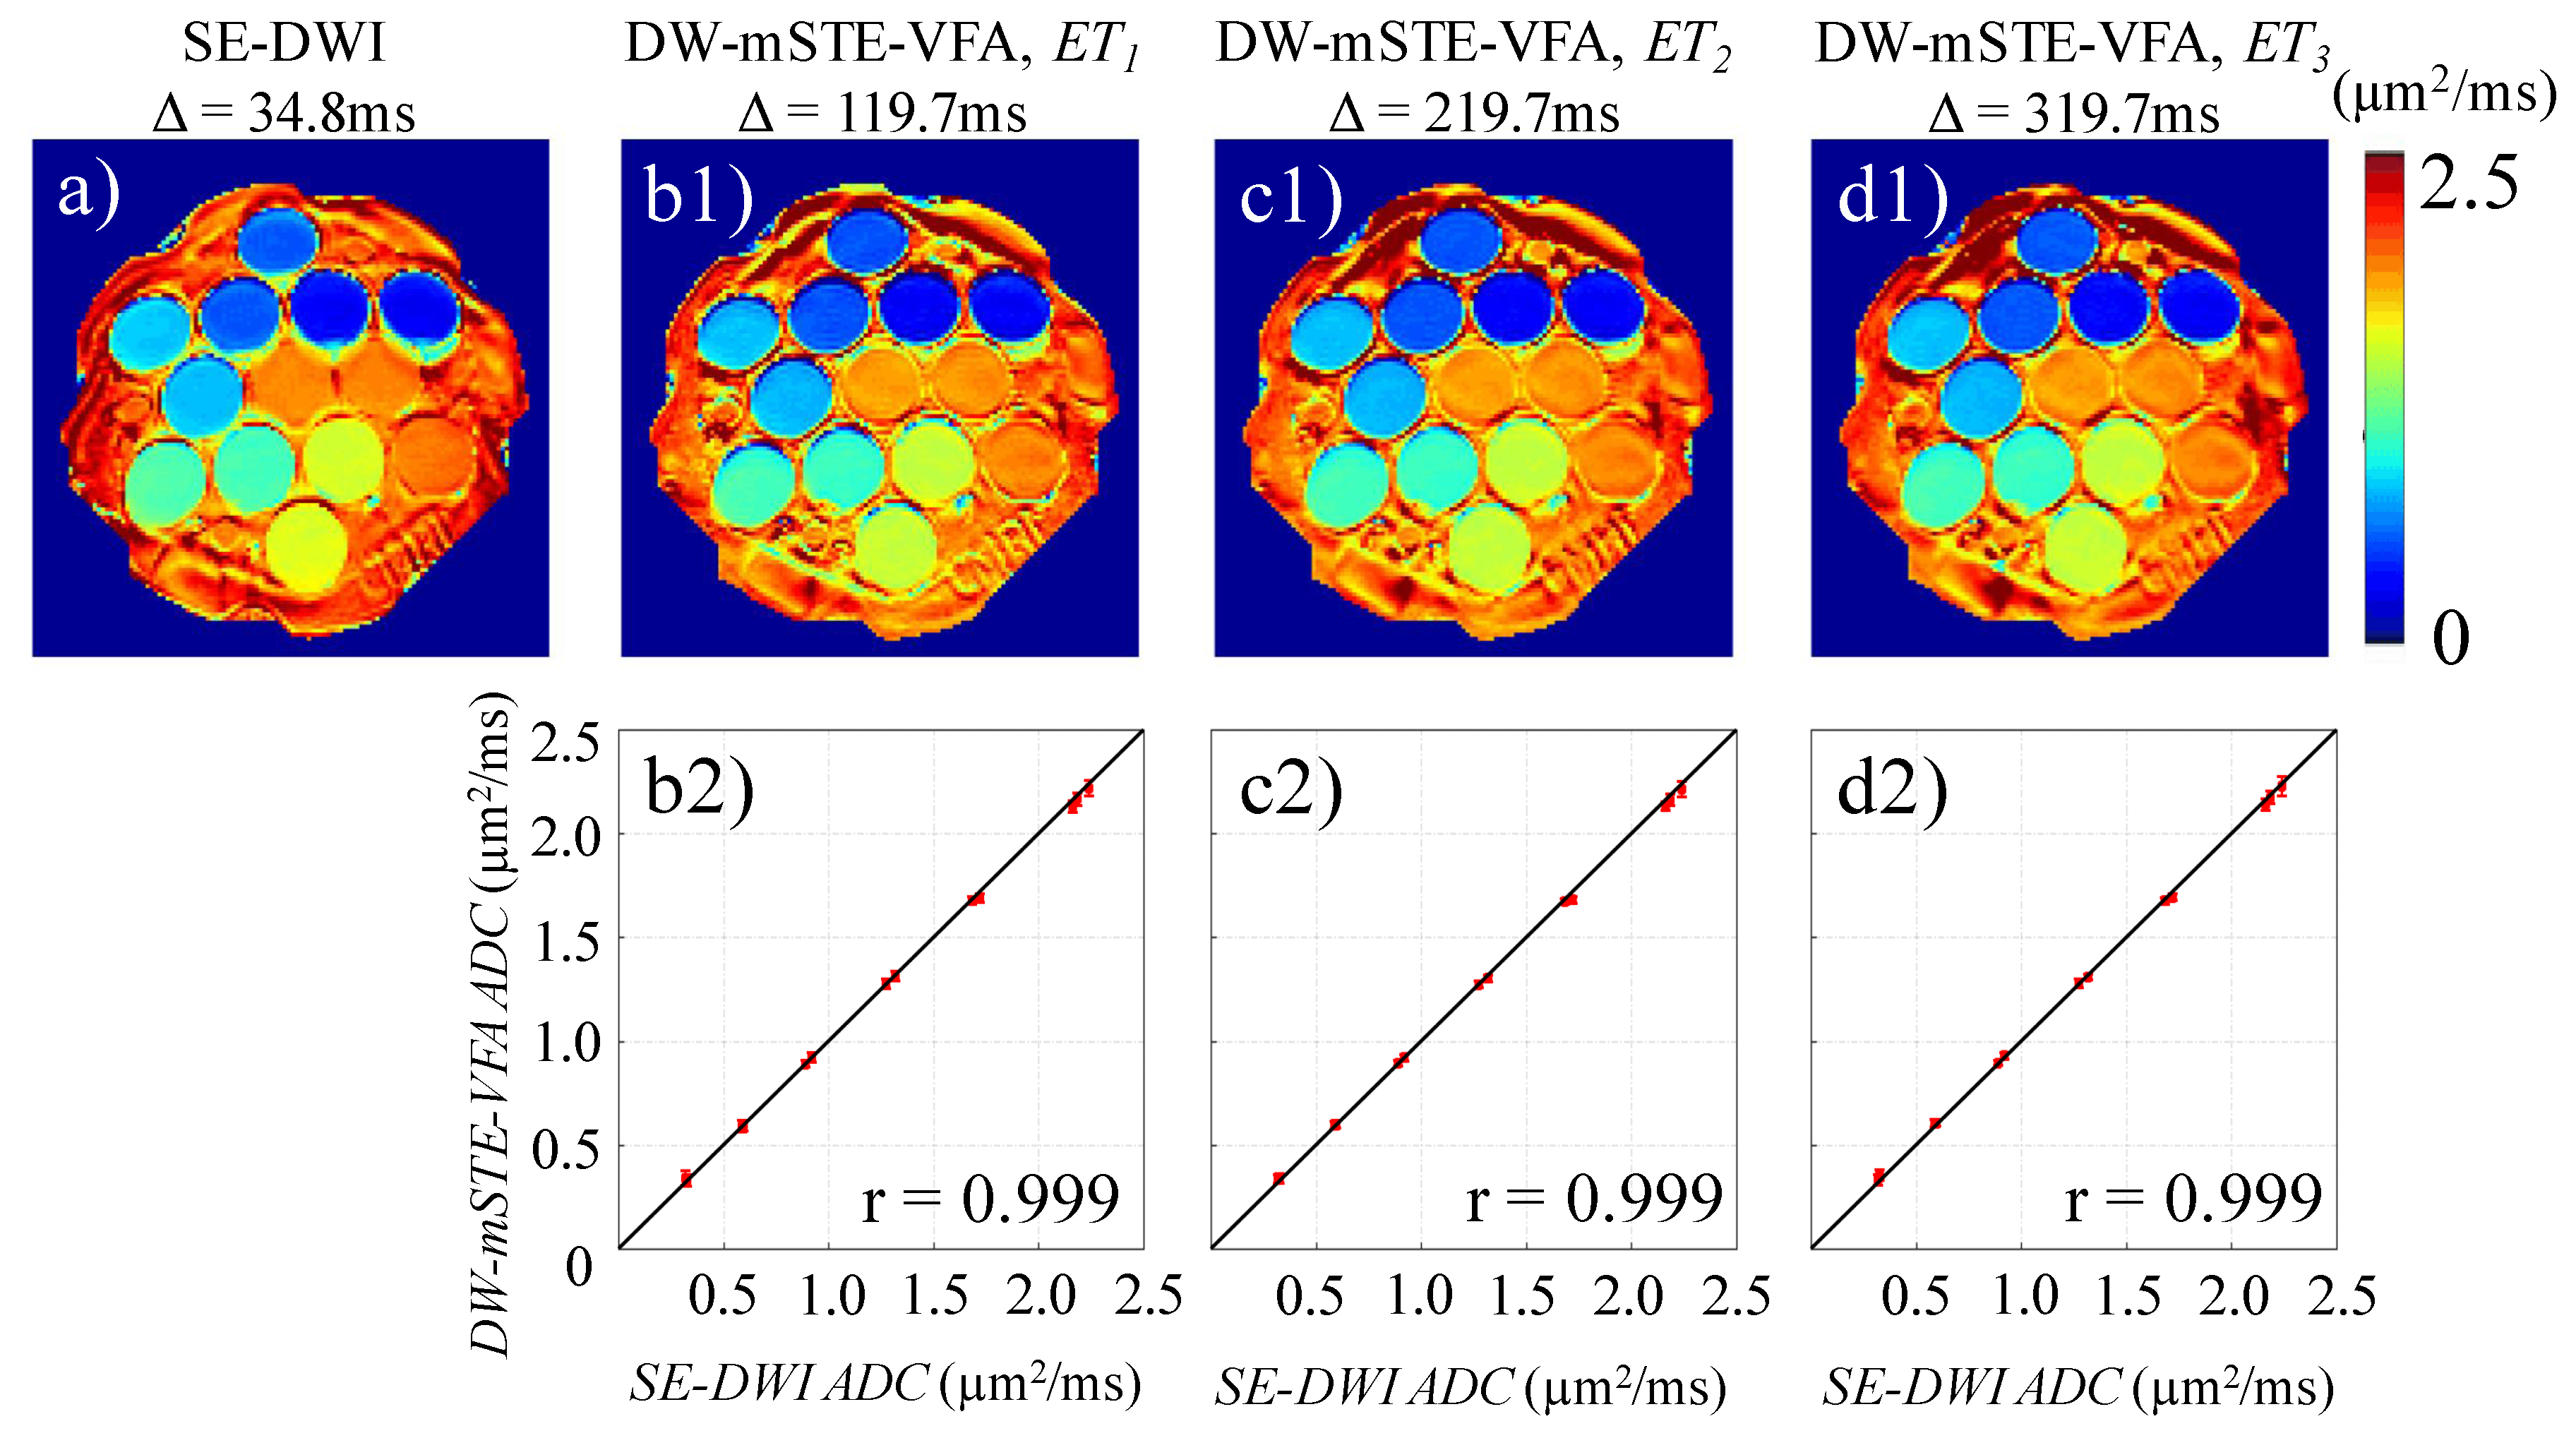
An NIST diffusion phantom consisting of 13 compartments with different diffusion coefficients was used in our experimental study. Axial DW-mSTE-VFA images were acquired using an 8-channel head coil with Δ = 119.7, 219.7, and 319.7 ms. For comparison, conventional DW images were also acquired by using a commercial single-shot spin-echo DWI (SE-DWI) sequence with Δ = 34.8 ms. A mono-exponential model was used to estimate apparent diffusion coefficient (ADC) maps from all DW datasets. Mean and standard deviation of ADC values were obtained from each compartment. Pearson correlation coefficient was calculated to evaluate the linear correlation between the ADC values measured by DW-mSTE-VFA and by SE-DWI.
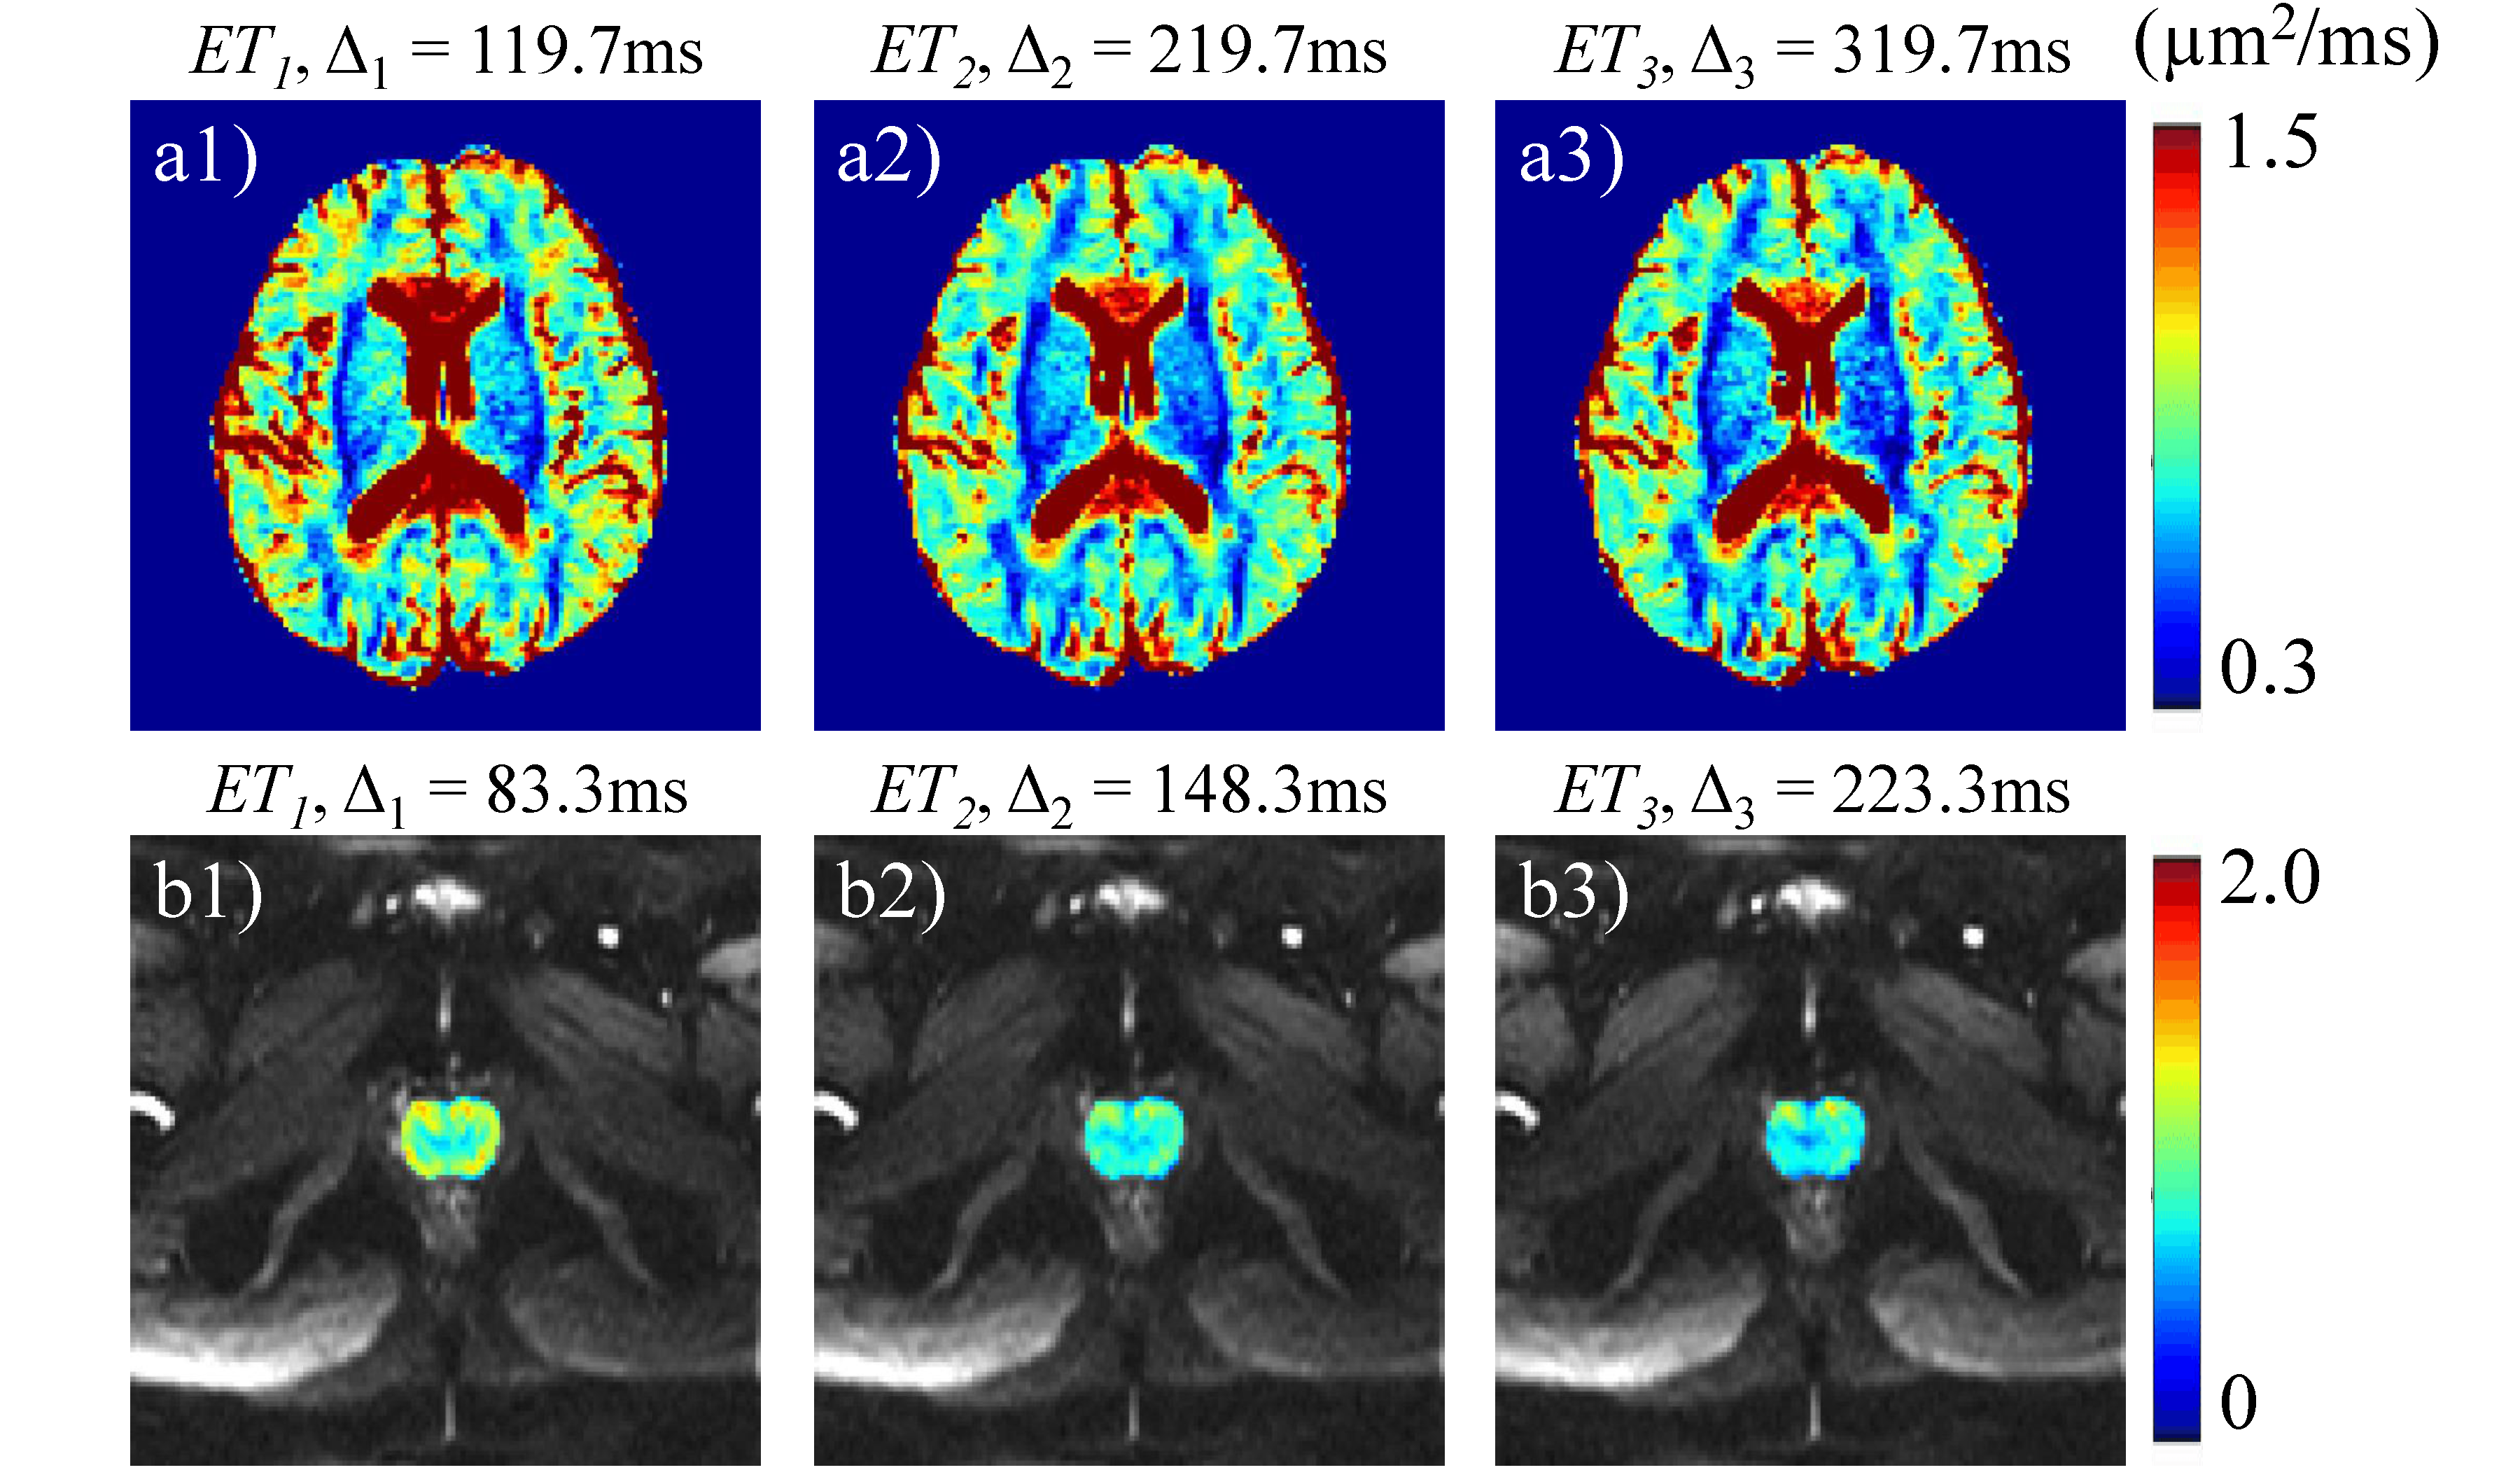
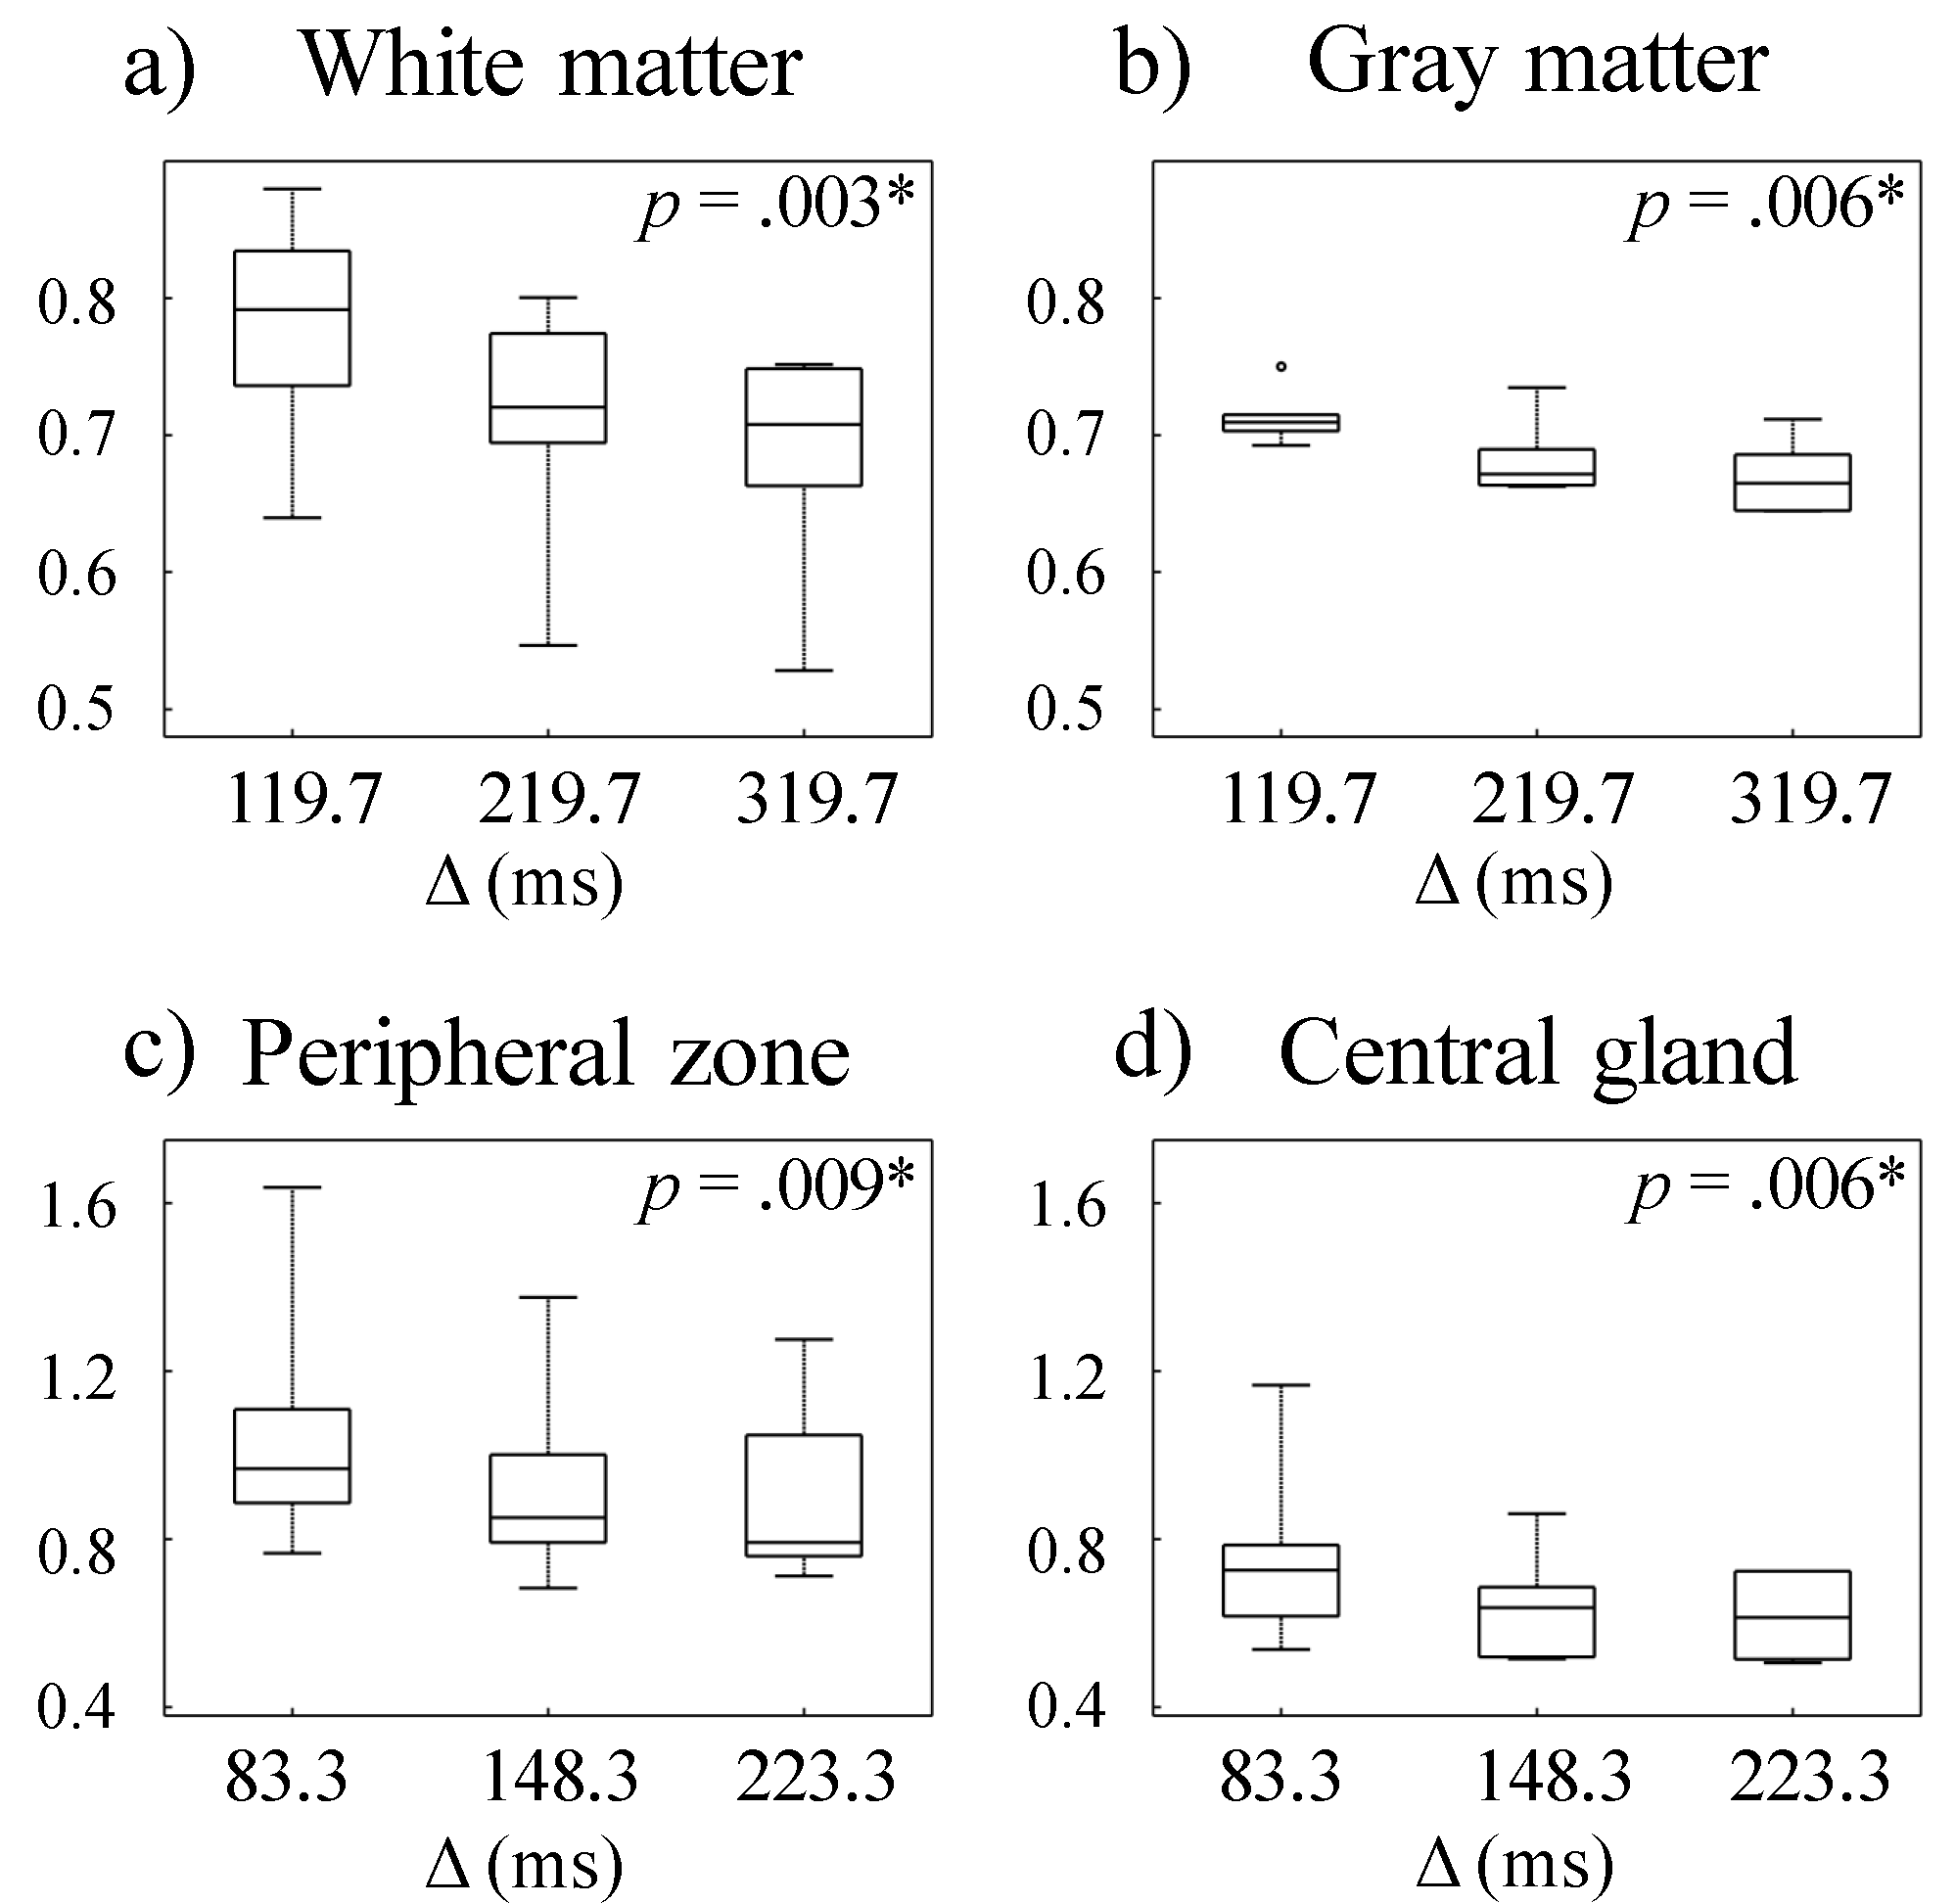
Brain and prostate imaging experiments were conducted on six healthy subjects to investigate diffusion time dependence by using the DW-mSTE-VFA sequence. For brain imaging, the same protocol as in the phantom experiment was employed. For prostate imaging with a 32-channel phased-array coil, similar imaging parameters were chosen except for Δ = 83.3, 148.3, and 223.3 ms for the three EPI readouts, respectively. ROIs were placed on multiple white matter (WM) and gray matter (GM) structures in the brain, and the peripheral zone (PZ) and central gland (CG) in the prostate. A Friedman’s test was performed to determine the statistical differences in ADC at different Δ in the WM, GM, PZ, and CG ROIs, respectively.
Results
Figure 2 displays the ADC maps of the NIST diffusion phantom from the DW-mSTE-VFA and SE-DWI sequences. The mean ADC values measured at different Δ were similar and highly correlated (r = 0.999) for all diffusion times, as expected from uniform diffusion media. The standard deviations in the ADC measurements were small for all the compartments, suggesting an excellent accuracy of using DW-mSTE-VFA for diffusion parameter quantification.Figures 3a1 – 3a3 illustrate a set of representative brain ADC maps estimated at ET1, ET2, and ET3 using DW-mSTE-VFA, respectively. As the diffusion time increased, ADC’s decreased in both WM (p = .003) and GM (p = .006), as shown in Figures 4a and 4b, respectively. Figures 3b1 – 3b3 display a set of representative prostate ADC maps at ET1, ET2, and ET3 overlaid on the DW images with b-value = 0. Similar to those for the brain, ADC’s exhibited a decreasing trend in both PZ (p = .009) and CG (p = .006) as Δ increased, as shown in Figures 4c and 4d.
Discussion and Conclusion
We have demonstrated a multiple stimulated echo sequence with variable flip angles, which can incorporate multiple diffusion times in a single shot. The proposed method utilizes the lengthy “dead time” during mixing time (TM) to support a range of diffusion times and employs variable flip angles to preserve and equalize the magnetizations. The feasibility and accuracy of this technique have been demonstrated in a phantom. Our results agreed with the previous observations that diffusion coefficient in an unrestricted medium does not depend on diffusion time8,9. In contrast, our in vivo studies on the human brain and prostate clearly revealed the ADC time-dependency in tissues where diffusion is restricted. The DW-mSTE-VFA sequence has improved the time efficiency for investigating temporal diffusion characteristics, paving the way for future studies to investigate tissue microstructures using time-dependent diffusion measurements.Acknowledgements
This work was supported in part by the National Institutes of Health (Grant Nos. 5R01EB026716-01 and 1S10RR028898-01). The content is solely the responsibility of the authors and does not necessarily represent the official views of the National Institutes of Health. We thank Drs. Diego Hernando and Yuxin Zhang from University of Wisconsin-Madison for providing the original DW-STEAM sequence, Dr. Arnaud Guidon from GE Healthcare for facilitating pulse sequence collaboration, Dr. Stephen E. Russek for providing the NIST/NIBIB diffusion phantom, and Drs. Zheng Zhong and Muge Karaman for helpful discussions.References
1. Jiang X, Li H, Xie J, et al. Quantification of cell size using temporal diffusion spectroscopy. Magn. Reson. Med. 2016;75:1076–1085.
2. Reynaud O, Winters KV, Hoang DM, et al. Pulsed and oscillating gradient MRI for assessment of cell size and extracellular space (POMACE) in mouse gliomas. NMR Biomed. 2016;29:1350–1363.
3. Xu J, Li H, Harkins KD, et al. Mapping mean axon diameter and axonal volume fraction by MRI using temporal diffusion spectroscopy. Neuroimage. 2014;103:10–19.
4. Iima M, Nobashi T, Imai H, et al. Effects of diffusion time on non-Gaussian diffusion and intravoxel incoherent motion (IVIM) MRI parameters in breast cancer and hepatocellular carcinoma xenograft models. Acta Radiol. Open. 2018;7:205846011775156.
5. Iima M, Yamamoto A, Kataoka M, et al. Time-dependent diffusion MRI to distinguish malignant from benign head and neck tumors. J. Magn. Reson. Imaging. 2019;50:88–95.
6. Lemberskiy G, Rosenkrantz AB, Veraart J, et al. Time-dependent diffusion in prostate cancer. Invest. Radiol. 2017;52:405–411.
7. Dan G, Li W, Zhong Z, et al. Diffusion in sephadex gel structures: Time dependency revealed by multi-sequence acquisition over a broad diffusion time range. Mathematics. 2021;9(14):1688.
8. Kiselev, VG. Fundamentals of diffusion MRI physics. NMR Biomed. 2017;30(3):e3602.
9. Haddar H, Li J, Schiavi S. A macroscopic model for the diffusion MRI signal accounting for time-dependent diffusivity. SIAM J. Appl. Math. 2016;76(3):930–949.
Figures