0622
Robust STARE (Steady-state T2 And Rf Estimation) for high-resolution quantitative T2 mapping at 7T MRI
Rita Schmidt1,2
1Brain Sciences, Weizmann Institute of Science, Rehovot, Israel, 2The Azrieli National Institute for Human Brain Imaging and Research, Weizmann Institute of Science, Rehovot, Israel
1Brain Sciences, Weizmann Institute of Science, Rehovot, Israel, 2The Azrieli National Institute for Human Brain Imaging and Research, Weizmann Institute of Science, Rehovot, Israel
Synopsis
T2 mapping can provide a valuable tool for monitoring and characterization of the tissue changes in the brain. Its implementation in 7T MRI will improve SNR and resolution, but also needs to overcome an increase in SAR and B1 inhomogeneity. We developed a Steady-state T2 And Rf Estimation (STARE) method capable to deliver T2 and RF-field maps in 7T brain imaging. This work summarizes progress towards robust high-resolution whole brain T2 mapping. The method was examined in phantoms and human imaging. Whole brain T2 maps with 1mm resolution were acquired within 3:27 minutes, sufficiently fast to be used in clinics.
Introduction
Quantitative T2 mapping is an important tool towards standardization of MRI in both the clinics and research1,2. Its implementation in 7T MRI will improve SNR and spatial resolution, but also includes challenges such as an increase in SAR and B1 inhomogeneity. Recent works3,4 demonstrated that T2 maps can be obtained from phase images of a modified 3D spoiled-gradient GRE (SGRE) at 3T. In our work, we developed a Steady-state T2 And Rf Estimation (STARE) method capable to deliver T2 and RF field maps in 7T brain imaging5. STARE was based on four scans, required for removing the global phase and for obtaining the T2 and B1 maps. This work summarizes progress towards robust high-resolution whole brain T2 mapping with STARE – including a support for optimal coverage of brain B1 distribution; a built-in phase correction between scans, employing dual echo for B0 correction; a T1–related correction; and a reduction of the number of scans to three, thus reducing the total scan duration. The method was examined in phantoms and human imaging.Methods
The STARE acquisition is a 3D SGRE with a short TR (10 msec in this study). It was shown in a previous study3 that a notable T2 contrast can be achieved when the RF-pulses’ phase in the SGRE steady-state increases quadratically, similarly to RF-spoiling, but with a smaller increment of the phase steps (e.g., φinc =2°). The phase ($$$\angle$$$S) of the signal S at a voxel is θ(α,T2,T1) plus a global phase θ0. This θ0 arises from several factors, with a dominant contribution from B0. It can be eliminated by repeating the scan with +φinc and -φinc and setting θ(α,T2,T1)=$$$\angle$$$(Sφinc∙conj(S-φinc))/2. Neglecting T1 effects, two acquisitions with flip angles αscan and 2∙ αscan suffice to provide the T2 and B1 maps.The following steps were included to increase the T2 mapping accuracy, to reduce the total scan time and to increase robustness to phase fluctuations.
Scan optimization and scan duration:
- Bloch simulations for different scan parameters were examined to support wider coverage of brain B1 distribution at 7T. Two sets of scans were chosen. The first scan, with αscan1=15° and φinc1=3°, provided θ1 maps, while the second, with αscan2=η∙αscan1 (1.6<η<2) and φinc2=1.5° provided θ2 maps. Fig.1 shows T2(θ1, θ2) and α(θ1, θ2) for both the previous case, using φinc=2 and the new set, which supports a wider flip angle range( 3°-24°).
- θ0 was calculated from two scans, using (αscan1=15°,φinc=3°) and (αscan1=15°,φinc=-3°), such that θ0=$$$\angle$$$(Sφinc=3∙Sφinc=-3)/2. Basic phase unwarping was performed. For the scan using 2αscan only one scan was performed (with φinc=+1.5°), with θ2 calculated as θ2=$$$\angle$$$(Sφinc=1.5∙e-iθ0). Thus, only three scans were required to estimate the T2 and B1 maps, instead of four previously, reducing the total scan duration.
- B0 fluctuations between scans were monitored by dual echo acquisitions. Phase changes, estimated as Δθ0=2π ΔB0∙TEecho1 were compensated. This improved robustness to phase changes from physiological effects such as movement and breathing.
- T1 related correction – Phase dependence on T1 is small, but accounts for ~10%. To reduce this, voxels were classified as either 'high' or 'low' T1 – by empirical thresholding . A separate dictionary was used for each, based on T1=1s (representing white matter) and T1=2s (the rest).
Results
Figure 2a shows a T2 comparison on agar tubes. The figure shows the same standard deviation in STARE and SE-SE, with STARE being faster by ×2.3. The deviation between T2 values with STARE and SE-SE was estimated with normalized root-mean-square-error (NRMSE) as 0.7%. Figures 2b,c compare T2 maps of STARE and SE-SE in a 3D head-shaped phantom with a uniform T2 distribution. STARE also provides comparable B1 distribution to the vendor map. Figure 3 shows a well-compensated (intentional) inter-scan B0 change applied manually between the scans and corrected by the dual echo acquisition. Figure 4 and 5 show human imaging, comparing 4-scans and 3-scans STARE with SE-SE, demonstrating similar results.Conclusions
Improved STARE, based on a simple 3D-GRE acquisition, offers robust T2 and B1 mapping for 7T brain imaging. The dual echo acquisition compensates for phase fluctuations between the scan, reducing potential artifacts from breathing and motion. Whole brain quantitative T2 maps with 1mm isotropic resolution were acquired within 3:27 minutes, sufficiently fast to be used in clinics.Acknowledgements
No acknowledgement found.References
[1] Luo Z. et.al. Eur Radiol Exp. 4,59, 2020, [2] Bouhrara M. et.al. NeuroImage 206,2020; [3] Wang X. et.al. MRM 84, 2019; [4] Tamada D. et.al. Proc. Intl. Soc. Mag. Reson. Med. 29 ; 3081;2021; [5] Schmidt R. et.al. Proc. Intl. Soc. Mag. Reson. Med. 29 (2021), 0551; [6] Jona et.al. NMR BioMed 2020; [7] https://mrirecon.github.io/bartFigures
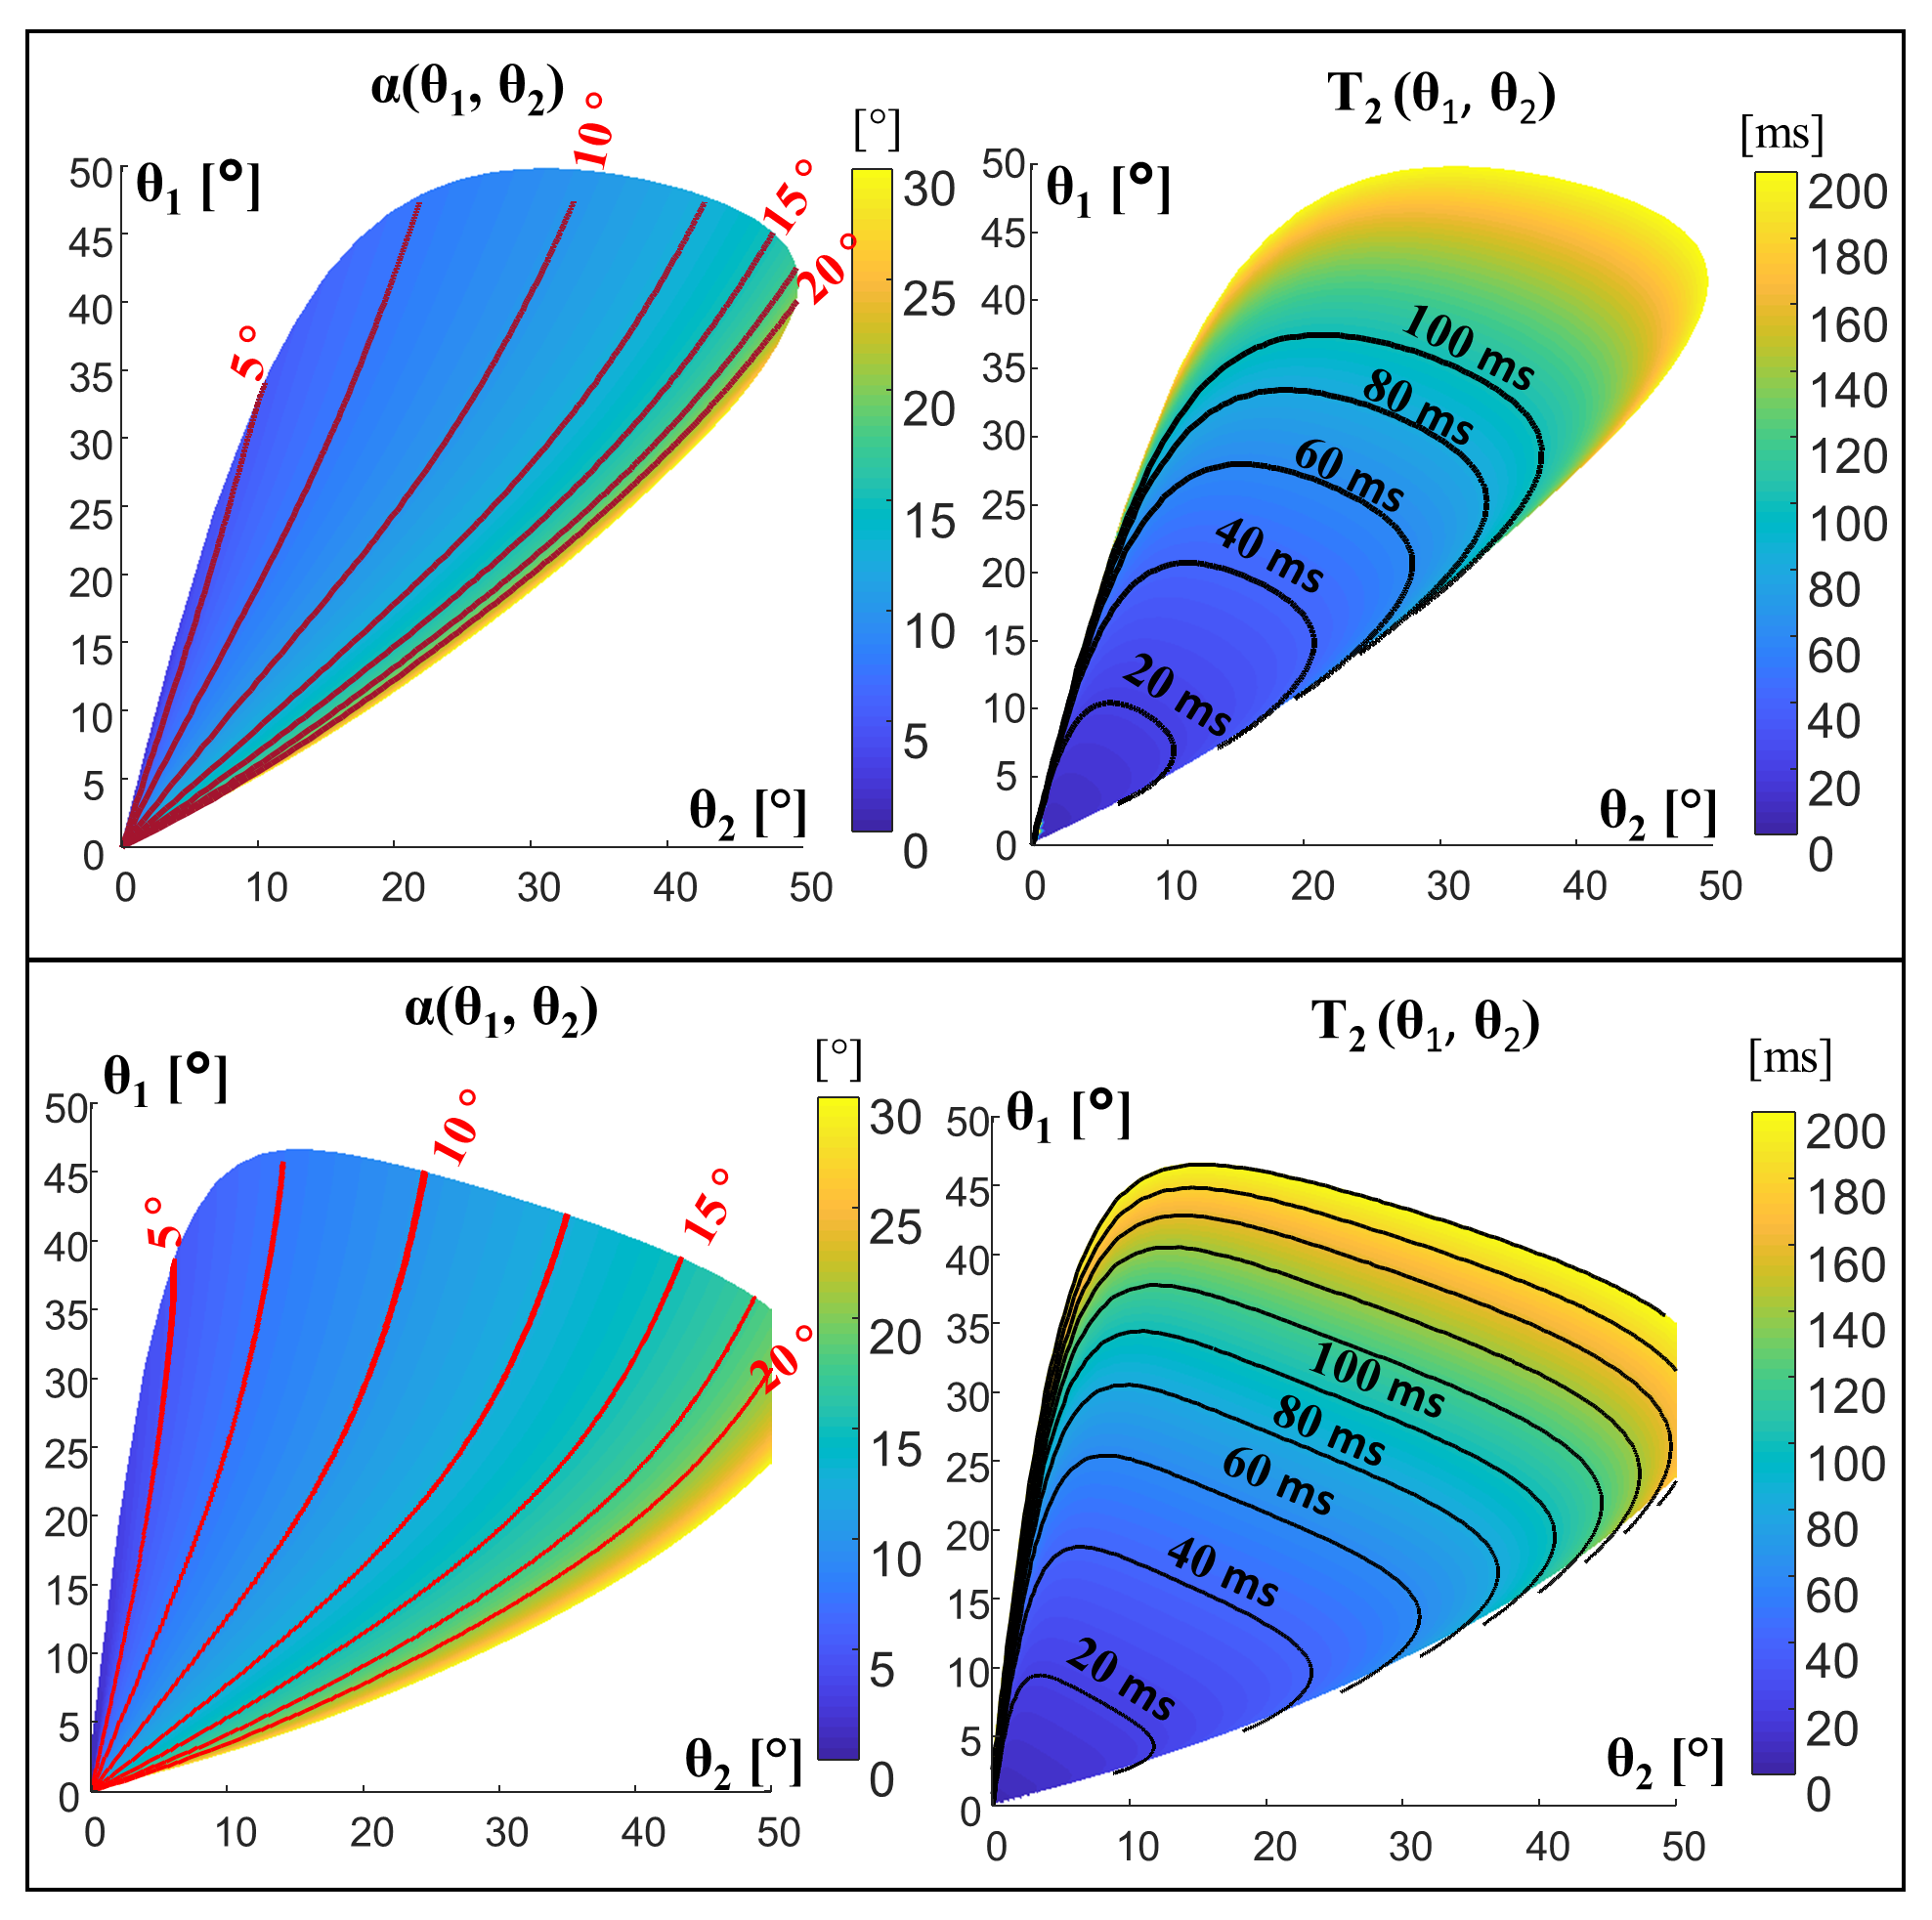
Figure 1: The (θ1,
θ2) 2D space for T2 and α estimation based on Bloch simulations. (θ1, θ2 – phase from two scans).
top) both scans (α and 2α) acquired
with φinc=2°,
bottom) scan #1 with α and φinc1=3°, scan
#2 with 2α and φinc2=1.5°.
For each case α (θ1, θ2) and T2 (θ1,
θ2) are shown with the equi-T2 and equi-α lines.
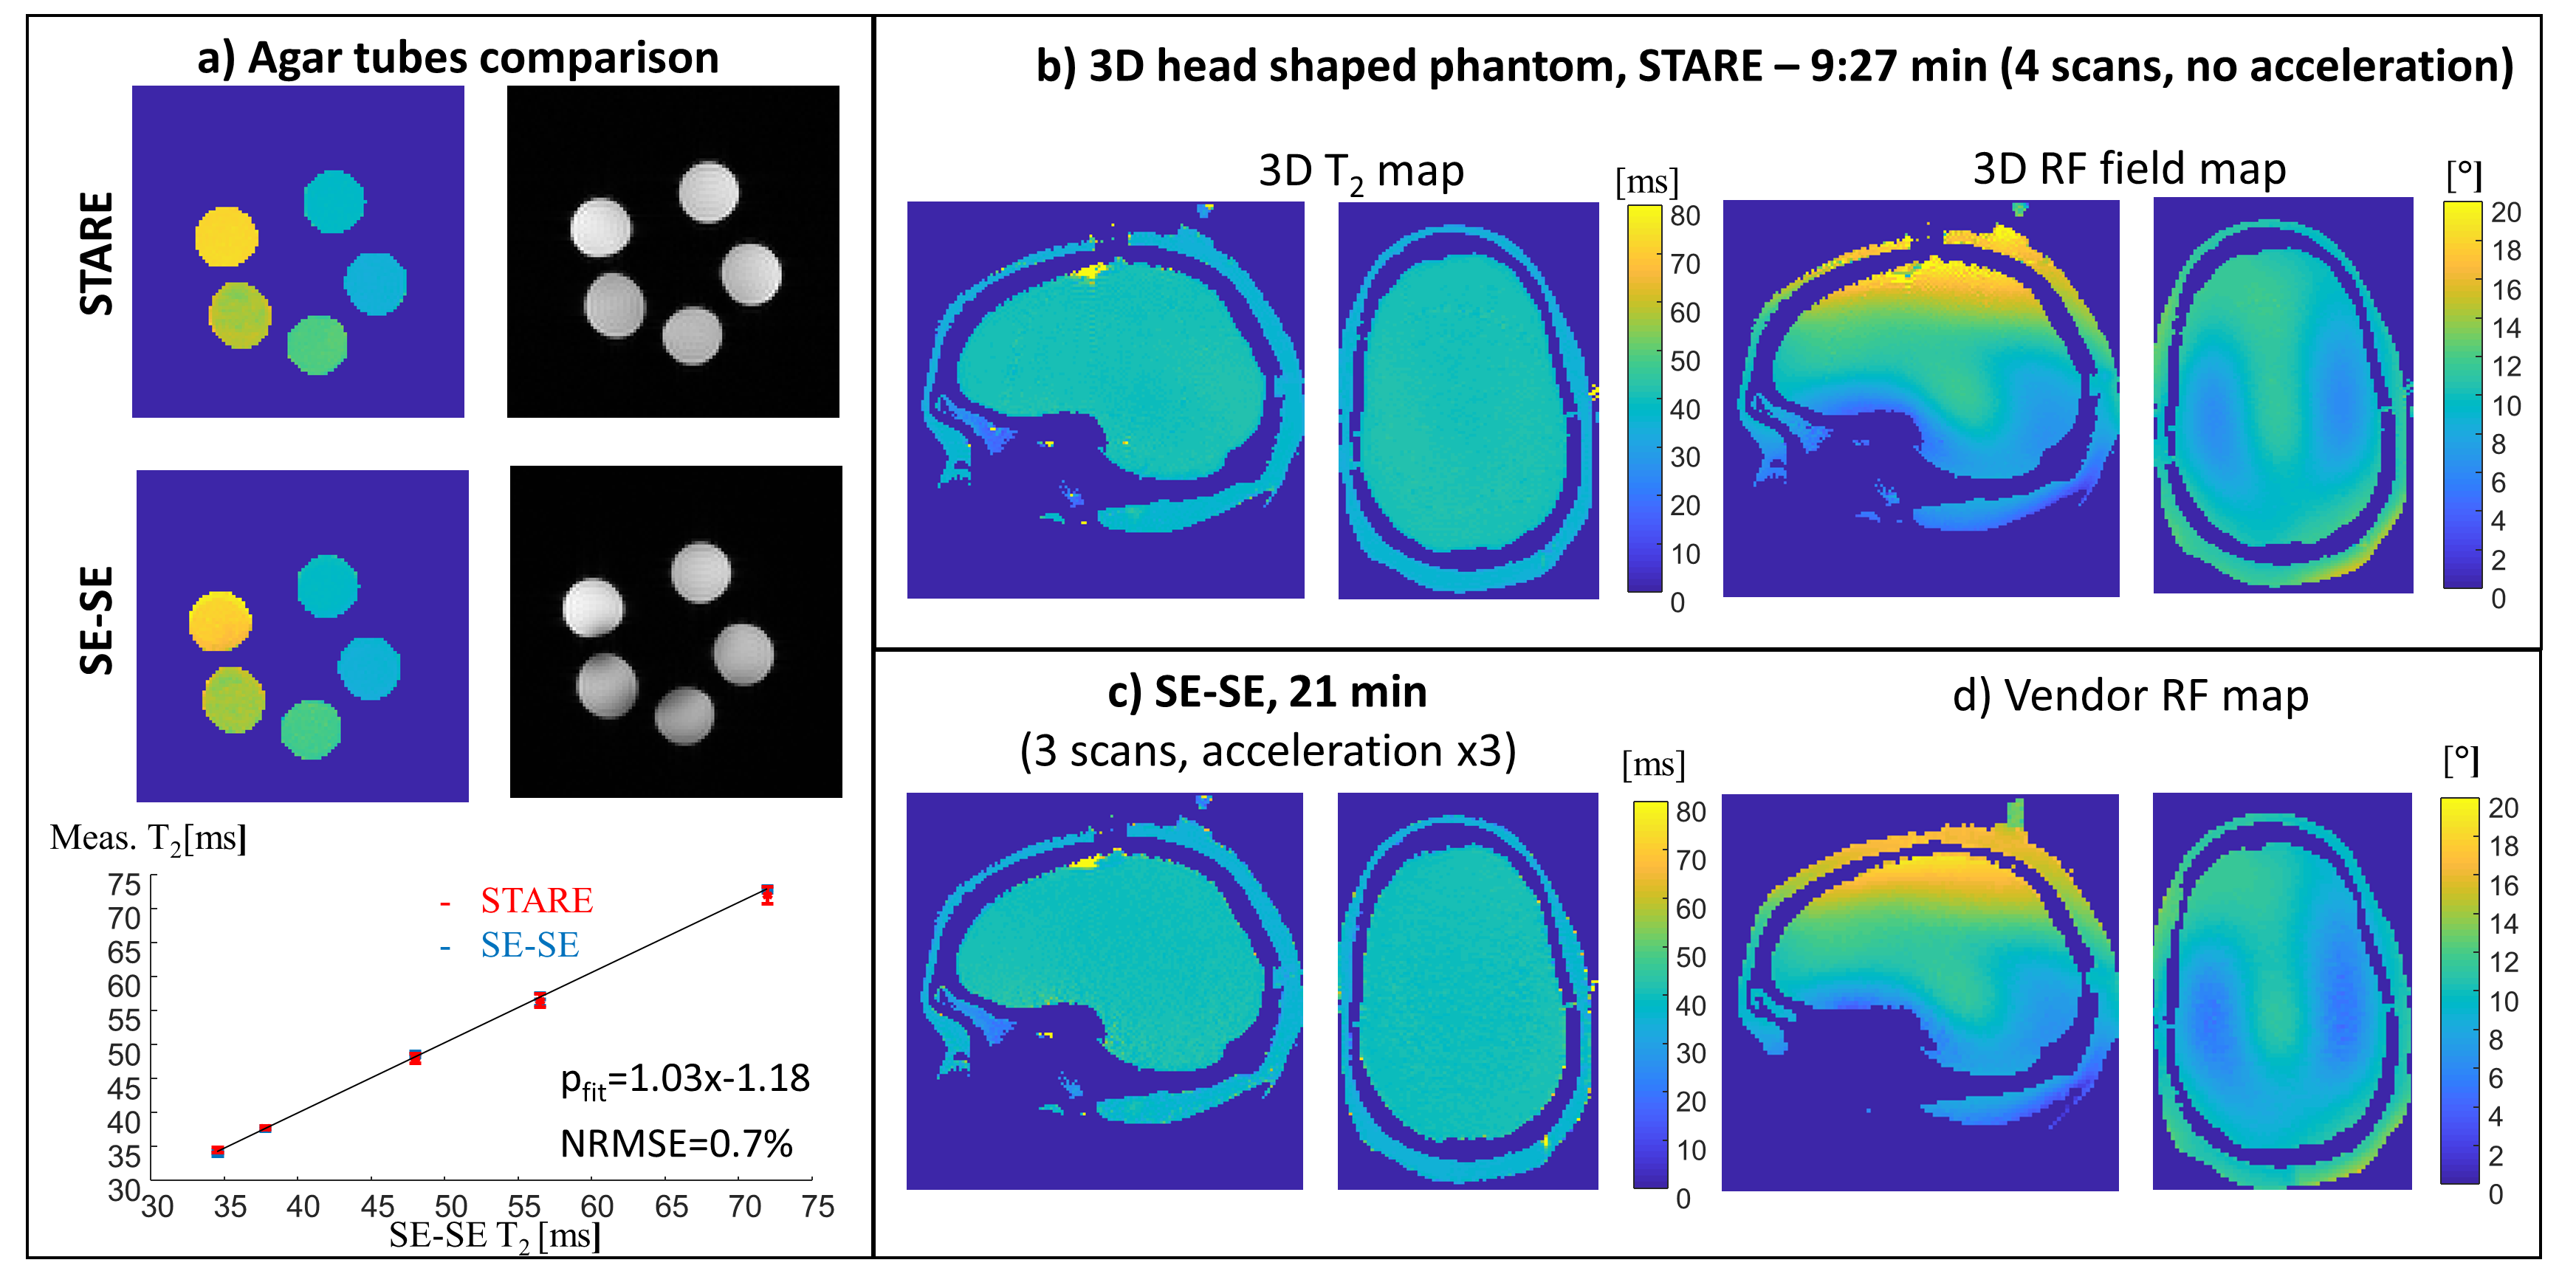
Figure 2: T2 and B1
mapping in phantoms. a) Agar tubes, STARE vs. SE-SE. b) – d) The
head phantom. b) STARE’s T2 and B1 maps, c) SE-SE T2
map, and d) the vendor’s RF map.
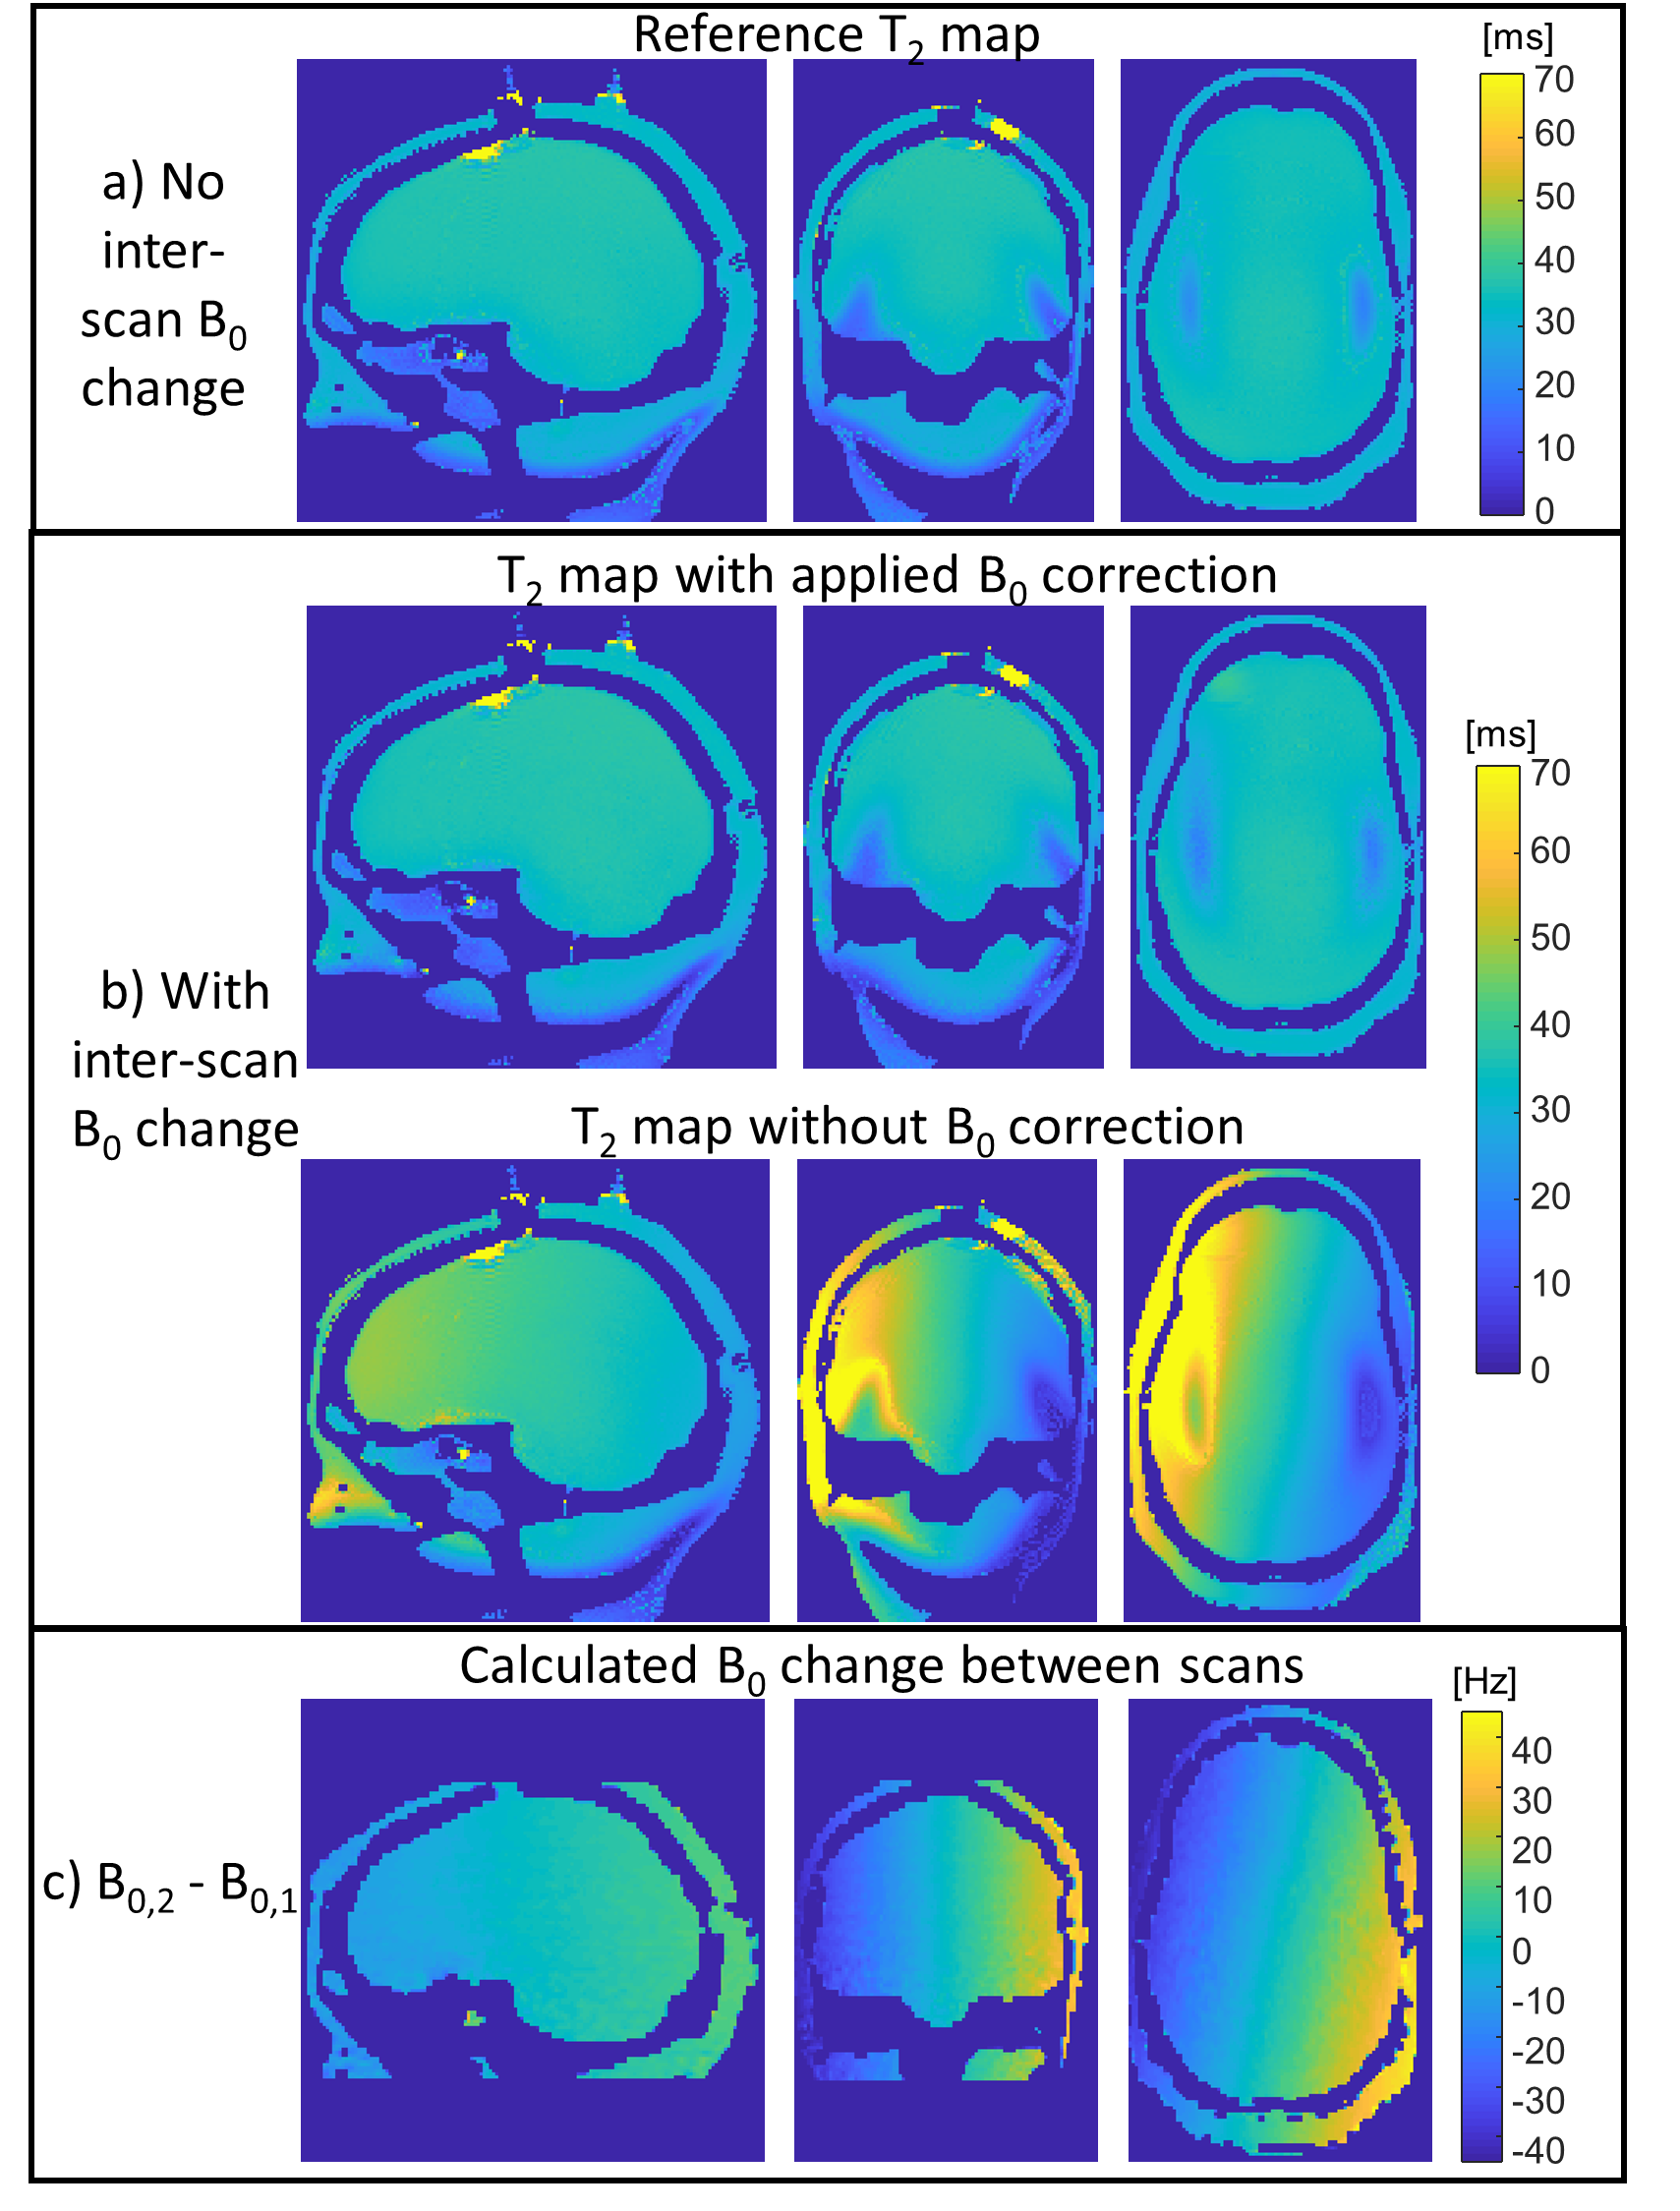
Figure 3: T2
map (three main planes) with and without manually applied inter-scan B0
change. a) Reference T2 map without inter-scan B0
change, b) T2 with and without applied correction based on the B0
maps calculated from the dual echo dataset. c) B0 change in (b) measured
by the dual echo.
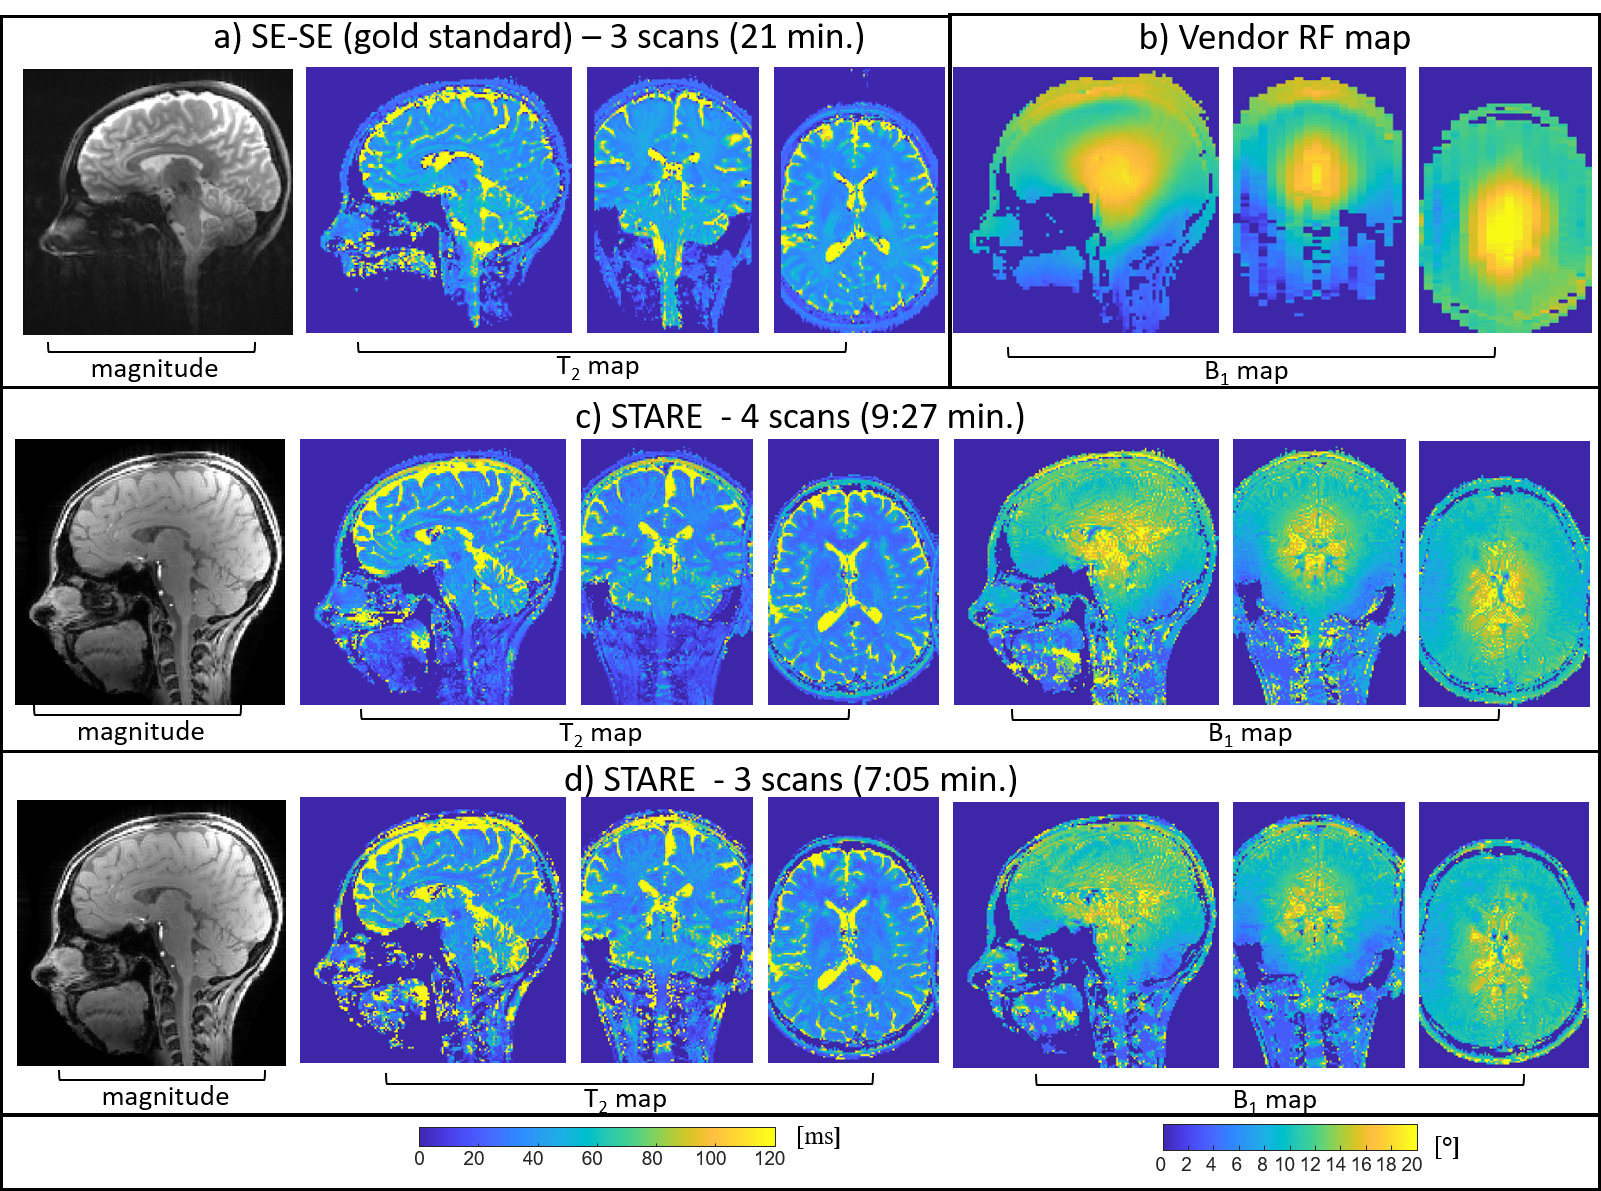
Figure 4: Human imaging – T2 and B1
maps with SE-SE (a), vendor RF map (b), STARE with four and three scans (c,d). STARE
parameters: FOV 220x220x144 mm3, 1.5mm iso, TR/TE1/TE2 10/2.1/5 ms, αscan1=15°, αscan2=25°, four-scans 9:27min., three-scans –7:06min.. SE-SE
parameters: FOV 220x220x132mm3, TR 6500ms, three-scans 21:12 min.
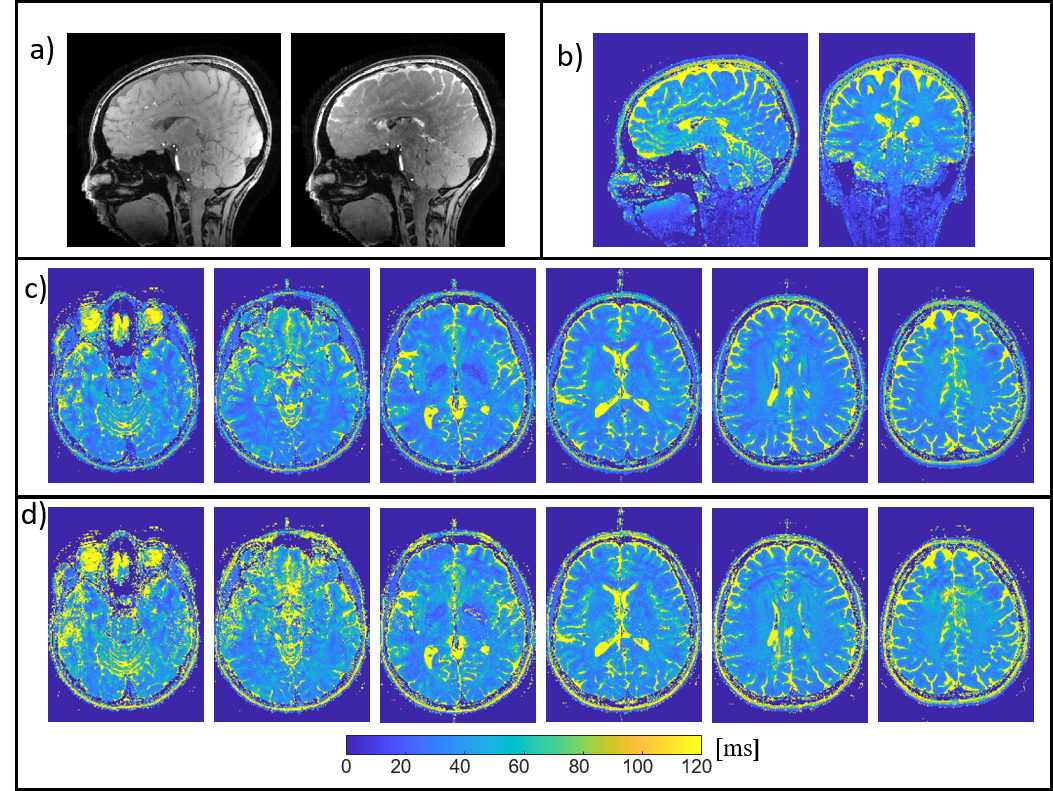
Figure 5: Human STARE T2 maps with
1mm iso. a) |S1|, |S2| - Sagittal plane, b) T2
– Sagittal and Coronal plane, c,d) T2 5 transversal slices every 10
mm with 4-scans in c) and 3-scans in d). Scan parameters FOV 220x220x160-mm3,
TR/TE1/TE2-10/2.7/5.5 ms, αscan1=15°,
αscan2=25°, duration of 4-scans 4:36min. and 3-scans 3:27 min.
DOI: https://doi.org/10.58530/2022/0622