0621
Bias-free T1 Mapping via Simultaneously Estimating Bloch-Siegert and Magnetization Transfer Effects1Radiology, Massachusetts General Hospital, Harvard Medical School, Boston, MA, United States
Synopsis
T1 maps obtained using fast steady-state sequences are usually sensitive to B1+ inhomogeneity and MT effects. We propose a novel method to achieve simultaneously B1+- and MT-corrected T1 quantification by introducing off-resonance RF pulses that create two effects: 1) direct saturation of macromolecules and 2) B1+ dependent Bloch-Siegert phase shift. This method, termed BTS (Bloch-Siegert and magnetization transfer simultaneously), is presented and validated in both simulations and experiments, correcting for T1 bias induced from B1+ inhomogeneity and MT effects.
Introduction
Spin-lattice relaxation time (T1) has important clinical relevance in neural1,2, cardiac3, body4 and musculoskeletal5 diseases. While T1 measurements can be obtained using fast mapping techniques such as variable flip-angle (vFA)6, those values are typically biased due to multiple factors. Magnetization transfer (MT) effect characterized by the magnetization exchange between free water proton and macromolecular content is found to be a major confounding factor for biasing T1 quantification in macromolecule-enriched tissues7,8. In addition, transmit B1+ field inhomogeneity can significantly influence T1 quantification, which typically requires additional separate measurements for correction9. In this work, we introduce a novel method that generates bias-free T1 measurements by compensating MT effects and B1+ inhomogeneity simultaneously through incorporating a RF pulse to model MT and Bloch-Siegert effects.Theory
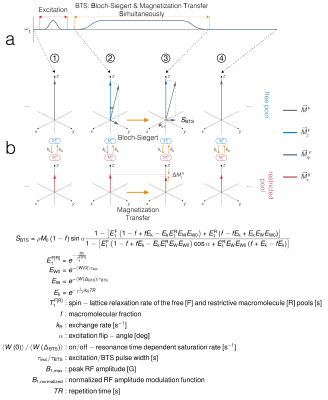
Our method is built on the RF spoiled gradient-echo scheme where we introduce an additional off-resonance irradiation between the excitation RF and the image acquisition module. By adding this off-resonance RF pulse (FIG 1A), two independent effects are induced: 1) MT through direct saturation of macromolecules and 2) B1+ dependent Bloch-Siegert phase shift10 of free water protons. An analytical signal equation shown in FIG 1B can be obtained by solving the Bloch-McConnell equations in the steady-state using a binary spin-bath system (FIG 1B) when the off-resonance irradiation frequency is significantly larger than its peak amplitude and Larmor frequency (𝜔off ≫ 𝜔1max, 𝜔o). The magnitude and phase terms can be used to characterize MT effects due to off-resonance irradiation and MT-free B1+ dependent Bloch-Siegert phase shift, respectively. The B1+ map, bias-free T1 map (T1F), and two additional MT parameter maps (macromolecule bound-pool fraction f and exchange rate kR) can be quantified using signal acquired from a vFA scheme with (BTS) and without (baseline) off-resonance irradiation.Methods
We performed Monte Carlo simulations and phantom experiments to validate our BTS method. Monte Carlo simulations: BTS signal was simulated using the Bloch-McConnell equations to validate the accuracy of the BTS equation (FIG 1B). The simulation used the following parameters including ground truth spin parameters: T1F = 0.757s, f = 0.14, kR= 28.34s-1, sequence parameters: TE = 10ms, TR = 11ms, excitation flip-angles 1-120° (with and without off-resonance irradiation), and an 8ms fermi pulse with off-resonance frequency 4000Hz and flip-angle 629°. A total of 50,000 BTS signals were generated at SNR = 50 with a 20% increase in B1+ homogeneity. To estimate the parameters using a vFA scheme, 4 excitation flip-angles were sampled (5°, 10°, 20°, 40°) and the phase term of BTS signal was used to extract B1+, which was then used to compensate the magnitude term of the BTS equation. The Nelder-Mead downhill simplex algorithm was used to fit parameters T1F, f and kR to this compensated magnitude term assuming MT properties T1R = 1s, T2R = 12μs and a Gaussian MT saturation line shape11. Phantom experiments: Scans were carried out on a 3T scanner (Siemens Biograph mMR) using vials filled with 2%, 4%, 8% Agar and boiled egg white, immersed in a DI water bath doped with 0.08mmol/L Gd. The imaging parameters used were: TE = 14ms, TR = 80ms, prescribed flip-angles 5°, 10°, 20°, 40° (with and without off-resonance irradiation), identical fermi pulse but at flip-angle 786°, and an additional off-resonance irradiation using -4000Hz off-resonance at flip-angle 10° to remove any B0 inhomogeneity and chemical shift dependence on the signal phase.Results and Discussion
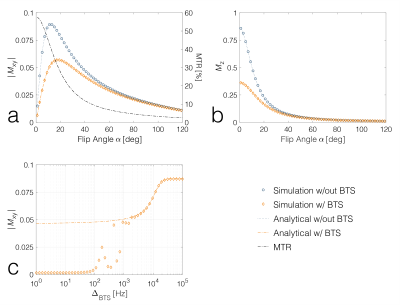
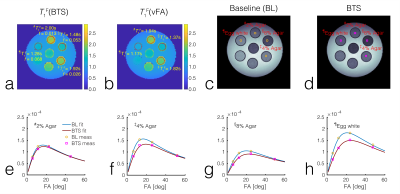
In the regime 𝜔off ≫ 𝜔1max, the BTS signal equation shows excellent agreement with simulation results (FIG 2 A and B). When 𝜔off approaches 𝜔1max, the equation is no longer valid (FIG 2C). B1+ and binary spin-bath system parameters extracted from Monte Carlo simulations are presented in FIG 3. Measured B1+ agrees well with simulations (FIG 3B), demonstrating that the B1+ dependent phase shift is independent of MT effects. FIG 3A shows T1F values extracted using the standard vFA approach and our approach. When MT effects are not considered, the standard vFA approach biases the T1F estimation by 14%, whereas our approach estimates T1F with only 0.3% bias. f and kR were within 5 and 18% of ground truth, respectively. Phantom results further confirm the bias of T1F when MT effects are not considered in standard vFA approach. Comparing T1F values calculated from BTS (FIG 4A) and standard vFA (FIG 4B) shows that the degree of bias correlates with macromolecular fraction (#2% Agar: 2.9%, ‡4% Agar: 5.3%, §8% Agar: 7.7%, ¶Egg white: 9.1%). Comparing baseline (FIG 4C) and BTS (FIG 4D) images, contrast due to MT is apparent with greater contrast in areas with greater macromolecular fraction. Both baseline and BTS fit curves agree well with measurements, as seen in FIG 4E-H, sampled from pixels indicated in FIG 4C and D.Conclusion
A new method of inducing B1+ dependent phase and MT effects simultaneously (BTS) has been introduced. An analytical signal equation was derived and validated, and Monte Carlo simulations were carried out. Phantom experiments demonstrated that in traditional methods, T1 bias due to MT increases with increased macromolecular fraction, whereas BTS is independent of these effects. Thus, BTS provides a way of measuring T1 that compensates for B1+ inhomogeneity and at the same time, removes bias due to MT effects.Acknowledgements
P41 EB022544, T32 EB013180
References
1. Vymazal J, Righini A, Brooks RA, Canesi M, Mariani C, Leonardi M, Pezzoli G. T1 and T2 in the brain of healthy subjects, patients with Parkinson disease, and patients with multiple system atrophy: relation to iron content. Radiology 1999;211:489–495.
2. Larsson HB, Frederiksen J, Petersen J, Nordenbo A, Zeeberg I, Henriksen O, Olesen J. Assessment of demyelination, edema, and gliosis by in vivo determination of T1 and T2 in the brain of patients with acute attack of multiple sclerosis. Magn Reson Med 1989;11:337–348.
3. Messroghli DR, Niendorf T, Schulz-Menger J, Dietz R, Friedrich MG. T1 mapping in patients with acute myocardial infarction. J Cardiovasc Magn Reson 2003;5(2):353-9.
4. Luetkens JA, Klein S, Träber F, Schmeel FC, Sprinkart AM, Kuetting DLR, Block W, Uschner FE, Schierwagen R, Hittatiya K, Kristiansen G, Gieseke J, Schild HH, Trebicka J, Kukuk GM. Quantification of Liver Fibrosis at T1 and T2 Mapping with Extracellular Volume Fraction MRI: Preclinical Results. Radiology 2018;288(3):748-754.
5. Mittal S, Pradhan G, Singh S, Batra R. T1 and T2 mapping of articular cartilage and menisci in early osteoarthritis of the knee using 3-Tesla magnetic resonance imaging. Pol J Radiol 2019;84:e549-e564.
6. Christensen KA, Grand DM, Schulman EM, Walling C. Optimal determination of relaxation times of Fourier transform nuclear magnetic resonance. Determination of spin-lattice relaxation times in chemically polarized species. J Phys Chem 1974;78:1971–1977.
7. Ehses P, Seiberlich N, Ma D, Breuer FA, Jakob PM, Griswold MA, Gulani V. IR TrueFISP with a golden-ratio-based radial readout: fast quantification of T1, T2, and proton density. Magn Reson Med 2013;69:71–81.
8. Robson MD, Piechnik SK, Tunnicliffe EM, Neubauer S. T1 measurements in the human myocardium: The effects of magnetization transfer on the SASHA and MOLLI sequences. Magn Reson Med 2013;670(3):664-670.
9. Deoni SC. High-resolution T1 mapping of the brain at 3T with driven equilibrium single pulse observation of T1 with high-speed incorporation of RF field inhomogeneities (DESPOT1-HIFI). J Magn Reson Imaging 2007;26:1106–1111.
10. Sacolick LI, Wiesinger F, Hancu I, Vogel MW. B1 mapping by Bloch–Siegert shift. Magn Reson Med 2010;63:1315–1322.
11. Henkelman RM, Huang X, Xiang Q-S, Stanisz GJ, Swanson SD. Quantitative interpretation of magnetization transfer. Magn Reson Med 1993;29:759–766.
Figures


