0620
DCE-MRI with free-breathing compressed sensing VIBE for predicting chemotherapy response and patient outcome in pancreatic adenocarcinoma1Kagoshima University Graduate School of Medical and Dental Sciences, Kagoshima, Japan, 2MR Application Predevelopment, Siemens Healthcare GmbH, Erlangen, Germany, 3Siemens Healthcare K.K., Tokyo, Japan
Synopsis
This study focused on the feasibility of dynamic contrast-enhanced MRI (DCE-MRI) with motion-resolved compressed sensing T1-weighted volumetric interpolated breath-hold examination (CS-VIBE) for prediction of treatment response to chemotherapy and patient outcome in pancreatic ductal adenocarcinoma (PDAC). Our results showed tumor ve was significantly higher in the response group than in the non-response group and was an independent predictor of progression-free survival in patients with PDAC treated with chemotherapy. These results suggest that DCE-MRI obtained with CS-VIBE may be useful for predicting treatment response to chemotherapy and patient outcome in PDAC.
INTRODUCTION
Recently, a prototype of the T1-weighted volumetric interpolated breath-hold examination (VIBE) sequence has been developed, which supports motion-resolved compressed sensing (CS-VIBE) and free-breathing acquisitions. However, the feasibility of a free-breathing motion-resolved CS-VIBE for dynamic contrast-enhanced MRI (DCE-MRI) in the prediction of treatment response to chemotherapy and patient outcome in PDAC has not been elucidated.PURPOSE
The purpose of this study was to assess the feasibility of DCE-MRI with free-breathing motion-resolved CS-VIBE for predicting treatment response to chemotherapy and patient outcome in PDAC.METHODS
Sixty-eight patients with PDAC (mean size, 29.9 mm; size range, 10–101 mm) underwent Gd-EOB-DTPA-enhanced MRI before first-line gemcitabine-based chemotherapy. DCE-MRI using a prototype sequence of free-breathing motion-resolved CS-VIBE was obtained during free-breathing over 5 min, from the initiation of the intravenous contrast material injection. The imaging parameters were as follows: repetition time, 3.9 ms; echo time, 1.4 ms; flip angle, 12°; matrix size, 151 x 288; slice thickness, 2.5 mm; FOV, 360 mm; slice number, 88; compressed sensing factor, 6; temporal resolution, 10 s; and acquisition time, 330 s. After the third phase of dynamic scan, a bolus of 0.025 mmoL/kg body weight of Gd-EOB-DTPA was intravenously administered at a flow rate of 2 mL/s, followed by a 20-mL saline solution flush at the same rate using an MR-compatible power injector. Unenhanced T1-weighted VIBE images with flip angles of 2° and 12° were also acquired for T1 mapping. Voxel wise pharmacokinetic parameter maps of the volume transfer coefficient (Ktrans), rate constant (kep), extracellular extravascular volume fraction (ve), and initial area under the concentration curve in 60 s (iAUC) were generated by using a dedicated postprocessing software program for DCE-MRI (Figure 1). First, motion correction of subframe CS-VIBE images was performed by using the non-rigid registration technique. The motion-corrected images were then registered to the T1 map. Signal intensity was then converted to gadolinium concentration, and the time–concentration curve was calculated. Perfusion evaluation was based on the Tofts model, while the arterial input function was chosen according to the intermediate sampling method.Tumor response after the third cycle of gemcitabine-based chemotherapy was assigned as the response (CR and PR) or non-response groups (SD and PD). Receiver operating characteristic (ROC) curve analyses were used to assess the diagnostic performance for differentiation between the response and non-response groups that was determined by calculating the area under the ROC curve (AUC). The effects of clinical prognostic factors and DCE-MRI-derived parameters on progression-free survival (PFS) were assessed by univariate and multivariate analyses using Cox proportional hazards models.
RESULTS
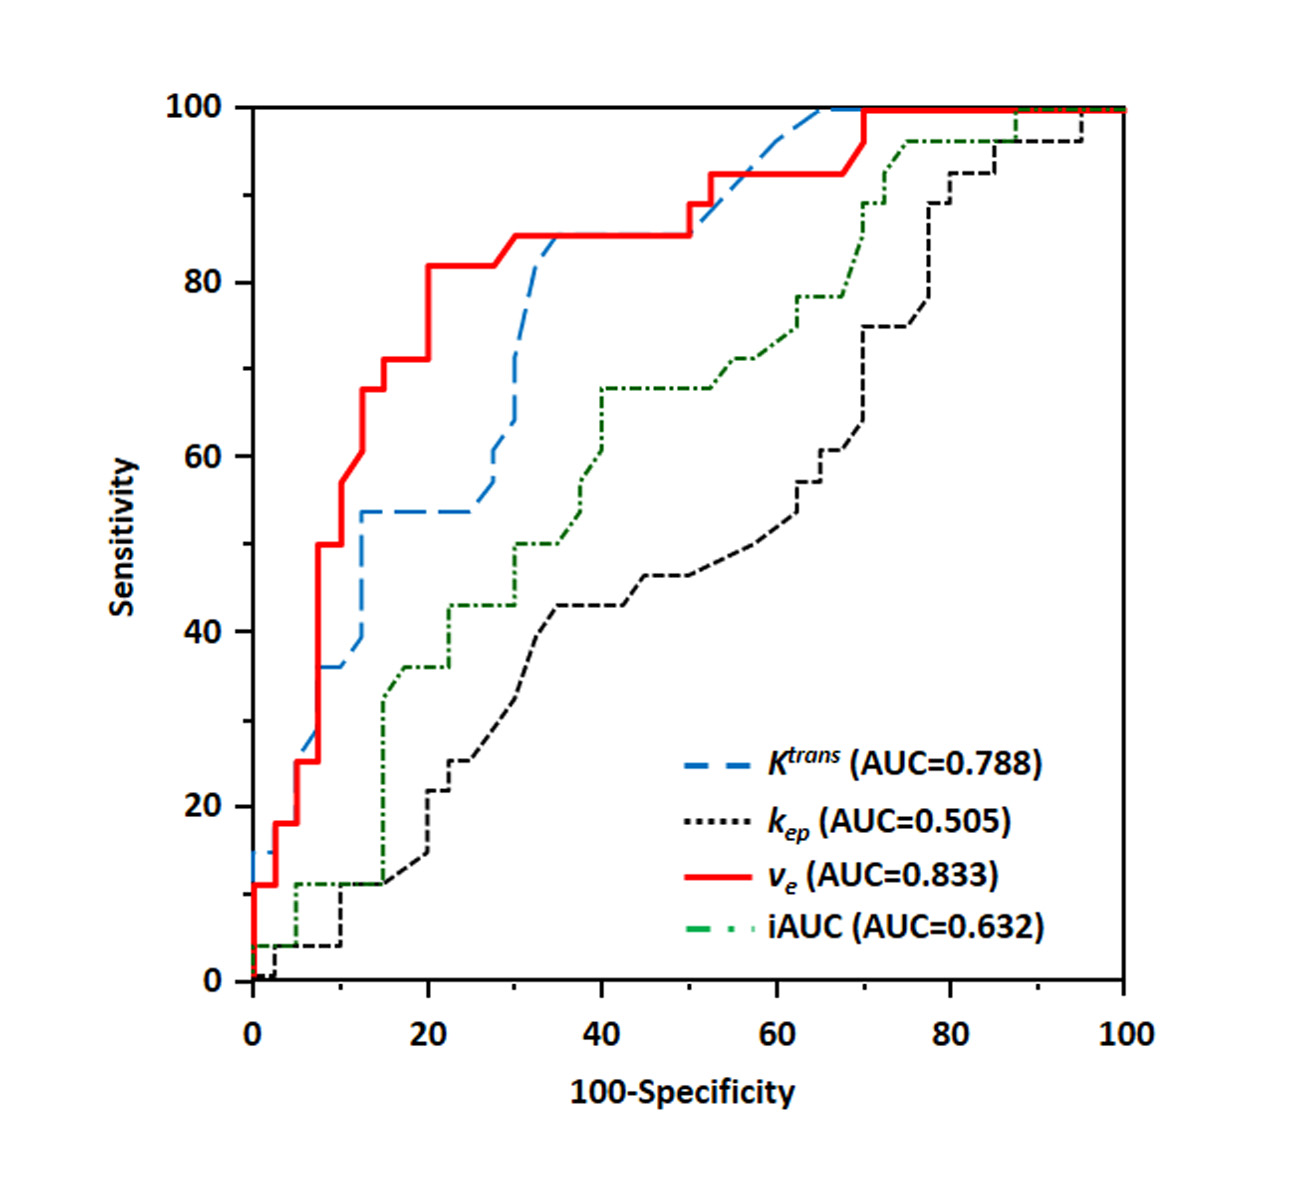
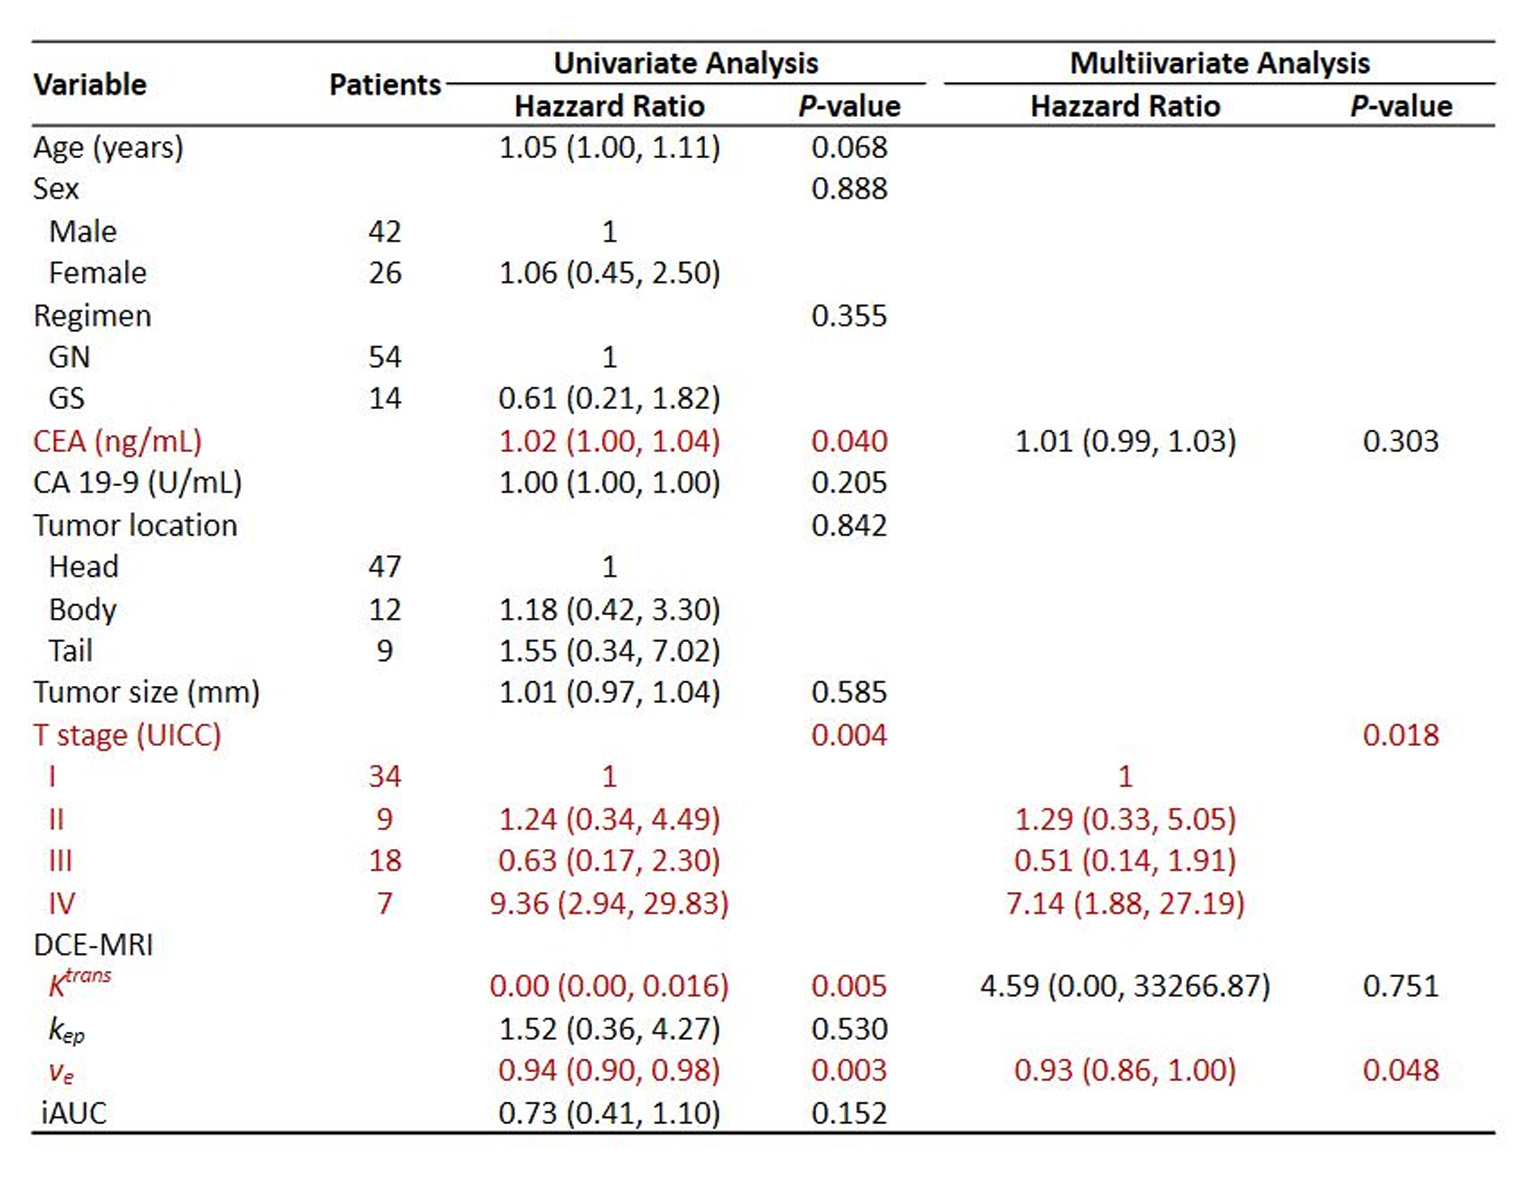
The mean tumor Ktrans, kep, ve, and iAUC of DCE-MRI were 0.18 ± 0.12 min-1, 0.76 ± 0.83 min-1, 26.2 ± 13.8%, and 0.83 ± 1.03, respectively. The ROC curve analyses to differentiate between the response and non-response groups showed significances for Ktrans and ve (AUC = 0.788 and 0.833, respectively) (Figure 2).The median PFS was 16.5 months. On univariate analysis, elevated serum CEA level (P = 0.040) and higher TNM stage (P = 0.004) were significant. Increasing tumor Ktrans (P = 0.005) and ve (P = 0.003) were associated with a positive effect on PFS. On the multivariate analysis, higher TNM stage (P = 0.018) and lower tumor ve (P = 0.048) showed independent predictors of poor PFS in patients with PDAC treated with first-line chemotherapy (Figure 3).
DISCUSSION
Dynamic contrast-enhanced imaging such as perfusion CT and DCE-MRI allows for quantitative estimation of various pharmacokinetic parameters such as Ktrans, kep, ve, and iAUC. Our results of DCE-MRI-derived parameters were similar to those of previous reports.1-3 Therefore, DCE-MRI obtained with a free-breathing motion-resolved CS-VIBE may be feasible for the assessment of PDACs.Previous studies demonstrated the value of the Ktrans in predicting the response of PDACs to chemotherapy,4 gemcitabine-based chemoradiation therapy,5 or antiangiogenic therapy.6 In our study, higher tumor Ktrans was significantly associated with the response group, which is consistent with previous reports.4,5
Tumors with high ve have been shown to exhibit a higher uptake of anticancer drugs as compared with low ve tumors.7,8 The ve can reportedly predict the response to chemotherapy or prognosis in patients with various cancers,9-12 although no previous study has proven the value of ve for predicting treatment response in PDAC after chemotherapy. We found that tumor ve was significantly higher in the response group than in the non-response group and was an independent predictor of PFS in patients with PDAC treated with chemotherapy on multivariate analysis. Therefore, pretreatment ve measurements in PDACs can predict response to gemcitabine-based chemotherapy and prognosis in patients with PDACs.
CONCLUSION
DCE-MRI obtained with a free-breathing motion-resolved CS-VIBE may be feasible for predicting treatment response to chemotherapy and patient outcome in PDAC. This might aid in development of a tailored approach to therapy in PDAC patients.Acknowledgements
No acknowledgement found.References
1. Bali MA, Metens T, Denolin V, et al. Tumoral and nontumoral pancreas: correlation between quantitative dynamic contrast-enhanced MR imaging and histopathologic parameters. Radiology 2011;261:456-466.
2. Ma W, Li N, Zhao W, et al. Apparent diffusion coefficient and dynamic contrast-enhanced magnetic resonance imaging in pancreatic cancer: characteristics and correlation with histopathologic parameters. J Comput Assist Tomogr. 2016;40:709-716.
3. Klaassen R, Gurney-Champion OJ, Wilmink JW, et al. Repeatability and correlations of dynamic contrast enhanced and T2* MRI in patients with advanced pancreatic ductal adenocarcinoma. Magn Reson Imaging. 2018;50:1-9.
4. Kim H, Morgan DE, Schexnailder P, et al. Accurate therapeutic response assessment of pancreatic ductal adenocarcinoma using quantitative dynamic contrast-enhanced magnetic resonance imaging with a point-of-care perfusion phantom: a pilot study. Invest Radiol. 2019;54:16-22.
5. Park MS, Klotz E, Kim KJ, et al. Perfusion CT: noninvasive surrogate marker for stratification of pancreatic cancer response to concurrent chemo- and radiation therapy. Radiology 2009;250:110-117. 6. Akisik MF, Sandrasegaran K, Bu G, et al. Pancreatic cancer: utility of dynamic contrast-enhanced MR imaging in assessment of antiangiogenic therapy. Radiology 2010;256:441-449.
7. Jain RK. Delivery of molecular medicine to solid tumors. Science 1996;271:1079-1080.
8. Krol A, Maresca J, Dewhirst MW, et al. Available volume fraction of macromolecules in the extravascular space of a fibrosarcoma: implications for drug delivery. Cancer Res. 1999;59:4136-4141. 9. Tong T, Sun Y, Gollub MJ, et al. Dynamic contrast-enhanced MRI: use in predicting pathological complete response to neoadjuvant chemoradiation in locally advanced rectal cancer. J Magn Reson Imaging 2015;42:673-680.
10. Ng SH, Lin CY, Chan SC, et al. Clinical utility of multimodality imaging with dynamic contrast-enhanced MRI, diffusion-weighted MRI, and 18F-FDG PET/CT for the prediction of neck control in oropharyngeal or hypopharyngeal squamous cell carcinoma treated with chemoradiation. PloS one 2014;9:e115933.
11. Guo J, Reddick WE, Glass JO, et al. Dynamic contrast-enhanced magnetic resonance imaging as a prognostic factor in predicting event-free and overall survival in pediatric patients with osteosarcoma. Cancer 2012;118:3776-3785.
12. Sala E, Kataoka MY, Priest AN, et al. Advanced ovarian cancer: multiparametric MR imaging demonstrates response- and metastasis-specific effects. Radiology 2012;263:149-159.
Figures
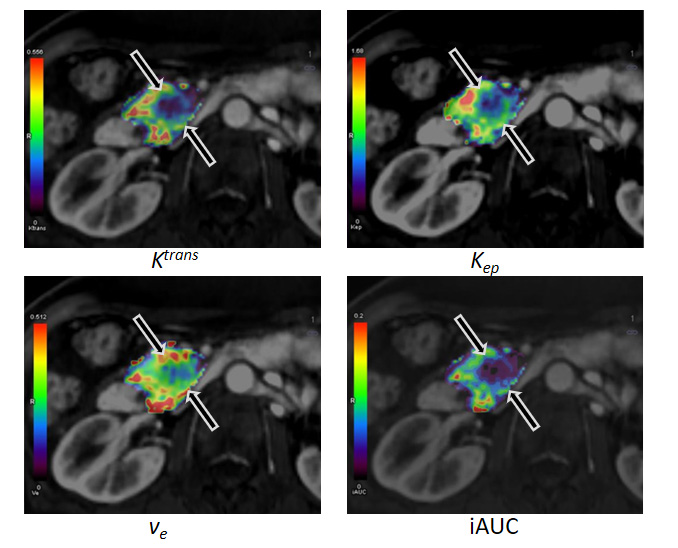
A 68-year-old man with a stable response pancreatic ductal adenocarcinoma after the third cycle of gemcitabine-based chemotherapy.
The mean Ktrans (0.07 min-1), kep (0.41 min-1), ve (17.9%), and iAUC (0.29) demonstrate a focal area of decreased parametric values (arrows), as compared with pancreatic parenchyma.