0618
Changes in Abdominal Organs from the UK Biobank Longitudinal Imaging Study
Brandon Whitcher1, Marjola Thanaj1, Madeleine Cule2, Nicolas Basty1, Elena P. Sorokin2, Jimmy D. Bell1, and E. Louise Thomas1
1Research Centre for Optimal Health, University of Westminster, London, United Kingdom, 2Calico Life Sciences LLC, South San Francisco, CA, United States
1Research Centre for Optimal Health, University of Westminster, London, United Kingdom, 2Calico Life Sciences LLC, South San Francisco, CA, United States
Synopsis
We investigated changes in body composition in 3,088 free-living participants of the UK Biobank imaging study. Statistical models utilised organ and tissue segmentations from the neck-to-knee Dixon acquisitions and multiecho sequences of the liver/pancreas. A significant decrease in grip strength was observed, and small, but statistically significant, decreases in all skeletal muscle measurements. Significant increases in visceral adipose tissue and intermuscular fat in the thighs were also found in the absence of changes in BMI, waist circumference and ectopic-fat deposition. We have shown that even after a relatively short period of time significant changes in body composition are observable.
Introduction
Understanding the relationship between body composition and lifestyle at a population scale have typically been explored in cross-sectional studies, or using relatively simple measurements such as body mass index (BMI), anthropometry and questionnaires [1]. Precise phenotypic measurements of body composition, including multiple organ volumes, subdivisions of adipose tissue and the composition and quality of tissues, has been limited to small studies or few measurements. Long-term cohort studies tracking changes in adipose tissue and ectopic fat such as KORA or Study of Health in Pomerania, have only obtained MRI measurements at a single time point [2,3]. Others such as the Dallas Heart Study [4] undertook longitudinal MRI that included whole-body and liver fat measurements, but this study focused on heart/vessel health and did not make detailed measurements of other abdominal organs.The UK Biobank (UKBB) imaging study, originally designed to be cross-sectional with 100,000 participants, has now expanded to include an additional imaging visit. To date 3,209 participants have undergone two MR imaging visits after approximately a two-year period. Here we describe our initial observations of these data. We generated a total of 27 image derived phenotypes (IDPs) from the MR abdominal protocol and combined these with physiological measures with reference to disease/physiological condition. We undertook exploratory data analysis prior to identifying combinations of IDPs and disease for statistical modelling. We found that the trajectory of longitudinal changes in body-composition IDPs was dependent on the physiological state of the participants.
Methods
Approximately 49K UKBB participants have received baseline MRI scans, with 3,209 having undergone a follow-up imaging visit, as part of a subcohort of 10,000 participants recruited by the Dementia Platform UK study. Participants with imaging data from the abdominal protocol at both time points (N=3,088) were included here.Disease categories of interest including cardiovascular, liver and kidney, type-1 and type-2 diabetes, metabolic and cancer were selected based on their potential influence on body composition and organ health. Menopause was selected as a physiological state likely to influence body composition. If the ICD9 or ICD10 codes for HES data, or self-reported disease codes (UKBB fields), were reported at least once for each participant at the time before the first imaging visit, they were classified as a case.
Full details regarding the UKBB MR abdominal protocol have previously been reported [5]. The data included here focused on the neck-to-knee Dixon MRI acquisition and separate single-slice multiecho MRI acquisitions for the liver and pancreas. All data were analysed using automated methods [6,7]. Proton density fat fraction (PDFF) and R2* were calculated from the PRESCO method [8]. R2* values were converted to iron concentration [9].
Exploratory data analysis identified seven combinations of disease and IDPs. Linear mixed-effects models, with these specific IDP and disease category combinations, were fitted to the data. Fixed effects included in all models were age at the baseline visit, gender, BMI, assessment centre, systolic and diastolic blood pressure, volumes abdominal subcutaneous (ASAT) and visceral adipose tissue (VAT). Additional fixed effects were added depending on the IDP. Participant IDs were included as a random effect. An indicator variable for visit was crossed with disease category to investigate the effect of time on participants in different disease categories. The threshold for statistical significance was adjusted using the Bonferroni method, resulting in a threshold of 0.00028.
Results
Despite some large individual changes in BMI between baseline and follow-up visits (Figure 1), there was no overall change in BMI, body weight or waist circumference (Table 1). The results showed small increases in waist-to-hip ratio and both systolic and diastolic blood pressure. The percentage decrease in grip strength, -2.3% in women and -4.3% in men, in only two years is surprising and may have significant functional impact.The seven combinations of physiological conditions and IDPs are provided in Table 2. We found that chronic diseases did not result in statistically significant changes at the re-imaging time point in any of the IDPs (last four rows of Figure 1). However, T2DM was associated with a reduction in skeletal (p=0.013) and total iliopsoas muscle (p=0.0439) volumes at re-imaging, and a diagnosis of metabolic disorder was associated with a reduction in liver (p=0.0124) and total lung (p=0.0006) volume. Liver disease was linked to a reduction in total kidney volume (p=0.0219). An increase in average liver volume of approximately 15ml (Model 5) was observed for all subjects at the re-imaging time point and achieved statistical significance (p=3.93⨉10-8).
Discussion and Conclusion
Although we observed small differences in some anthropometric measurements and blood pressure across genders, these changes appear too small, in absolute terms, to be of clinical significance [10]. Larger changes in grip strength were observed across the whole cohort, in parallel to a decrease in total skeletal muscle volume and an increase in intramuscular fat infiltration. This suggests that even a relatively short period of time, under standard lifestyle conditions, can have significant repercussions on muscle quality and function, organ morphometry and may be a precursor to subsequent health conditions [11].Acknowledgements
We thank Dr. Amoolya Singh and Dr. Kevin Wright for helpful comments and discussion. This research has been conducted using the UK Biobank Resource under Application Number 44584 and was funded by Calico Life Sciences LLC.References
- Lee DH, Giovannucci EL. Body composition and mortality in the general population: A review of epidemiologic studies. Exp Biol Medicine 2018; 243: 1275-1285.
- Rospleszcz S, et al. Association of longitudinal risk profile trajectory clusters with adipose tissue depots measured by magnetic resonance imaging. Sci Reports 2019; 9: 16972.
- Volzke H, Alte D, Schmidt CO, et al. Cohort profile: The study of health in Pomerania. Int J Epidemiol 2010; 40: 294-307.
- Victor RG, Haley RW, Willett DL, et al. The Dallas Heart Study: a population-based probability sample for the multidisciplinary study of ethnic differences in cardiovascular health. The Am J Cardiol 2004; 93: 1473-1480.
- Littlejohns TJ, Holliday J, Gibson LM, et al. The UK Biobank imaging enhancement of 100,000 participants: rationale, data collection, management and future directions. Nat Commun 2020; 11(1): 1-12.
- Basty N, Liu Y, Cule M, et al. Automated measurement of pancreatic fat and iron concentration using multi-echo and T1-weighted MRI data. In IEEE 17th International Symposium on Biomedical Imaging (ISBI) 2020.
- Liu Y, Basty N, Whitcher B, et al. Genetic architecture of 11 organ traits derived from abdominal MRI using deep learning. eLife 2021; 10: 65554.
- Bydder M, et al. Constraints in estimating the proton density fat fraction. Magn Reson Imaging 2020; 66: 1-18.
- McKay A, Wilman H, Dennis A, et al. Measurement of liver iron by magnetic resonance imaging in the UK Biobank population. PLOS ONE 2018; 13: e0209340.
- Pinto E. Blood pressure and ageing. Postgrad Med J 2007; 83: 109-114.
- Reeve TE, Ur R, Craven TE, et al. Grip strength measurement for frailty assessment in patients with vascular disease and associations with comorbidity, cardiac risk, and sarcopenia. J Vasc Surg 2018; 67: 1512-1520.
Figures
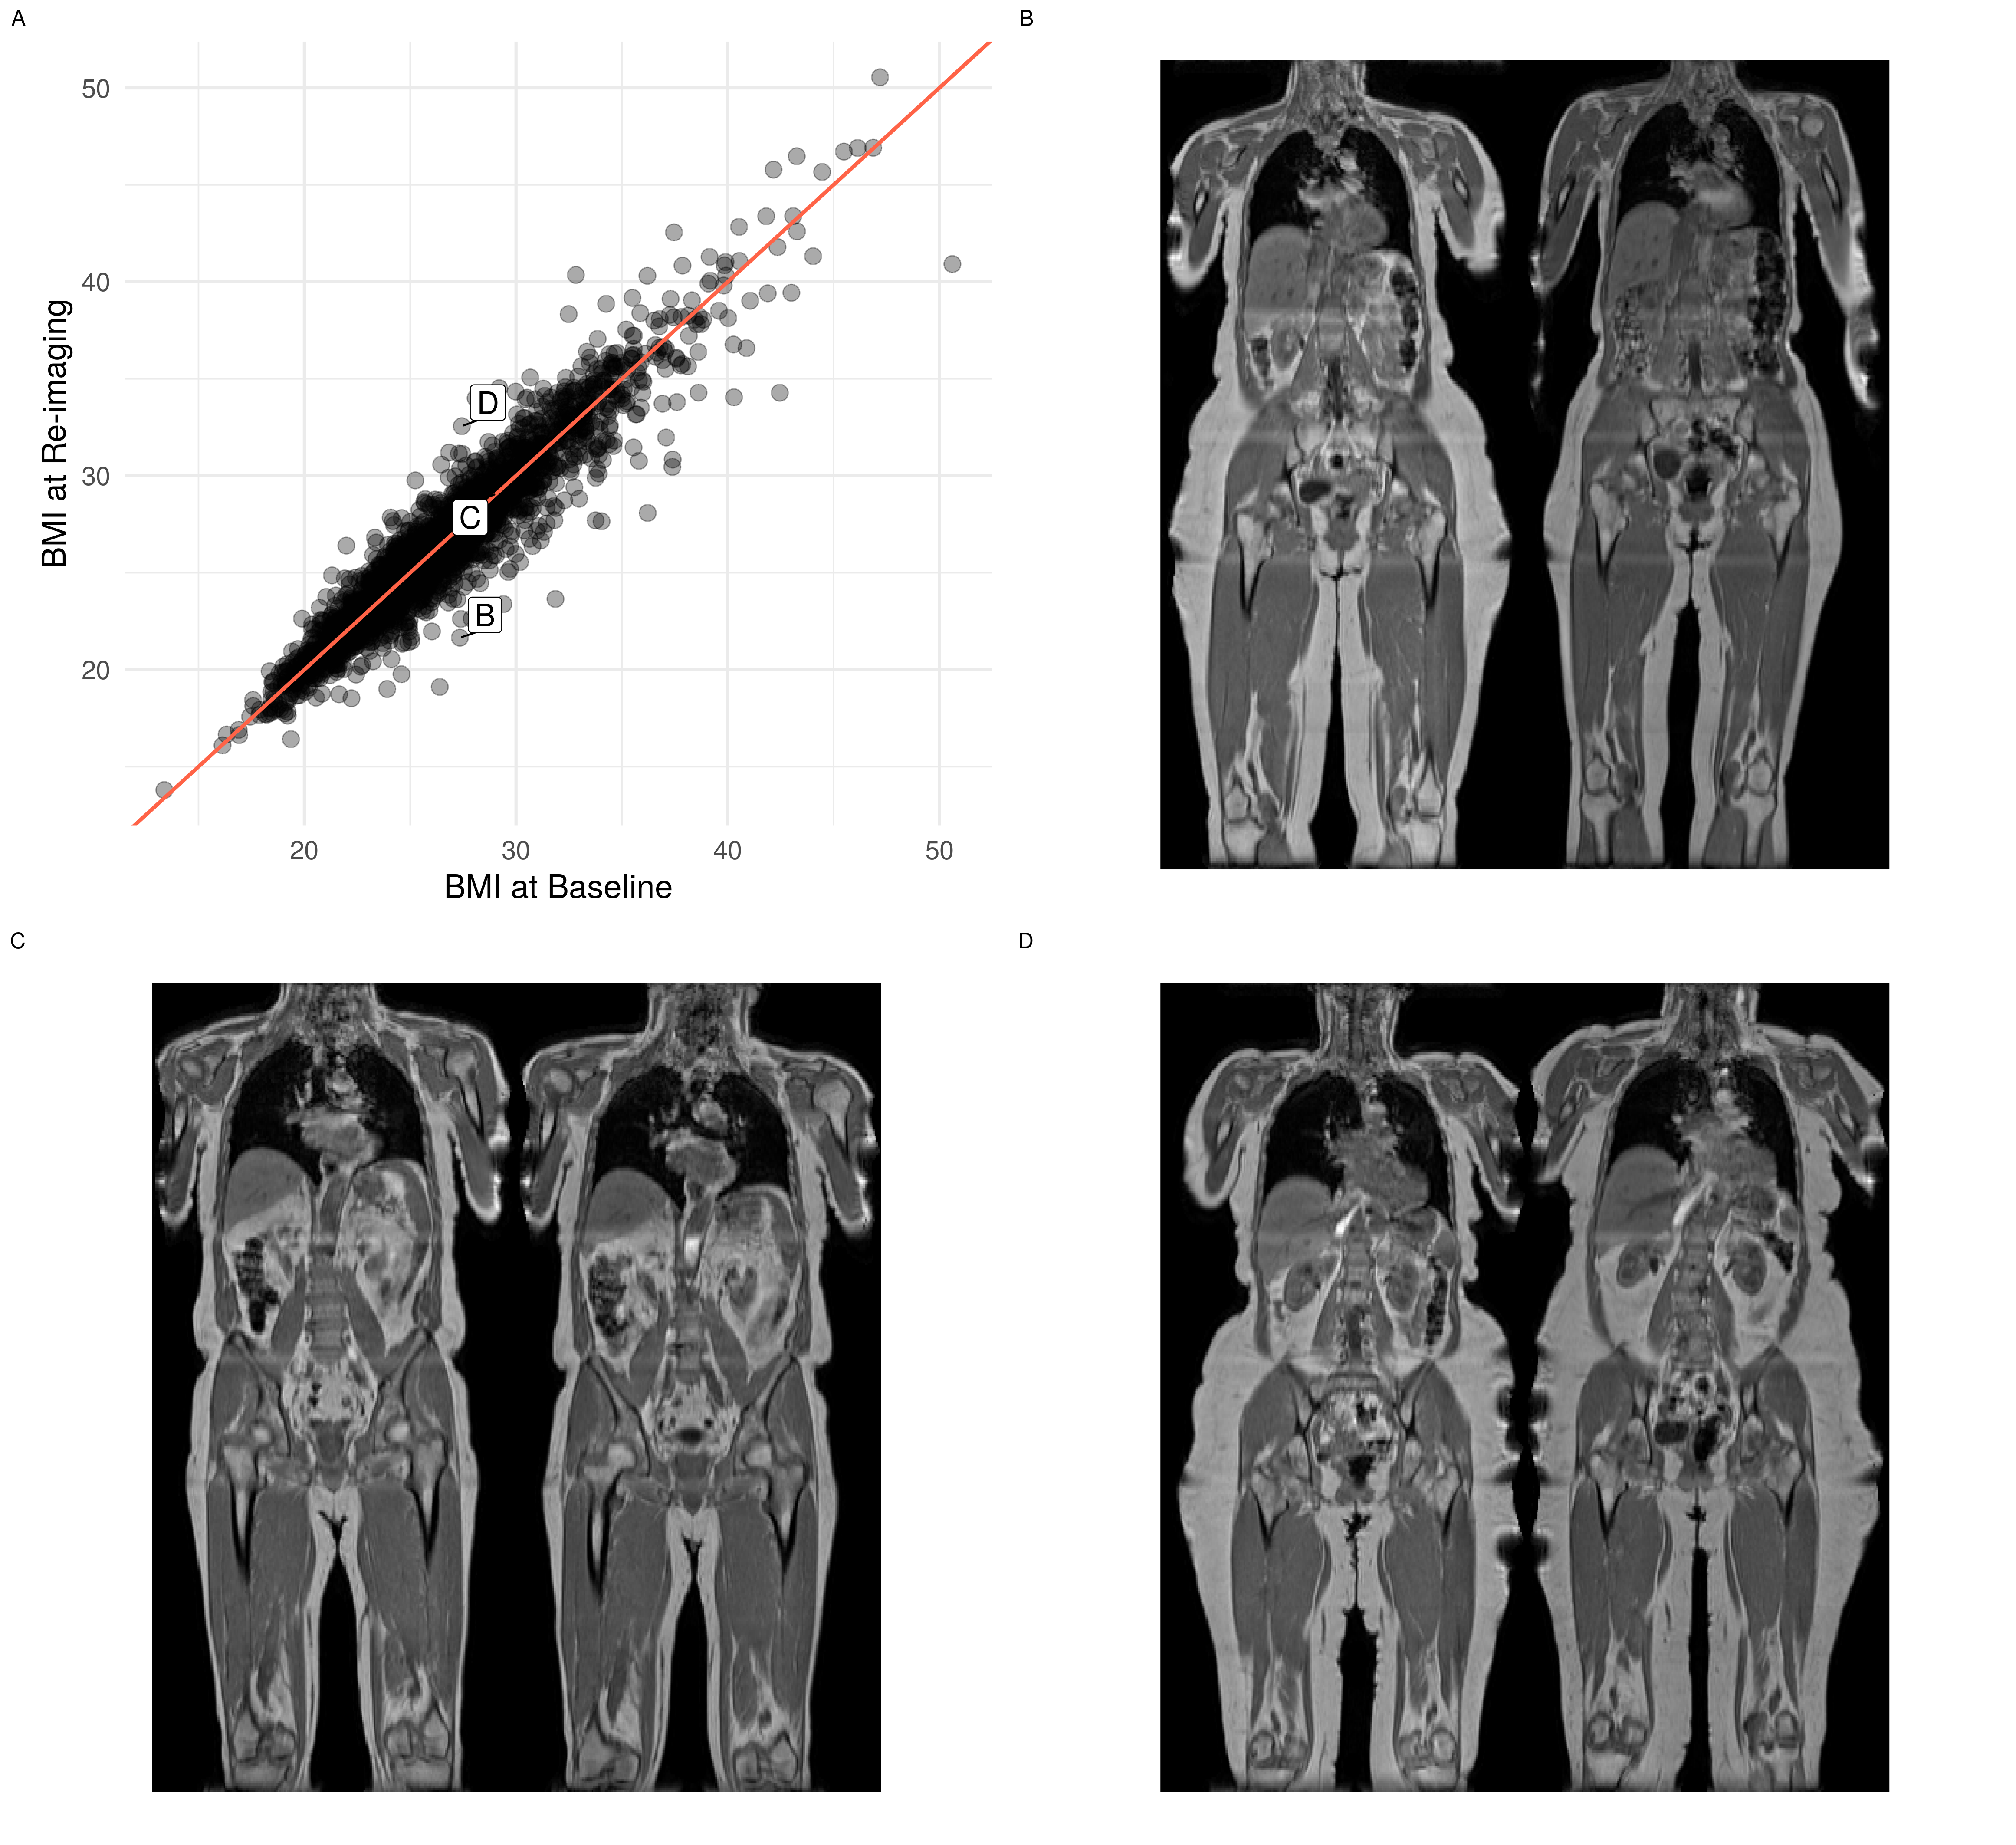
Figure 1. Change in BMI between the baseline and re-imaging visits. (A) scatterplot of BMI values for all participants, (B) coronal view of participant whose BMI decreased by 5.7 kg/m2 from baseline (left panel) to re-imaging (right panel), (C) coronal view of participant whose BMI did not change and (D) coronal view of participant whose BMI increased by 5.1 kg/m2.
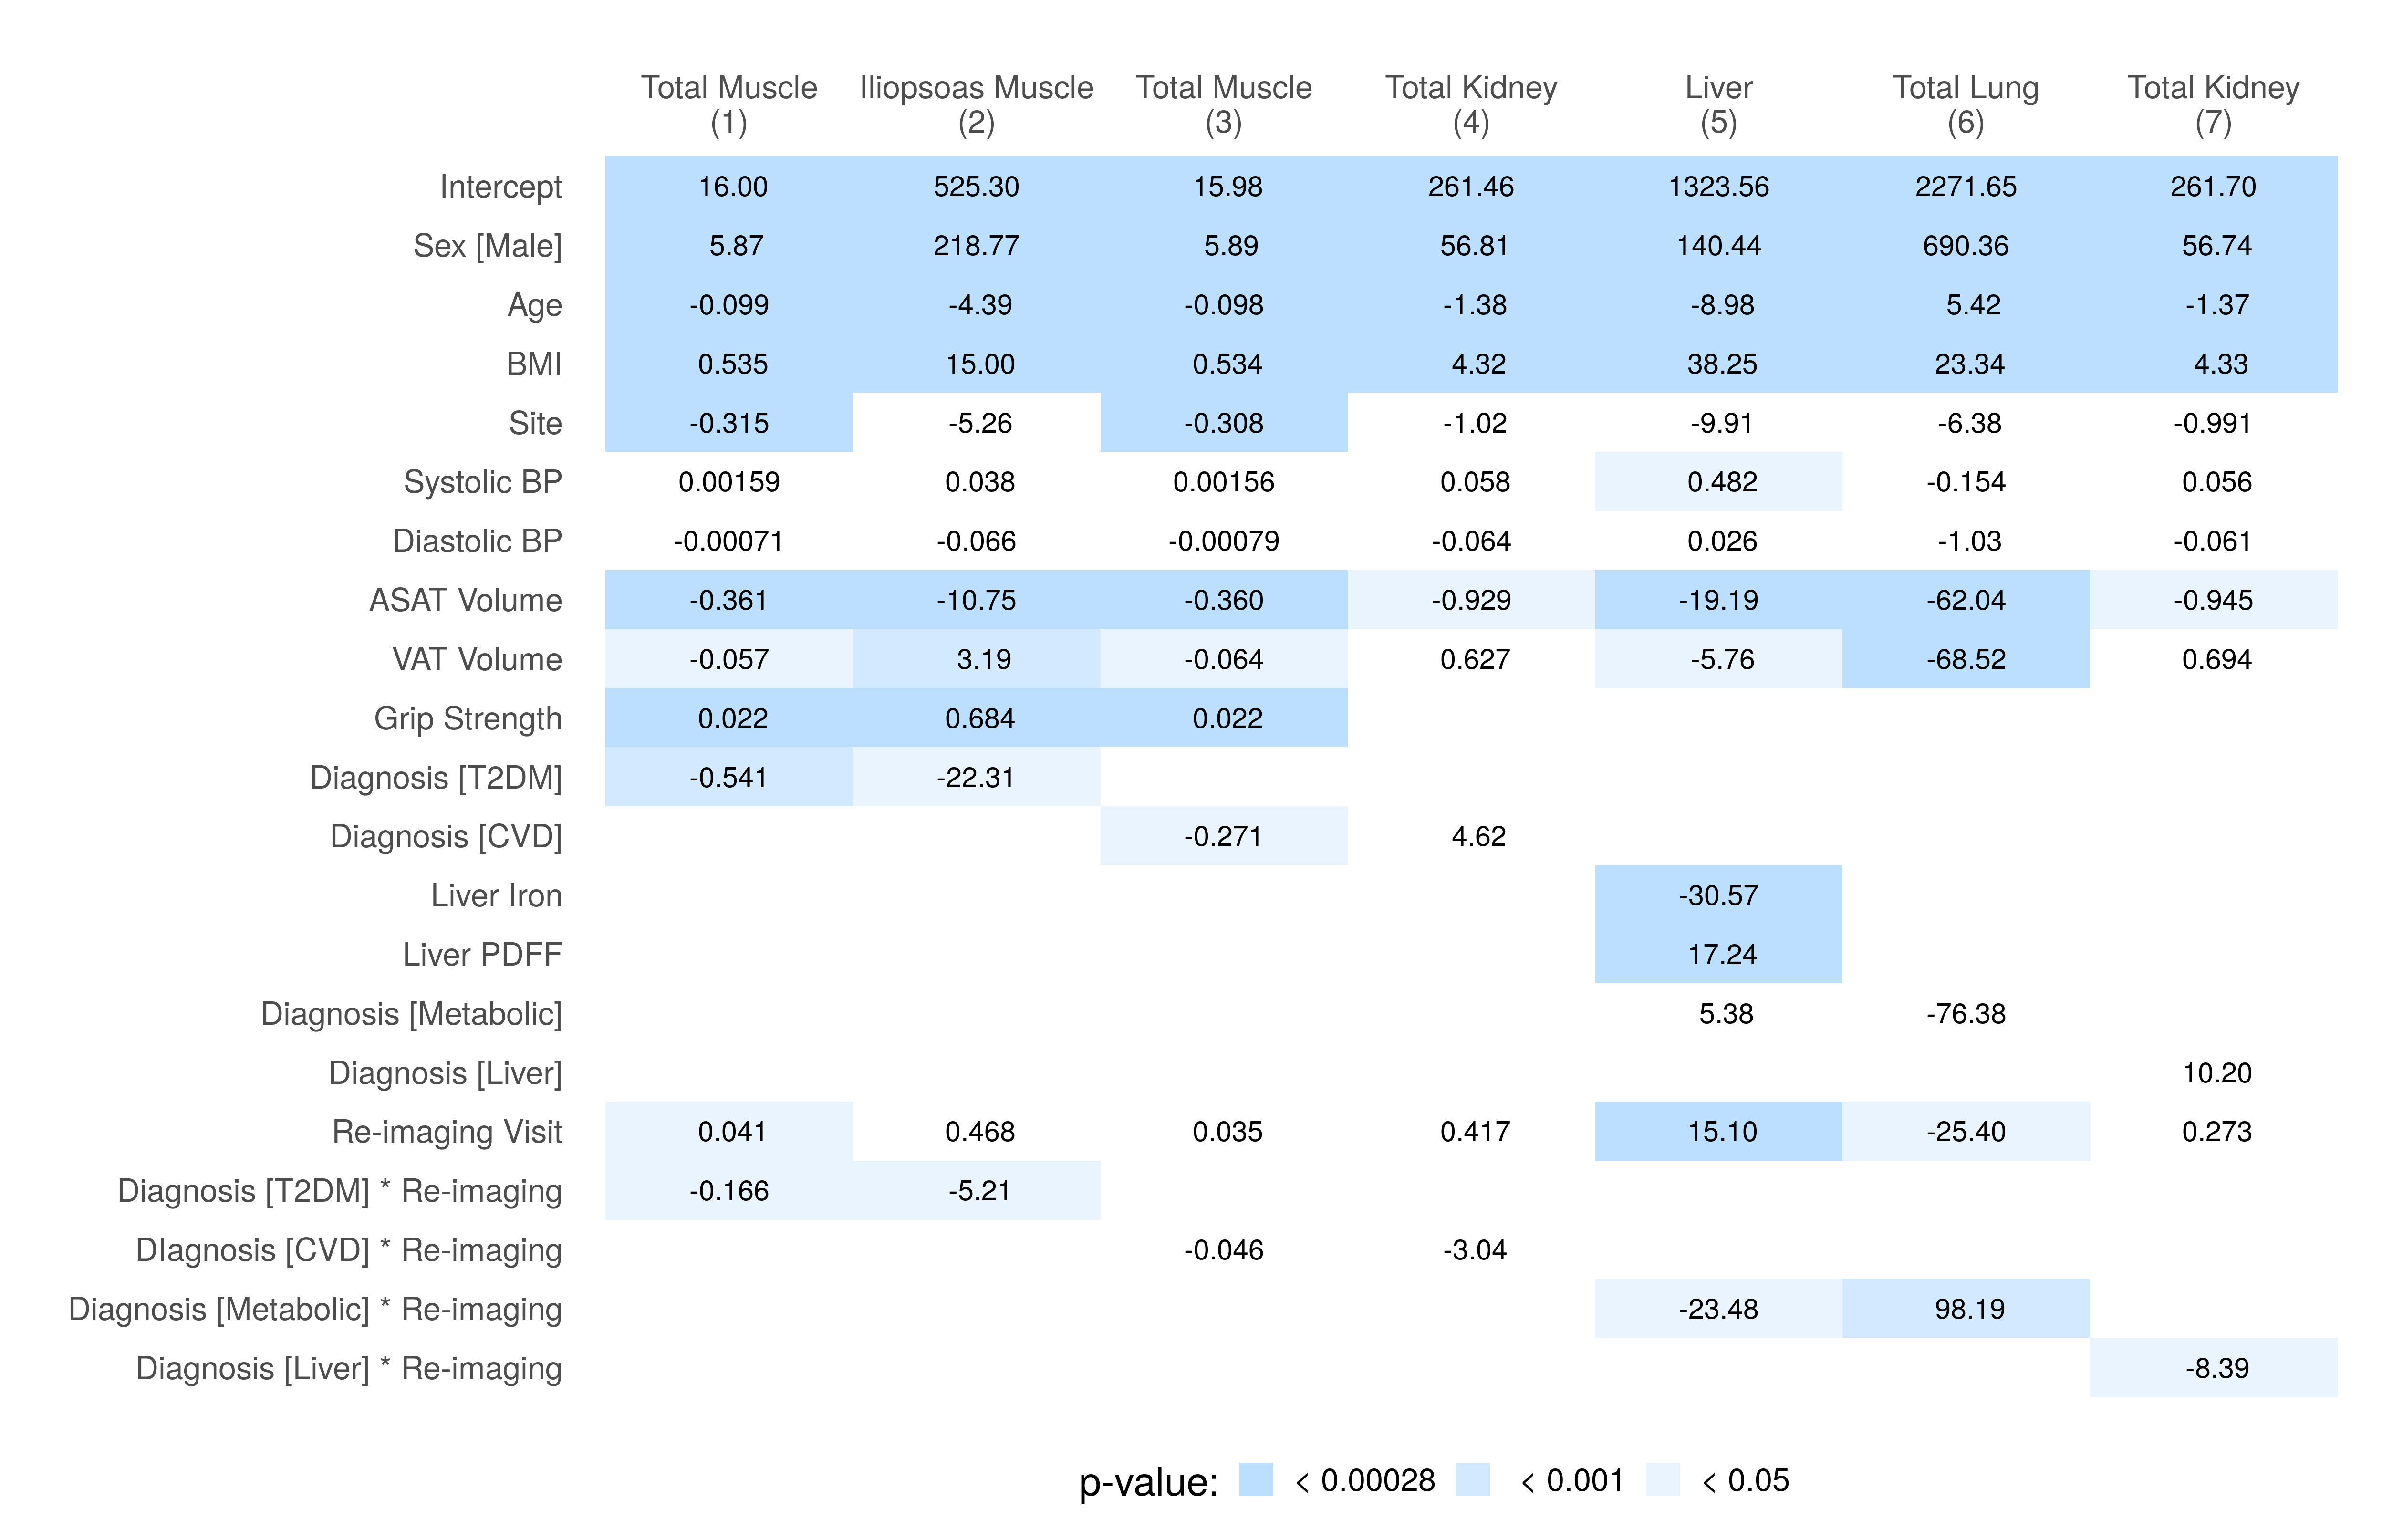
Figure 2. Summary of regression coefficients for the linear mixed-effects models in Table 2. All dependent variables are volumes measured in milliliters (ml), except for total muscle (Models 1 and 3), ASAT and VAT which are in liters (l). ASAT: abdominal subcutaneous adipose tissue; BMI: body mass index; BP: blood pressure; CVD: cardiovascular disease; PDFF: proton density fat fraction; T2DM: type-2 diabetes mellitus; VAT: visceral adipose tissue.
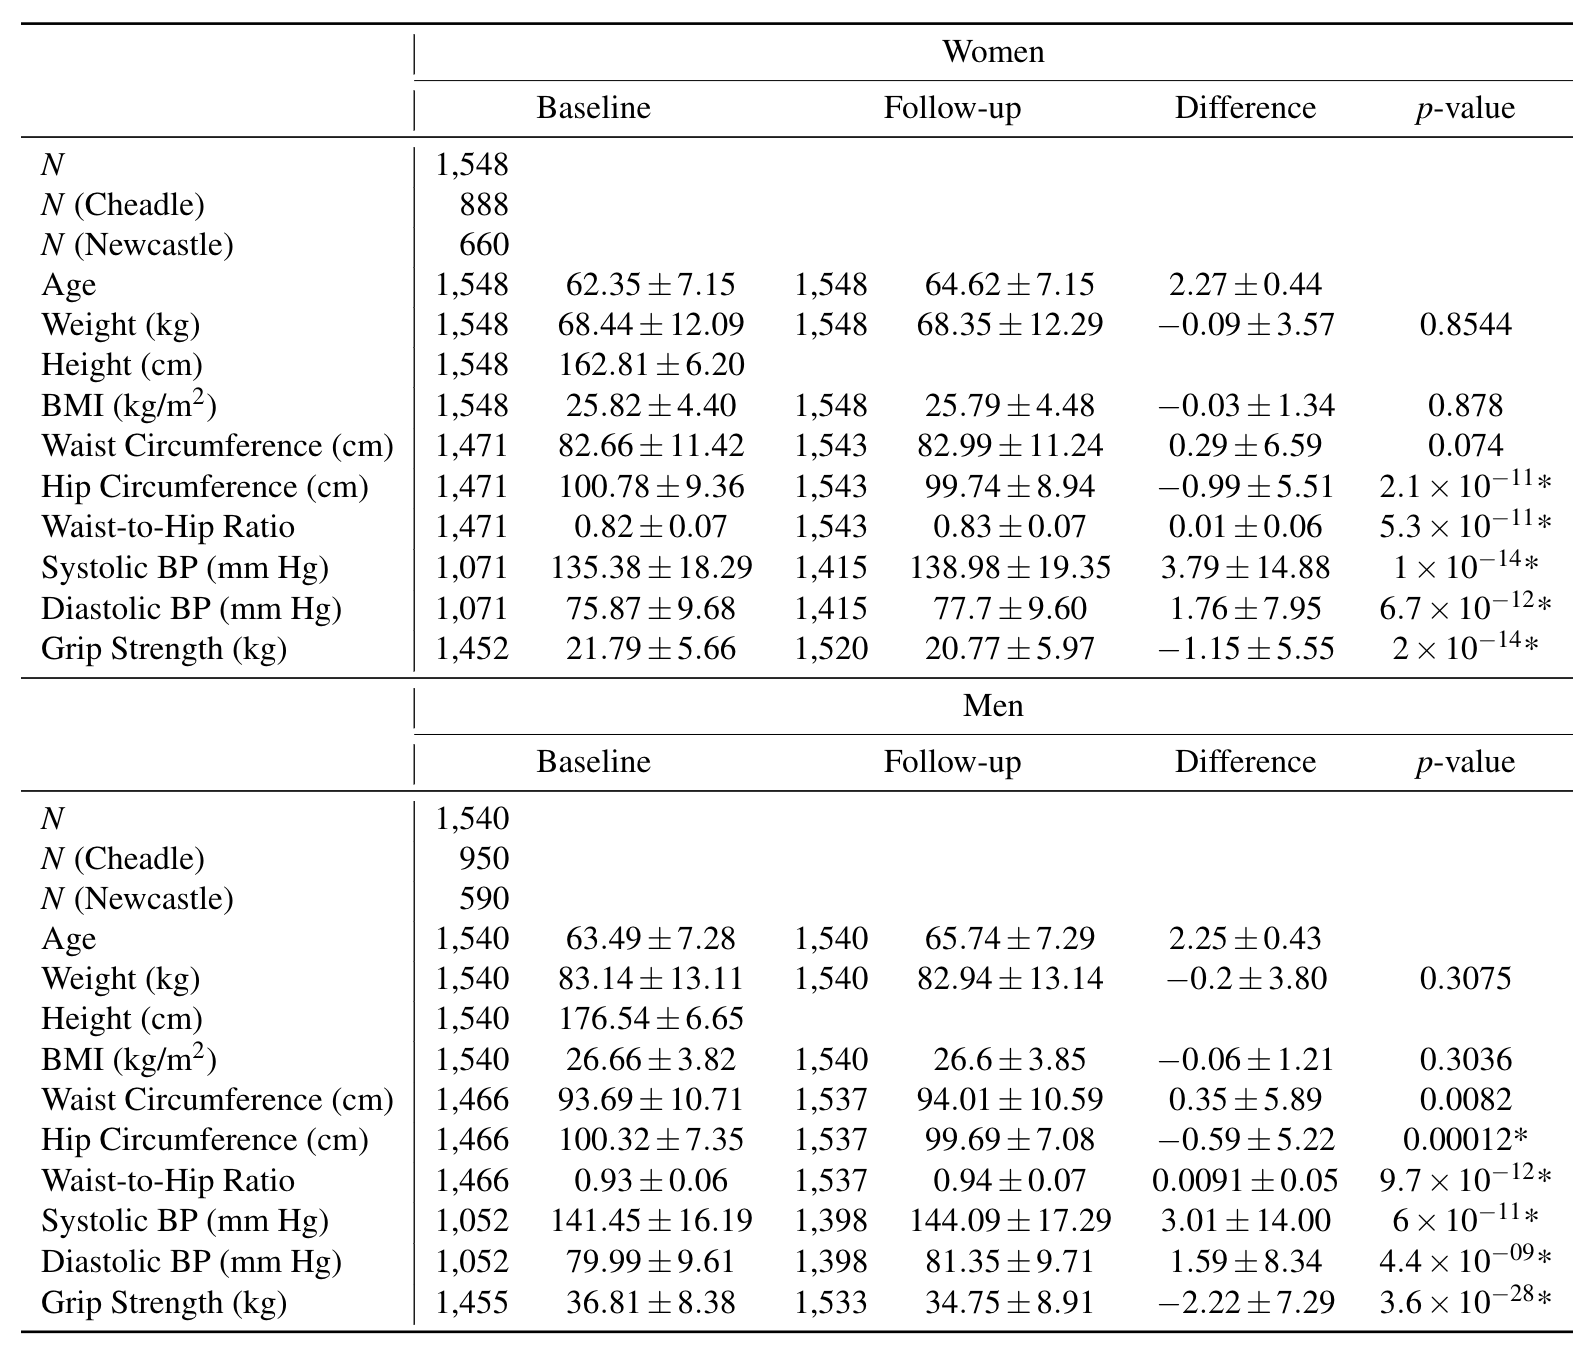
Table 1. Demographics for participants in the re-imaging cohort, separated by gender. Values are reported as mean and standard deviation. An asterisk (*) indicates the p-value is below the significance threshold adjusted for multiple comparisons. BMI: body mass index; BP: blood pressure.
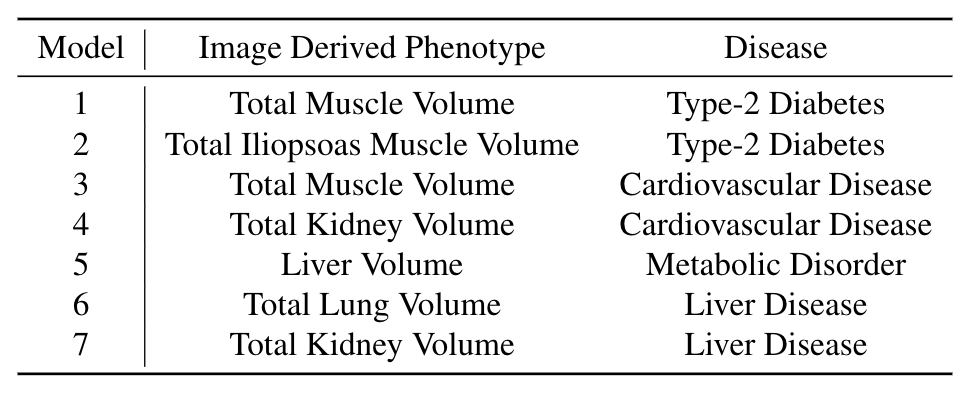
Table 2. Linear mixed-effects models by number, specifying the IDP and disease category.
DOI: https://doi.org/10.58530/2022/0618