0616
A principled approach to select DCE-MRI derived radiomics features for evaluation in phase I/II trials
Michael Berks1, Damien J McHugh2, Nuria Porta3, Ross A Little1, Susan Cheung1, Gordon C Jayson4,5, Geoff J M Parker6,7, and James P B O'Connor1,8,9
1Quantitative Biomedical Imaging Laboratory, Division of Cancer Sciences, University of Manchester, Manchester, United Kingdom, 2Medical Physics, The Christie Hospital NHS Trust, Manchester, United Kingdom, 3Clinical Trials and Statistics Unit, The Institute of Cancer Research, London, United Kingdom, 4Division of Cancer Sciences, University of Manchester, Manchester, United Kingdom, 5Department of Medical Oncology, The Christie Hospital NHS Trust, Manchester, United Kingdom, 6Centre for Medical Image Computing, Department of Medical Physics and Biomedical Engineering, University College London, London, United Kingdom, 7Bioxydyn Ltd, Manchester, United Kingdom, 8Department of Radiology, The Christie Hospital NHS Trust, Manchester, United Kingdom, 9Division of Radiotherapy and Imaging, The Institute of Cancer Research, London, United Kingdom
1Quantitative Biomedical Imaging Laboratory, Division of Cancer Sciences, University of Manchester, Manchester, United Kingdom, 2Medical Physics, The Christie Hospital NHS Trust, Manchester, United Kingdom, 3Clinical Trials and Statistics Unit, The Institute of Cancer Research, London, United Kingdom, 4Division of Cancer Sciences, University of Manchester, Manchester, United Kingdom, 5Department of Medical Oncology, The Christie Hospital NHS Trust, Manchester, United Kingdom, 6Centre for Medical Image Computing, Department of Medical Physics and Biomedical Engineering, University College London, London, United Kingdom, 7Bioxydyn Ltd, Manchester, United Kingdom, 8Department of Radiology, The Christie Hospital NHS Trust, Manchester, United Kingdom, 9Division of Radiotherapy and Imaging, The Institute of Cancer Research, London, United Kingdom
Synopsis
DCE-MRI biomarkers such as change in median Ktrans have a proven role in drug development in phase I/II trials. There is current interest in using approaches such as radiomics to extract additional information relating to spatial heterogeneity from images and one emerging application is to apply these analyses to clinical trial data where imaging is used to monitor pharmacodynamic change in the tumour microenvironment. Here, we explore the properties of radiomics features extracted from maps of Ktrans and aim to identify features that are repeatable at baseline, show consistent treatment effect and provide additional, independent information to the median Ktrans.
Introduction
Over 100 early phase trials of drugs that target angiogenesis have employed DCE-MRI biomarkers to detect drug mechanism of action and response to therapy, with substantial evidence that such drugs reduce tumour median Ktrans 1. Radiomics methods derive large numbers of shape and texture features from images2. There is current interest in applying radiomics to DCE-MRI data not only to predict outcome3 but as response monitoring biomarkers in clinical trials4. These studies aim to extract more information than recommended endpoints such as median Ktrans 5. However, the statistical properties of such features for DCE-MRI parameter maps have not been characterised. This is important because: DCE-MRI parameter maps have complex acquisition and analysis pipelines; maps have different noise properties to the CT images for which radiomics features were developed; the size of DCE-MRI datasets (relative to the number of radiomics features) precludes the use of standard big data machine learning techniques to identify complex relationships between features, due to the likelihood of overtraining and the detection of spurious correlations. Here, we explore the properties of radiomics features extracted from maps of Ktrans. Specifically, we aim to detect features that are: (i) repeatable at baseline (ii) show consistent treatment effect; and (iii) provide additional, independent information to median Ktrans.Methods
DCE-MRI dataWe examined data from two studies of patients with colorectal cancer liver metastases receiving bevacizumab monotherapy during one cycle of treatment (study 1: 9 patients, 34 tumours6; study 2: 71 patients, 114 tumours7). All patients were imaged twice at baseline (2-5 days apart), then at 48hrs on-treatment and at the end of cycle 1 (EC1; 12-14 days) using an axial 3D T1-FFE DCE-MRI protocol on a Philips 1.5 T Achieva system. Contrast agent Gd-DOTA was administered at the DCE 8th time point using a power injector (dose 0.1mMol/kg; flow rate 3ml/s). All tumours were annotated manually by an experienced MRI radiographer. Baseline T1 was estimated using the VFA approach and used to convert dynamic signal to contrast-agent concentration. The extended-Kety model8 was fitted to the concentration time-series of each tumour voxel, producing maps of Ktrans, using the open-source toolkit Madym v4.15.29.
Radiomics feature extraction
Radiomics features were extracted using the open-source python toolbox PyRadiomics v2.2.0b110 for un-normalized maps of Ktrans. One hundred and five features were extracted per tumour. Features belonged to seven PyRadiomics classes: Shape, First Order, Gray Level Co-occurrence Matrix (GLCM), Gray Level Run Length Matrix (GLRLM), Gray Level Size Zone Matrix (GLSZM), Gray Level Dependence Matrix (GLDM), and Neighbouring Gray Tone Difference Matrix (NGTDM).
Statistical analysis of features
Baseline repeatability was assessed using the intraclass correlation coefficient (ICC)11. Treatment effects (change from the baseline average to each post-treatment visit, normalized by the standard deviation of the baseline differences) were measured which provided a comparable measure between features that would otherwise be on different scales, while taking in to account the measurement errors of the feature. Correlation coefficients were used to assess if each feature provided additional independent information to the tumour median Ktrans. Each measure was computed as the mean of 1,000 bootstrap samples of the original data. Analysis code is available in our GitLab project12.
Results
Figure 1 shows sample images, Bland-Altman plots of baseline median Ktrans and confirmation of median Ktrans reduction at 48hrs and EC1 following treatment. Figure 2 shows repeatability for all features grouped by radiomics class. ICC values ranged between 0.008 to 0.99, with 19/105, 33/105 and 42/105 showing excellent (>0.9), good (>0.75, ≤0.90) and moderate repeatability (>0.5, ≤0.75) respectively13. Figure 3 shows the normalized treatment effect at 48hrs and EC1 with 9/105 and 8/105 features having changes that significantly exceeded that of the median Ktrans. Figure 4 shows the correlation of each feature to the median at 48hrs/EC1 and that 65 and 66 features respectively had an absolute correlation coefficient < 0.5. Finally, we combined the information from figures 2-4, transforming all measures to range from 0 to 1 (Figure 5; see legend for details) and plotted how these three characteristics (baseline ICC, treatment effect at 48hrs/EC1 and correlation to median at 48hrs/EC1) scored using a continuous colour scale (red = bad/green = good). Overall, 8 radiomics features scored at least 0.5 on all transformed measures : GLRLM: RunLengthNonUniformity; GLSZM: LargeAreaEmphasis, LargeAreaLowGrayLevelEmphasis, ZoneEntropy, ZoneVariance, GLDM: DependenceEntropy, DependenceNonUniformity, GrayLevelNonUniformity.Discussion
For radiomics to add value to DCE-MRI studies that monitor pharmacodymanic changes induced by antiangiogenic therapies, features must provide additional information to established biomarkers, such as the change in median Ktrans. In this work we perform the first evaluation of the statistical properties of radiomics features in a relatively large number of patients undergoing DCE-MRI. Good features should show strong repeatability at baseline (otherwise spurious changes due to measurement error could be mistaken for treatment effects), a consistent change from baseline following treatment, and provide independent information to simple summary statistics (to justify the increased complexity of applying the radiomics analysis). Our work identifies 8 texture features that consistently met these criteria. This does not prove other features have no potential for providing information in multivariate models, but where data is limited, it helps to narrow the original complete set to enable more in-depth analyses to proceed.Acknowledgements
This work was supported by Cancer Research UK (CRUK) Clinician Scientist award (grant C19221/A22746) and CRUK and EPSRC Cancer Imaging Centre in Cambridge and Manchester funding to The University of Manchester (grant C8742/A18097)References
- O'Connor, JPB et al., Dynamic contrast-enhanced MRI in clinical trials of antivascular therapies, Nature Reviews Clinical Oncology 9, 167–177 (2012)
- Gillies RJ, Kinahan PE, Hricak H. Radiomics: images are more than pictures, they are data. Radiology. 2016 Feb;278(2):563-77.
- Chitalia RD, Rowland J, McDonald ES, Pantalone L, Cohen EA, Gastounioti A, Feldman M, Schnall M, Conant E, Kontos D. Imaging phenotypes of breast cancer heterogeneity in preoperative breast dynamic contrast enhanced magnetic resonance imaging (DCE-MRI) scans predict 10-year recurrence. Clinical Cancer Research. 2020 Feb 15;26(4):862-9.
- Fournier L, Costaridou L, Bidaut L, Michoux N, Lecouvet FE, de Geus-Oei LF, Boellaard R, Oprea-Lager DE, Obuchowski NA, Caroli A, Kunz WG. Incorporating radiomics into clinical trials: expert consensus endorsed by the European Society of Radiology on considerations for data-driven compared to biologically driven quantitative biomarkers. European radiology. 2021 Jan 25:1-2.
- Leach MO, Brindle KM, Evelhoch JL, Griffiths JR, Horsman MR, Jackson A, Jayson GC, Judson IR, Knopp MV, Maxwell RJ, McIntyre D. The assessment of antiangiogenic and antivascular therapies in early-stage clinical trials using magnetic resonance imaging: issues and recommendations. British journal of cancer. 2005 May;92(9):1599-610.
- O'Connor JP, Carano RA, Clamp AR, Ross J, Ho CC, Jackson A, Parker GJ, Rose CJ, Peale FV, Friesenhahn M, Mitchell CL. Quantifying antivascular effects of monoclonal antibodies to vascular endothelial growth factor: insights from imaging. Clinical Cancer Research. 2009 Nov 1;15(21):6674-82.
- Jayson GC, Zhou C, Backen A, Horsley L, Marti-Marti K, Shaw D, Mescallado N, Clamp A, Saunders MP, Valle JW, Mullamitha S. Plasma Tie2 is a tumor vascular response biomarker for VEGF inhibitors in metastatic colorectal cancer. Nature communications. 2018 Nov 7;9(1):1-4.
- Tofts, P. S., Modeling tracer kinetics in dynamic Gd-DTPA MR imaging. J. Magn. Reson. Imaging, 7: 91–101 (1997)
- Berks M, m Parker GJ, Little R, Cheung S. Madym: A C++ toolkit for quantitative DCE-MRI analysis. Journal of Open Source Software. 2021 Oct 7;6(66):3523.
- an Griethuysen JJ, Fedorov A, Parmar C, Hosny A, Aucoin N, Narayan V, Beets-Tan RG, Fillion-Robin JC, Pieper S, Aerts HJ. Computational radiomics system to decode the radiographic phenotype. Cancer research. 2017 Nov 1;77(21):e104-7.
- Weir JP. Quantifying test-retest reliability using the intraclass correlation coefficient and the SEM. The Journal of Strength & Conditioning Research. 2005 Feb 1;19(1):231-40.
- Manchester QBI public GitLab: https://gitlab.com/manchester_qbi/manchester_qbi_public/dce_radiomics_repeatability
- Koo TK, Li MY. A guideline of selecting and reporting intraclass correlation coefficients for reliability research. Journal of chiropractic medicine. 2016 Jun 1;15(2):155-63.
Figures
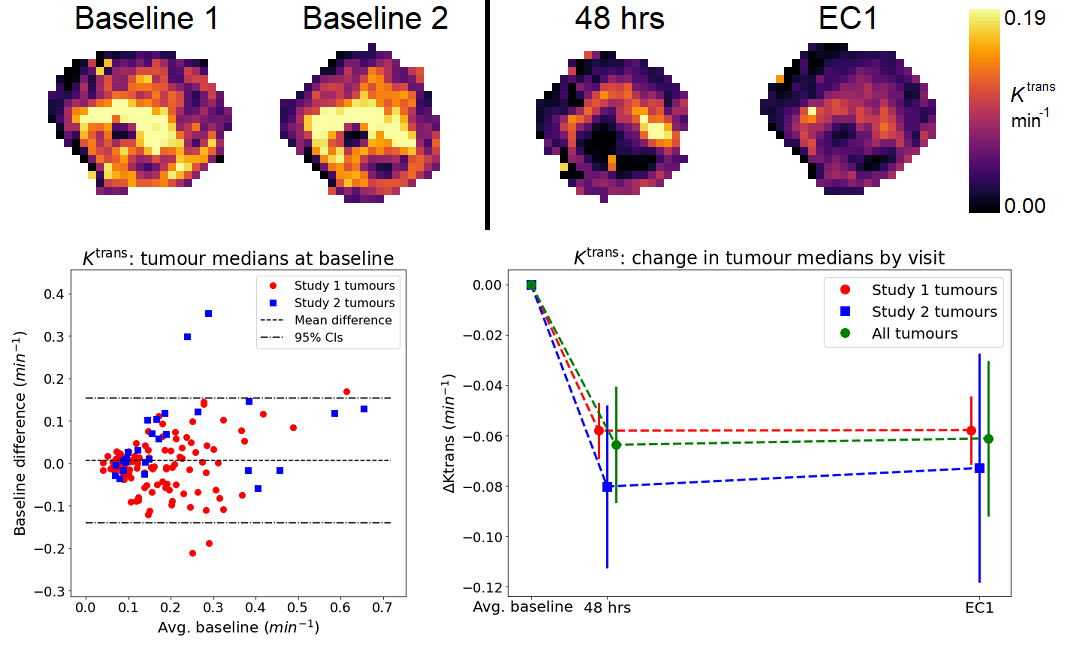
Figure 1: (top row) Ktrans maps for a tumour at
baseline
(two visits), 48 hours and end of cycle 1
(EC1); (bottom left) Bland-Altman plot showing baseline average vs baseline
difference for median Ktrans; (bottom right): Change in tumour median at
each treatment visit – solid markers show dataset means, solid lines 95%
confidence intervals (CIs).
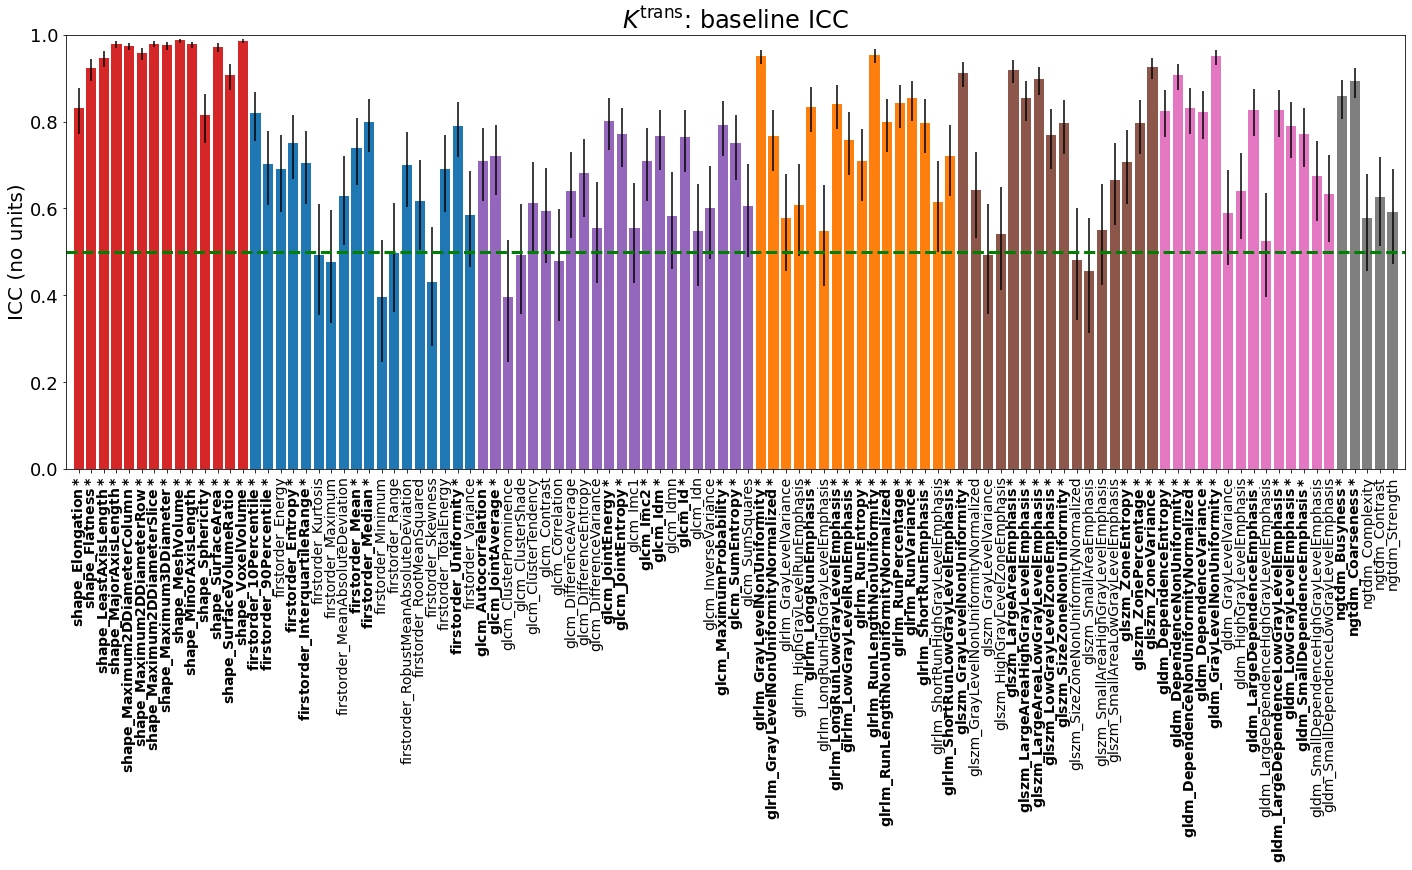
Figure 2: Baseline intraclass correlation coefficients
(ICC) for each radiomics feature derived from tumour maps of Ktrans. Bars are coloured according
to their PyRadiomics class: Shape (red), First Order (blue), GLCM (purple), GLRLM (orange), GLSZM (brown), GLDM (pink) and
NGTDM (grey); Figures 3-5 use the same colours to group features. Black lines show 95% CIs. Features with ICC at least 0.5 (moderate
repeatability13, green
dashed line) are labelled bold* and considered for final selection.
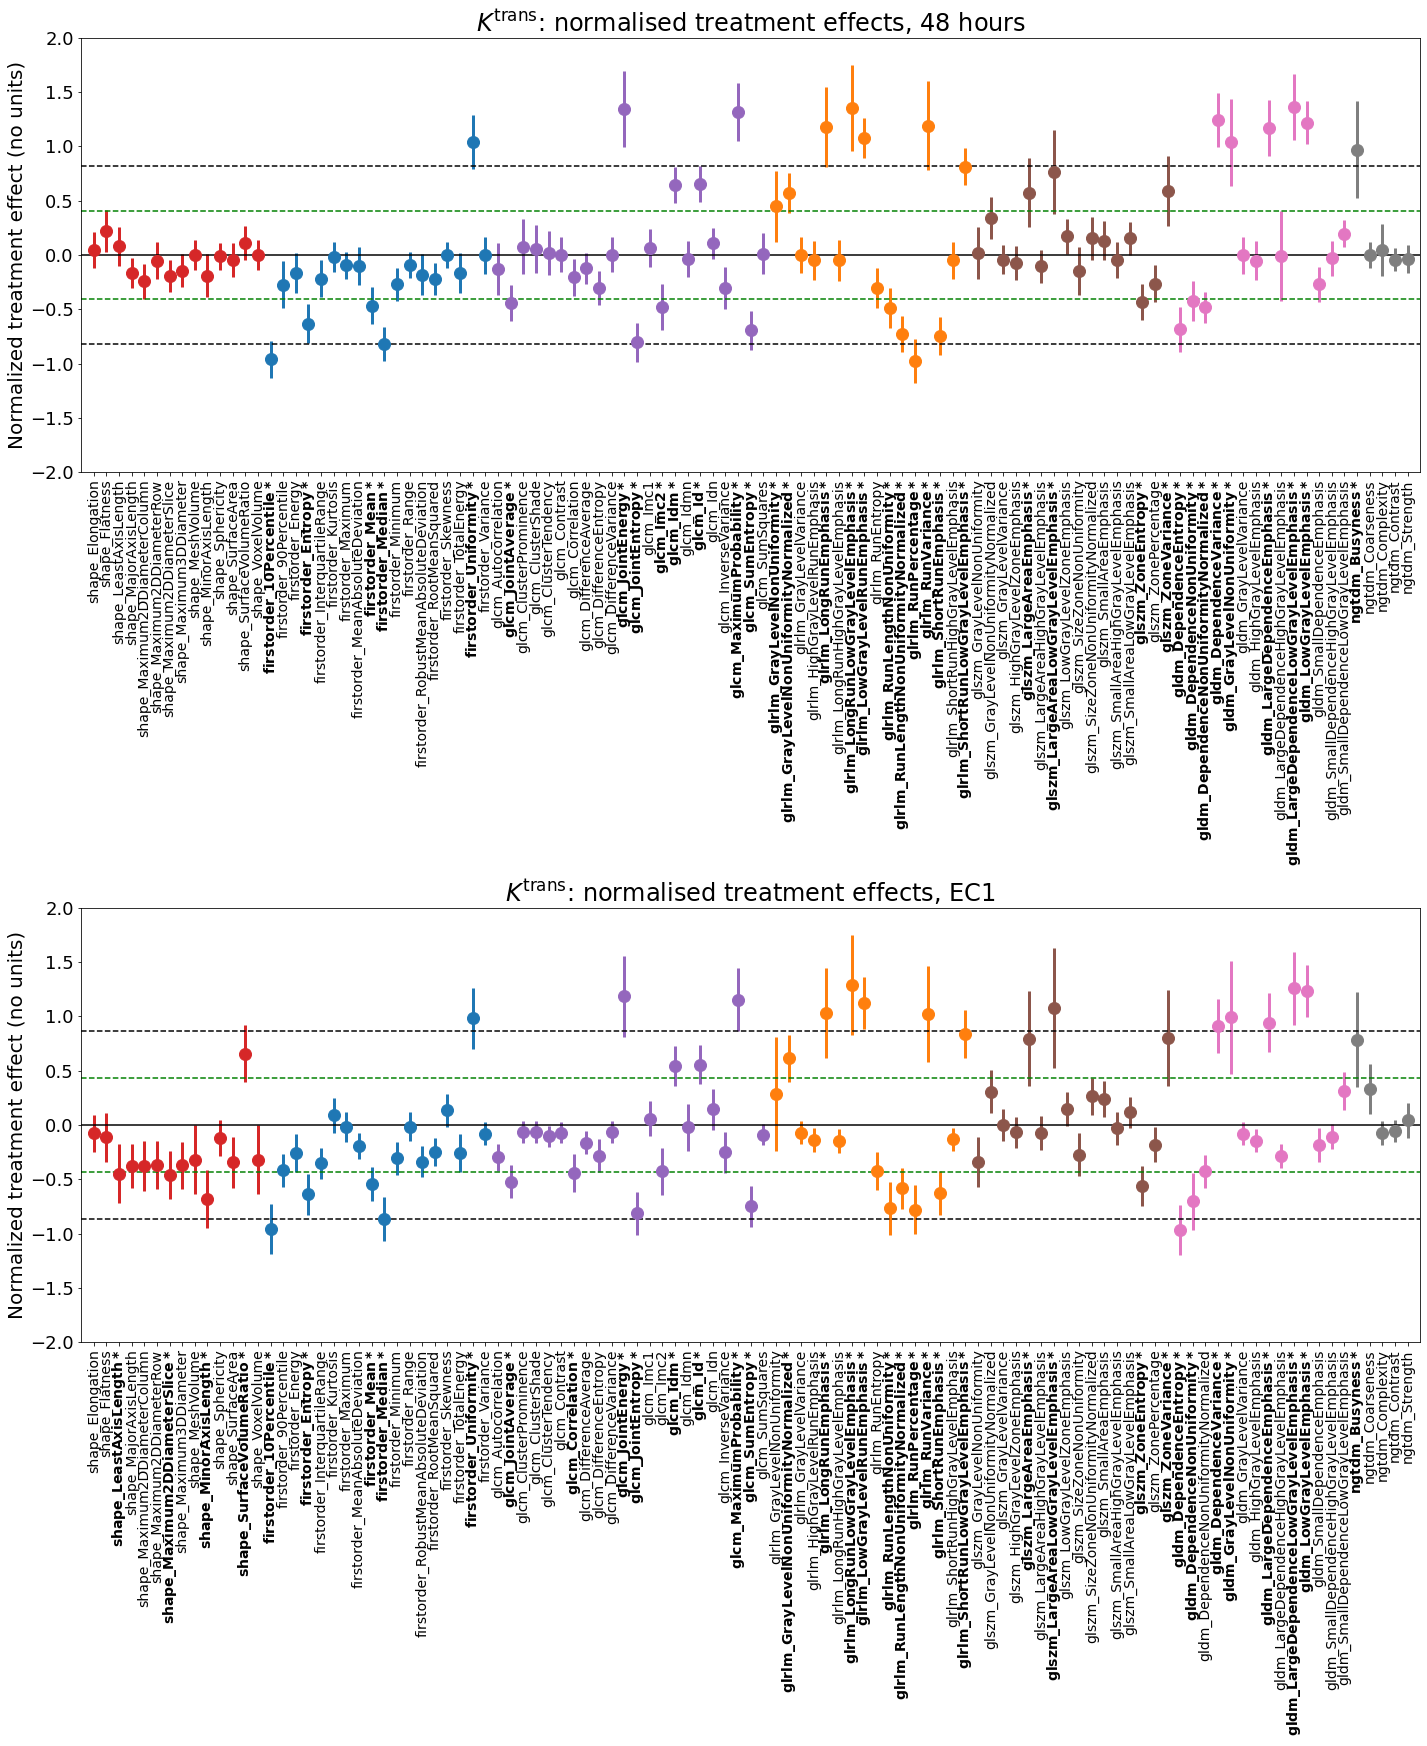
Figure 3: Normalized treatment effect at 48 hours
(top) and EC1 (bottom). Solid markers show dataset mean, solid lines 95% CIs.
Dashed black lines show ± the treatment effect of the tumour median. Features with 95% CIs exceeding the black dashed lines have
significantly greater effect than the median. Green
dashed lines show ± 0.5 x median effect; features with absolute normalized
treatment effect at least 0.5 x median effect are labelled bold* and considered
for final selection.
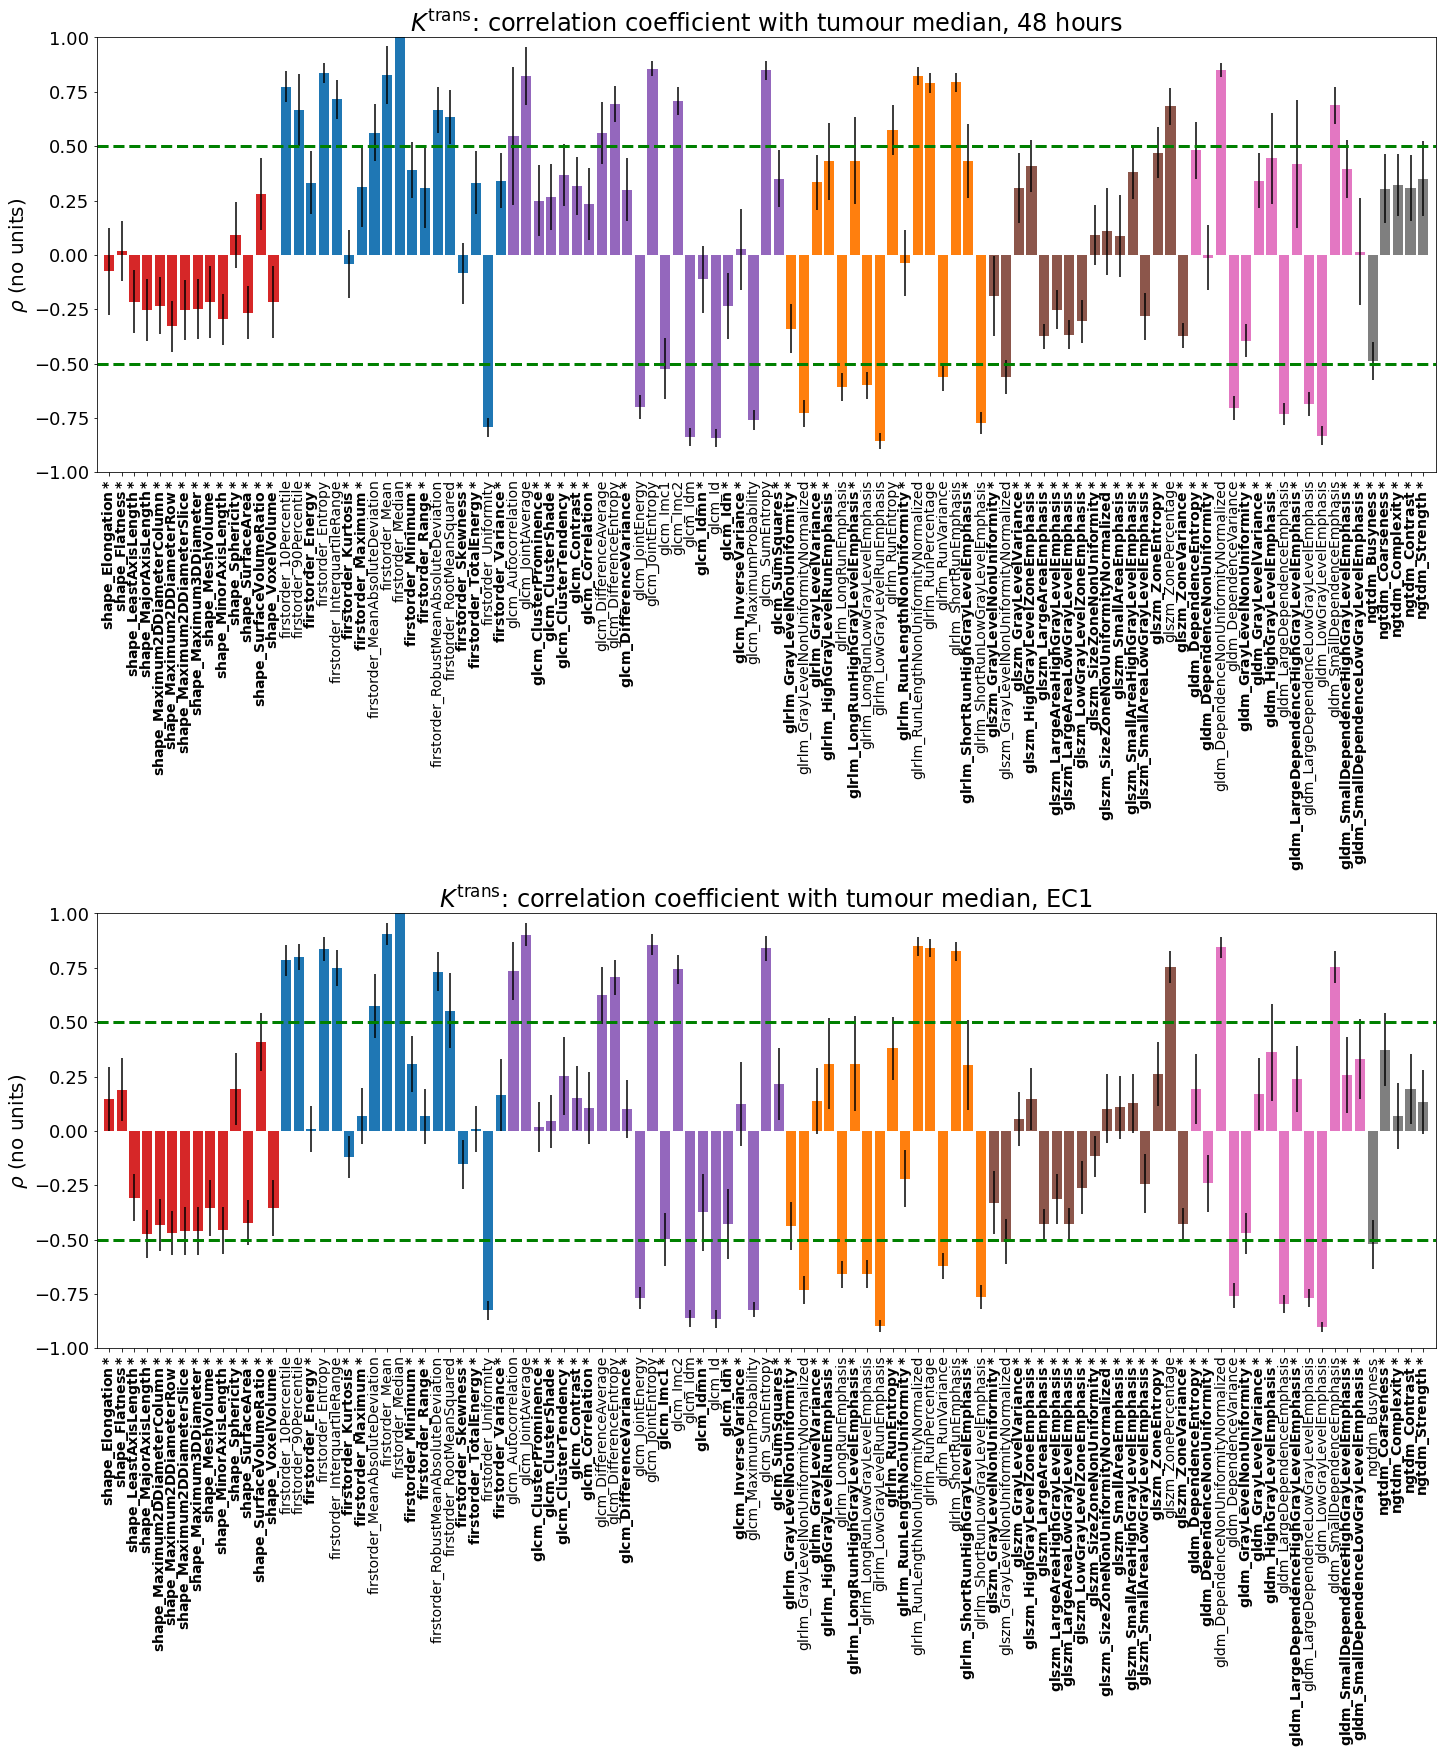
Figure 4: Correlation
coefficient between the change from baseline of each radiomics feature and
change from baseline of the tumour median at 48 hrs (top) and EC1 (bottom).
Features with absolute correlation |ρ|< 0.5 (green dashed lines) are labelled bold*
and considered for final selection.

Figure
5: Checklist of desirable properties
for each radiomics feature, shown on a colour scale from 0 (red, least
desirable) to 1 (green, most desirable).
ICC maps to the colour scale directly. Treatment effects are mapped by taking
their absolute value, dividing by the (absolute) normalized treatment effect of
the median and capping at 1.0. Correlations are mapped by taking their absolute
value and subtracting from 1.0. Features that score at least 0.5 on all
properties are labelled bold*.
DOI: https://doi.org/10.58530/2022/0616