0615
Evaluation of precision of multi-compartment model on relaxation properties in breast cancer on 3T using numerical simulation1Radiology Physics, University Hospital Coventry and Warwickshire, Coventry, United Kingdom, 2Institute of Medical Sciences, School of Medicine, Medical Sciences and Nutrition, University of Aberdeen, Fosterhill, Aberdeen, Scotland, 3Donders Institute for Brain, Cognition and Behaviour, AJ Nijmegen, Germany
Synopsis
MR relaxation properties of T1 and T2 are well known to alter in cancer, reflecting diseased tissue micro-environment. Multiple compartment models have been developed to better approximate tissue classes within an imaging voxel, allowing more accurate estimation of disease load for more precise treatment planning and monitoring. However, multiple compartment models is more sensitive to noise and suffers from potential overfitting, due to from significantly increased number of variables for fitting exponential functions and consequently more complex cost function. We therefore conducted numerical simulation to establish, the first in the literature, applicability condition of multiple compartment model in breast cancer.
Introduction
Despite the improvement of treatment for breast cancer, the leading cause of death in women is hindered by the inadequacy of radiological methods sensitive to the spatially heterogeneous response to treatment. Relaxometry properties of T1 and T2 are known to be altered by breast tumors in accordance with underlying tissue composition, prompting the development of multiple compartment models to better approximate tissue classes for a more accurate estimation of disease load [1]. However, multiple compartment models are more sensitive to noise and suffer from potential overfitting, due to the significantly increased number of variables fitting the exponential function which results in a more complex cost function [2]. We, therefore, conducted a numerical simulation to establish, the first in the literature, the applicability condition of multiple compartment models in breast cancer.Methods
We conducted a series of Monte Carlo simulations in Matlab (R2020a, MathWorks, Natick, USA) based on clinical research sequences used for breast imaging on a whole-body clinical 3T MR scanner (InGenius, Philips Healthcare, Netherlands). The T1 measurement was based on an inversion recovery sequence with 35 inversion times (TIs) evenly spaced out between 150.04ms and 5251.4ms. The T2 measurement was based on a multi spin-echo sequence with 24 echo times evenly spaced between 13ms and 312ms. The relaxation properties of a malignant lesion, benign lesion, adipose tissue, fibrogandular tissue were quoted from the literature [3,4].Signal Generation: The idealized noise-free signals for each tissue class were generated as exponential functions based on Bloch equations. Single compartment model assumed single tissue class with a weighting factor of W1 and two-compartment model for two tissue classes at W1 and W2 so that the overall fully relaxed magnetization was normalized to 1. 10,000 runs of complex noise with Gaussian distribution (µ= 0 and σ=1) were scaled to 1/SNR before added to the idealized signal to create 10,000 signal instances.
Signal Fitting: The relaxometry properties were estimated by fitting the simulated data using a non-linear least-square fitting method using the trust region reflective algorithm. Mono- and bi-exponential fitting were constructed for single and two tissue classes with a weighting factor of W1 =1 and W1 + W2 = 1 respectively so that a permutation between signal generation and fitting on tissue classes can be achieved. The data point from the first echo in the T2 signal was discarded in line with common practice to avoid the stimulated echo effect.
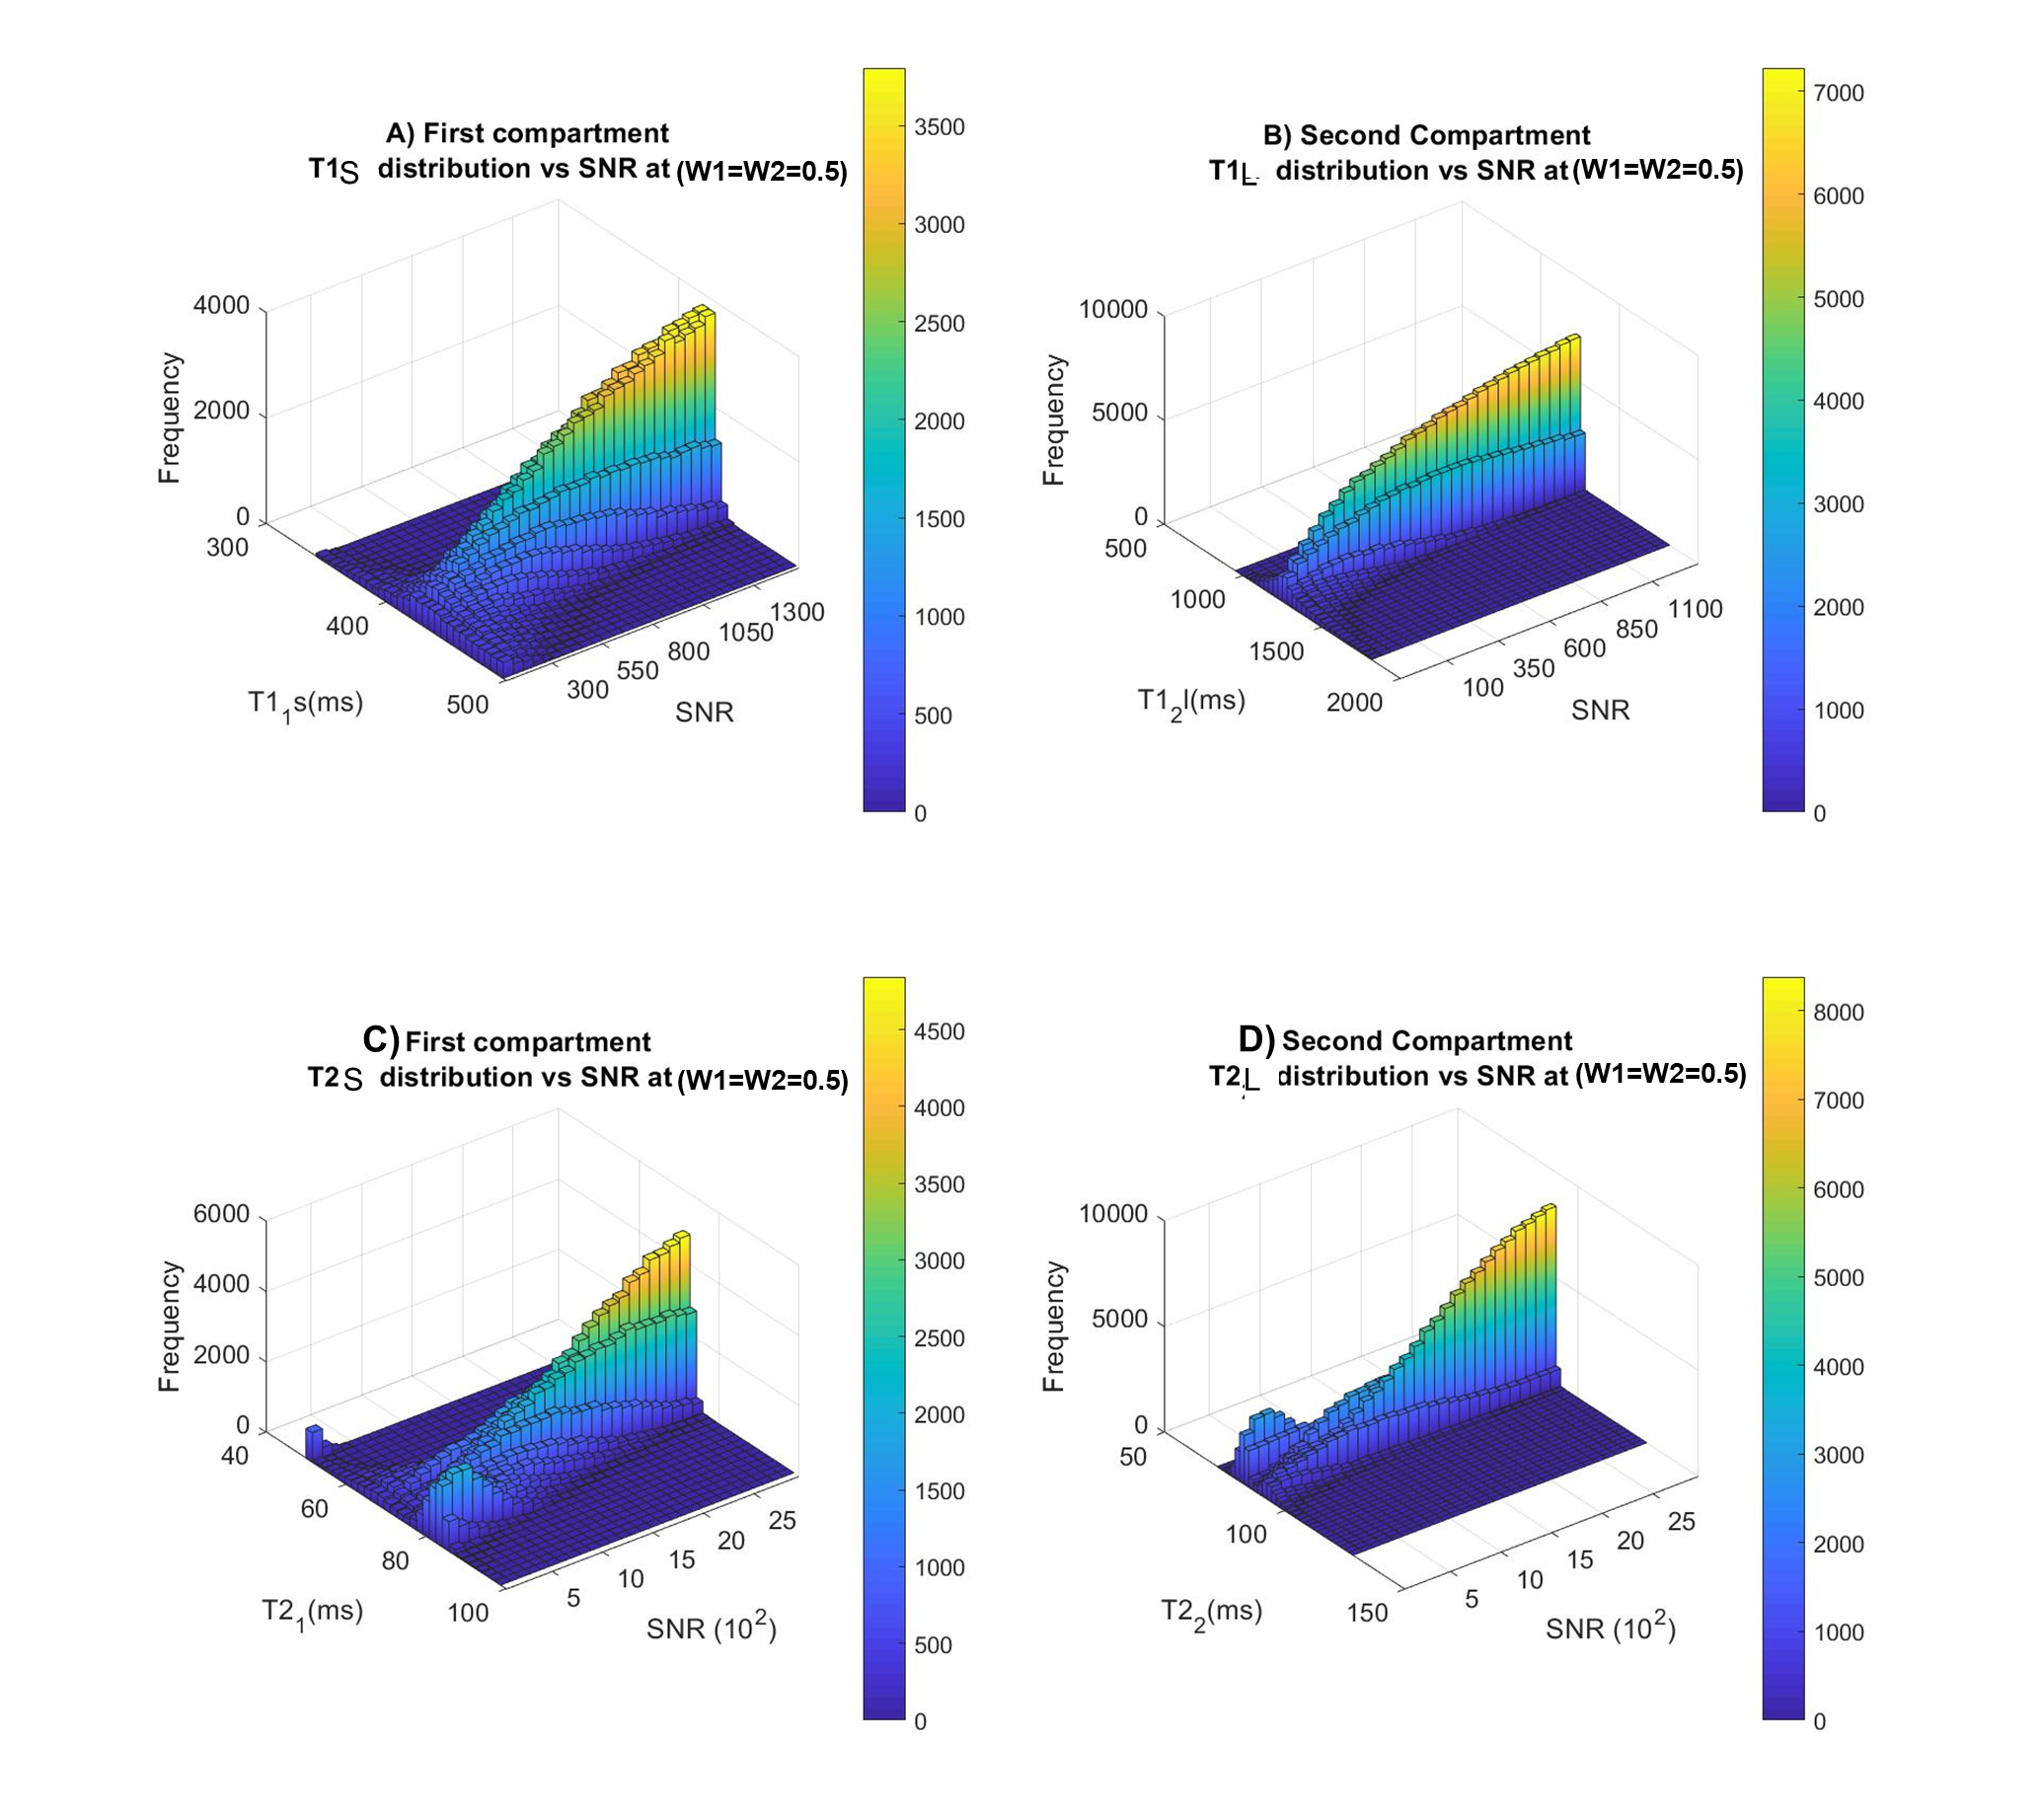
Numerical Analysis: The single compartment coupled with the mono-exponential fitting was performed for the 4 typical tissue classes in breast cancer [3] using an SNR of 300, to quantify the normality, standard deviation (SD), and Root Mean Squared Error (RMSE) of the histogram distribution. The signal from the two-compartment model (adipose, benign and malignant lesion), W1 = W2 = 0.5) was generated, and fitted using both mono- and bi-exponential fitting to derive SD, RMSE, skewness, and kurtosis for each output compartment. The relative weighting for the two compartments was varied from 0 to 1 in steps of 0.1, and SNR from 100 to 1500 in steps of 50, to compare the suitability of the fitting approaches.
Results
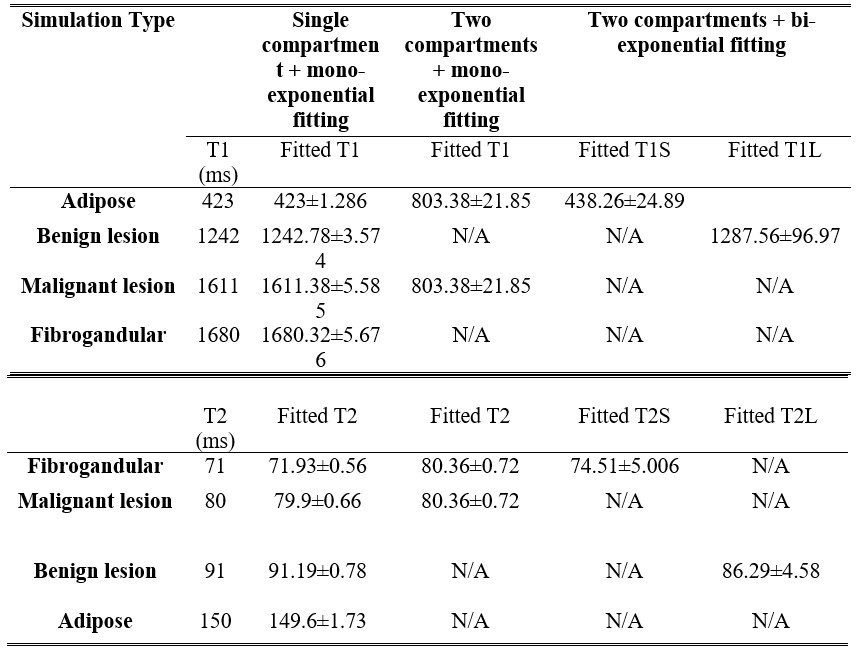
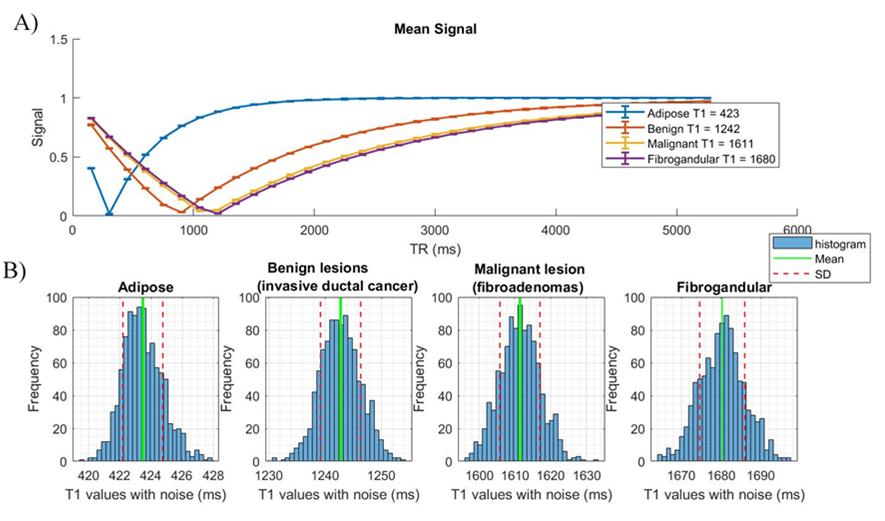
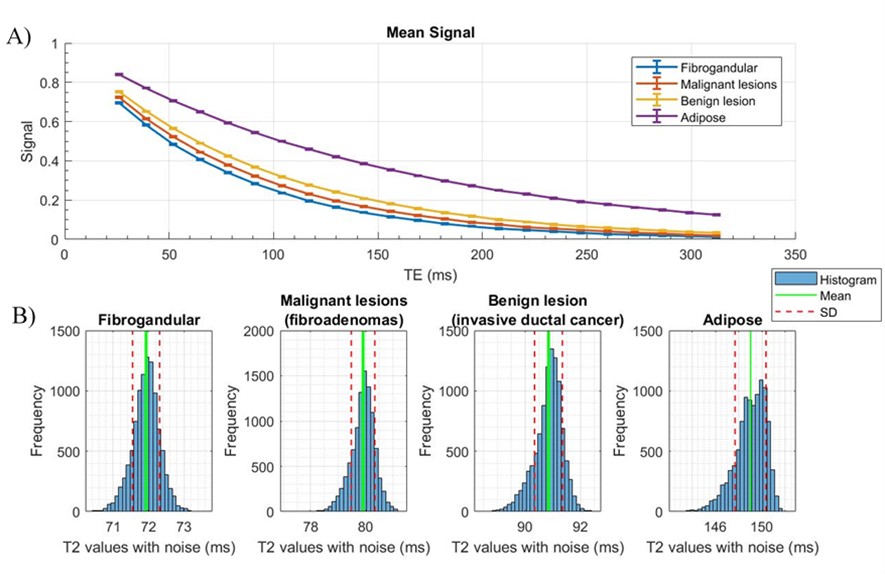
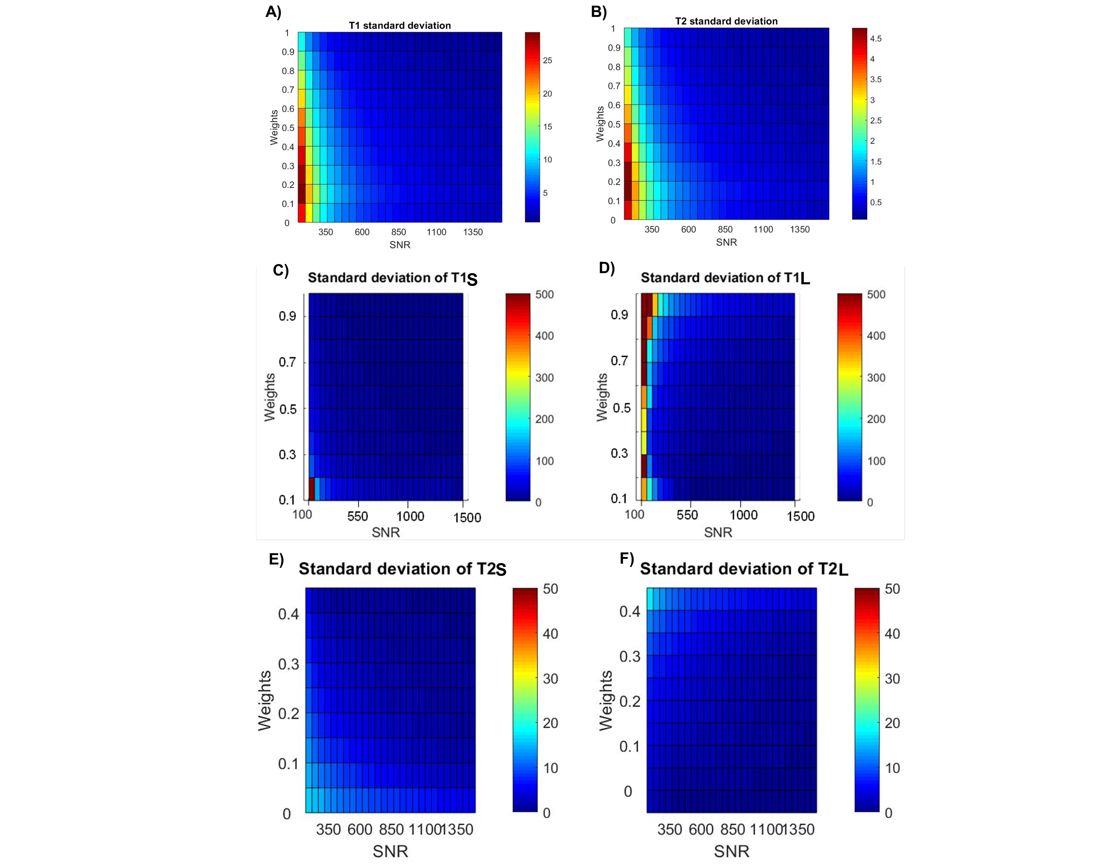
The distribution of quantified T1 and T2 follows Gaussian distribution, and the SD increases monotonically with the increase in relaxation time, with T1 of 423±1.2 ms and T2 of 149.6±1.7 ms in adipose tissue to T1 of 1680.3±5.6 ms and T2 of 71.9±0.5 ms in fibrogandular tissue at the same SNR (Figure 1&2). The two-compartment model yields T1 of 803.3 ± 21.8 ms and T2 of 80.3 ± 0.7 ms using the mono-exponential fitting, and T1 of 438.2±24.8 ms and 1287.5 ± 96.9 ms and T2 of 74.5 ± 5.1 ms and 86.2 ± 4.5 ms using bi-exponential fitting (Table 1). The weighting factor of 0.1 yielded T1 of 491.9 ± 92.4 ms and 1262.4 ± 53.6ms and T2 of 80.1±11.9 ms and 89.5 ± 1.4 ms using bi-exponential fitting. SD of adipose tissue reduced from 25.4 ms to 1.5 ms for T1 and from 2.2 ms to 0.3 ms for T2 using the mono-exponential fitting, when SNR changed from 100 to 1500 (Figure 3c, 3d). SD of the two copartments reduced from 220.3 ms and 41.1 ms to 9.3 ms and 1.8 ms in T1, and from 36.9 ms and 6.4 ms to 2.4 ms and 0.7 ms in T2 using bi-exponential fitting (W1 = 0.1, W2 = 0.9) (Figure 3e, 3f). At (W1=W2=0.5), the higher SNR produced the least SD (Figure 4).Discussion
Both T1 and T2 present Gaussian distribution under the influence of Gaussian noise, with spread increase with the nominal relaxation time. Although the bi-exponential fitting provided a more accurate finding at equal weighting between the two compartments, a highly imbalanced partition between two compartments may result in a nuisance output for the minority compartment. Although bi-exponential fitting may report a lower residual error, this might be the result of overfitting noise components as a nuisance compartment also seen in this article[5].Conclusion
The precision of T1 and T2 improves with increasing SNR for both mono- and bi-exponential fitting. Mono-exponential fitting performs better at one dominant tissue, while bi-exponential fitting performs better at equal partition.Acknowledgements
The authors would like to thank Prof Andy Welch and Dr Hugh Seton for managerial support, and Ms Eleanor Hutcheon for administrative support.
References
1. J, Y., OL, W., st al. Statistical assessment of bi-exponential diffusion-weighted imaging signal characteristics induced by intravoxel incoherent motion in malignant breast tumors. Quantitative imaging in medicine and surgery. 2016
2. Miles Evans. Quantifying tissue compartment metrics from MRI breast cancer scans using multi-exponential relaxometry. MSc in Advanced Biomedical Imaging. 2020.
3. EDDEN, R. A. E., SMITH, S. A. & BARKER, P. B. Longitudinal and multi-echo transverse relaxation times of normal breast tissue at 3 Tesla. Journal of Magnetic Resonance Imaging. 2010. 32. 982-987.
4. MENG, T., HE, N., HE, H., LIU, K., KE, L., LIU, H., ZHONG, L., HUANG, C., YANG, A., ZHOU, C., QIAN, L. & XIE, C. The diagnostic performance of quantitative mapping in breast cancer patients: a preliminary study using synthetic MRI. Cancer Imaging, 2020.
5. HUANG, C., GALONS, J.-P., GRAFF, C. G., CLARKSON, E. W., BILGIN, A., KALB, B., MARTIN, D. R. & ALTBACH, M. I. Correcting partial volume effects in biexponential T2 estimation of small lesions. Magnetic Resonance in Medicine, 2015 73, 1632-1642.
Figures