0607
Reduced Field-of-View Intravoxel Incoherent Motion of the Human Pancreas Reflects Biphasic Response to Glucose Ingestion1Oden Institute for Computational Engineering and Sciences, The University of Texas at Austin, Austin, TX, United States, 2Livestrong Cancer Institutes, The University of Texas at Austin, Austin, TX, United States, 3Department of Diagnostic Medicine, The University of Texas at Austin, Austin, TX, United States, 4Department of Oncology, The University of Texas at Austin, Austin, TX, United States, 5Department of Biomedical Engineering, The University of Texas at Austin, Austin, TX, United States, 6Department of Imaging Physics, The University of Texas MD Anderson Cancer Center, Houston, TX, United States
Synopsis
Monitoring of the pancreatic islet is needed to assess individuals at risk for developing diabetes and facilitate development of islet-directed therapies. Pancreatic islets may be detectable due to their high vascularity. We imaged pancreas perfusion using both whole field-of-view and reduced field-of-view Intravoxel Incoherent Motion (IVIM) and found that the reduced field-of-view technique achieved similar image quality in half the time. We then performed a reduced field-of-view IVIM acquisition on four healthy controls. We found that pancreas perfusion increased dynamically in response to oral glucose challenge, exhibiting a biphasic increase that parallels the time course of insulin secretion.
Introduction
Diabetes is caused by insufficient insulin production from the beta cells of the pancreatic islet, either due to autoimmune destruction of these cells (type 1 diabetes) or loss of insulin sensitivity (type 2 diabetes). Noninvasive assessment of the mass or function of pancreatic islets is needed to predict the incidence and/or progression of diabetes and evaluate novel therapeutics intended to improve islet function. These efforts have been hampered by a lack of intrinsic contrast in pancreatic islets and their small size (50 – 200 mm). However, islets are highly vascularized and demonstrate glucose-dependent alterations in blood flow [1]. MRI has detected alterations in pancreatic blood flow in response to glucose ingestion using arterial spin labeling (ASL) [2] or IVIM in porcine models [3]. This work employs IVIM MRI to longitudinally image pancreas blood flow dynamics in response to a glucose challenge and evaluates the benefit of reduced field-of-view (FOV) excitation in making these measurements.Methods
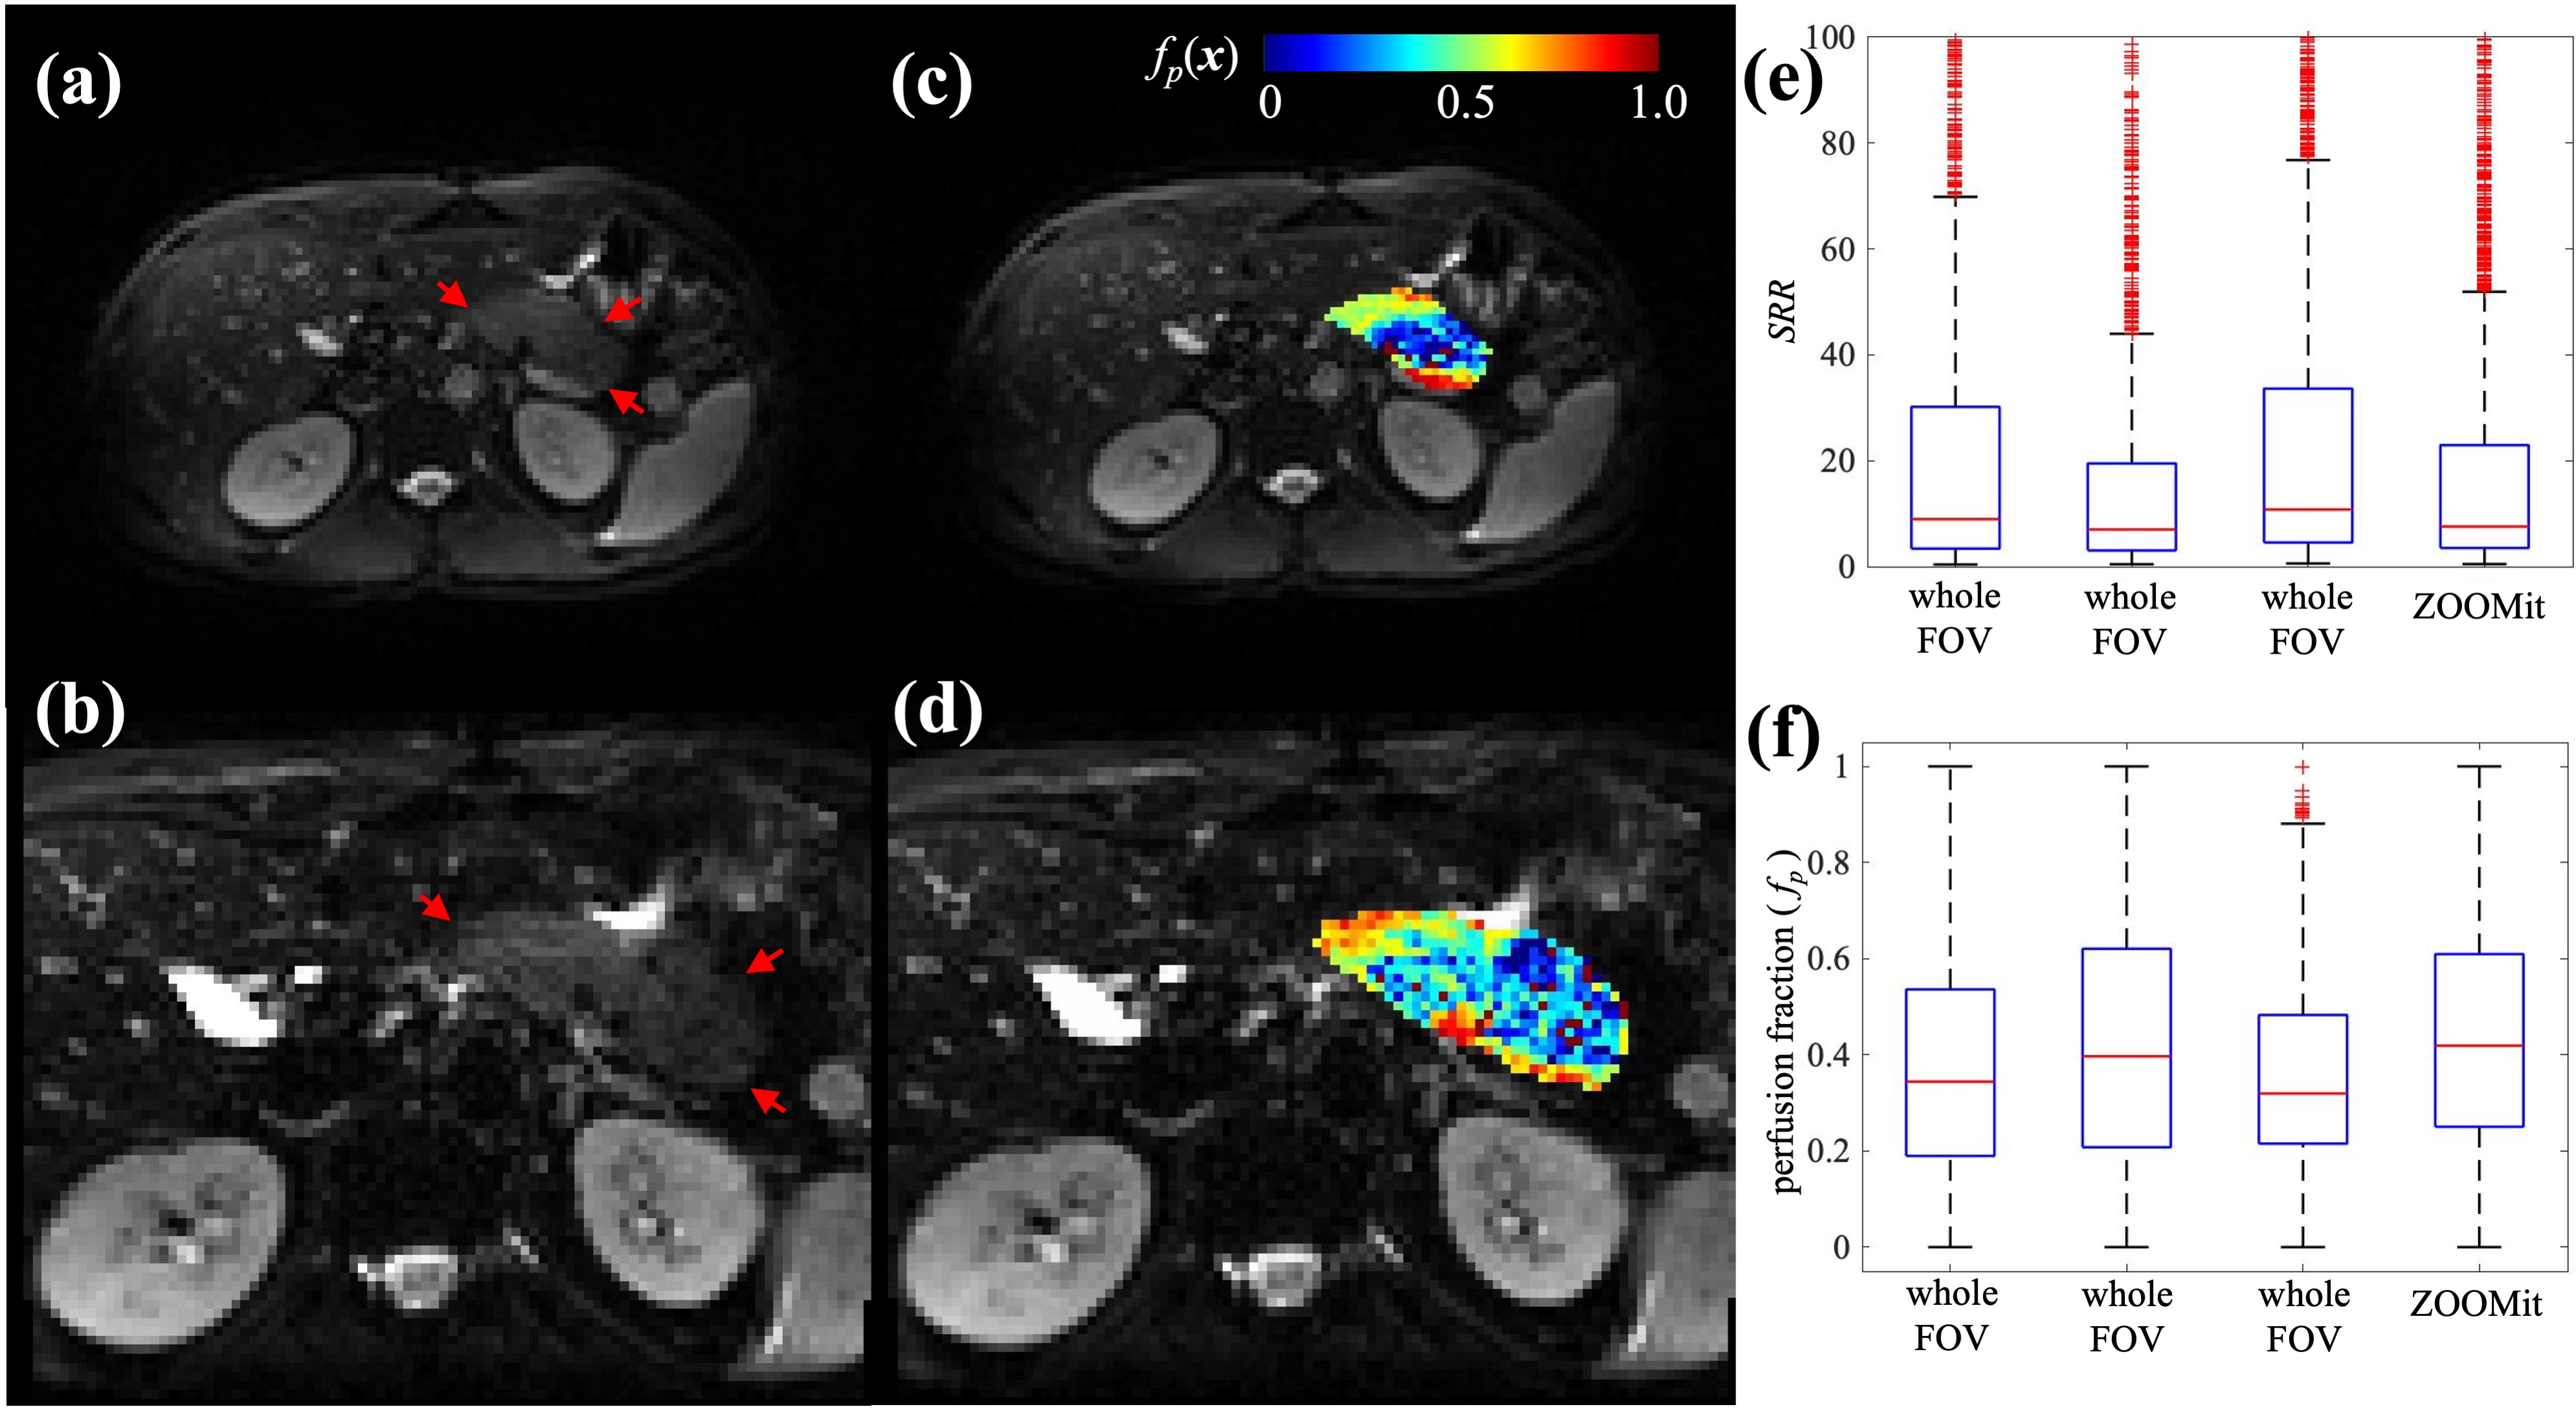
Four subjects with no known pancreas pathology were recruited for pancreas MR imaging. MRI scans were performed using a 3T Siemens Vida scanner (Erlangen, Germany) equipped with an 18-channel abdominal coil (Siemens). During each MRI scan, multiple diffusion-weighted imaging (DWI) series were collected before and after glucose consumption (30g glucose, Transcend Foods, Colorado, USA). Subjects ingested the glucose gel in the scanner to minimize pancreas movement. A fat-suppressed, single-shot spin-echo sequence with 2D echo-planar read-out was used for the pancreas DWI with b = 0, 20, 50, 70, 100, 200, 800 s/mm2 and no motion compensation. Two protocols were tested. The first used the whole FOV acquisition (Figure 1a), with the following parameters: TR/TE/FA = 8100ms/44ms/90°, FOV = 312×384 mm2, acquisition matrix = 104×128, slice spacing = 4.8 mm, 40 slices, GRAPPA acceleration factor = 3. The second used (Figure 1b) the reduced FOV excitation (ZOOMit, Siemens) with the following parameters: TR/TE/FA = 4300ms/78ms/90°, FOV = 173×213 mm2, acquisition matrix = 78×96, slice spacing = 4.8 mm, 20 slices.All image processing was performed in MATLAB (Mathworks, Natick, MA). The pancreas was manually segmented for each DWI series using the b = 0 s/mm2 image. Pancreas perfusion was assessed using the IVIM technique. Specifically, the variable b-value data are fit to a bi-exponential model [4] to estimate perfusion on a voxel-by-voxel basis,
S(x,b) = S0(x)(fp(x)e–b(D(x)+P(x)) + (1–fp(x))e–bD(x)), (1)
where S(x,b) is the DWI signal intensity obtained with the diffusion-encoding gradient of b at the voxel position x, S0(x) is a scalar describing proton density and scanner gain settings, fp(x), D(x), and P(x) are the perfusion fraction, true diffusion and perfusion related “pseudo-diffusion” at x, respectively. To compare the IVIM acquisition-analysis quality across series, especially ones collected with different protocols, we define the voxel-wise signal-to-residual ratio (SRR) as following,
SRR(x,b) = S*(x,b)/R(x,b), with R(x,b) = |S(x,b)–S*(x,b)|, (2)
where S*(x,b) is the fitted DWI signal intensity revealed by Eq. (1), and R(x,b) is the absolute bias of the IVIM model fitting. The results in each series are given as the median and interquartile range.
Results
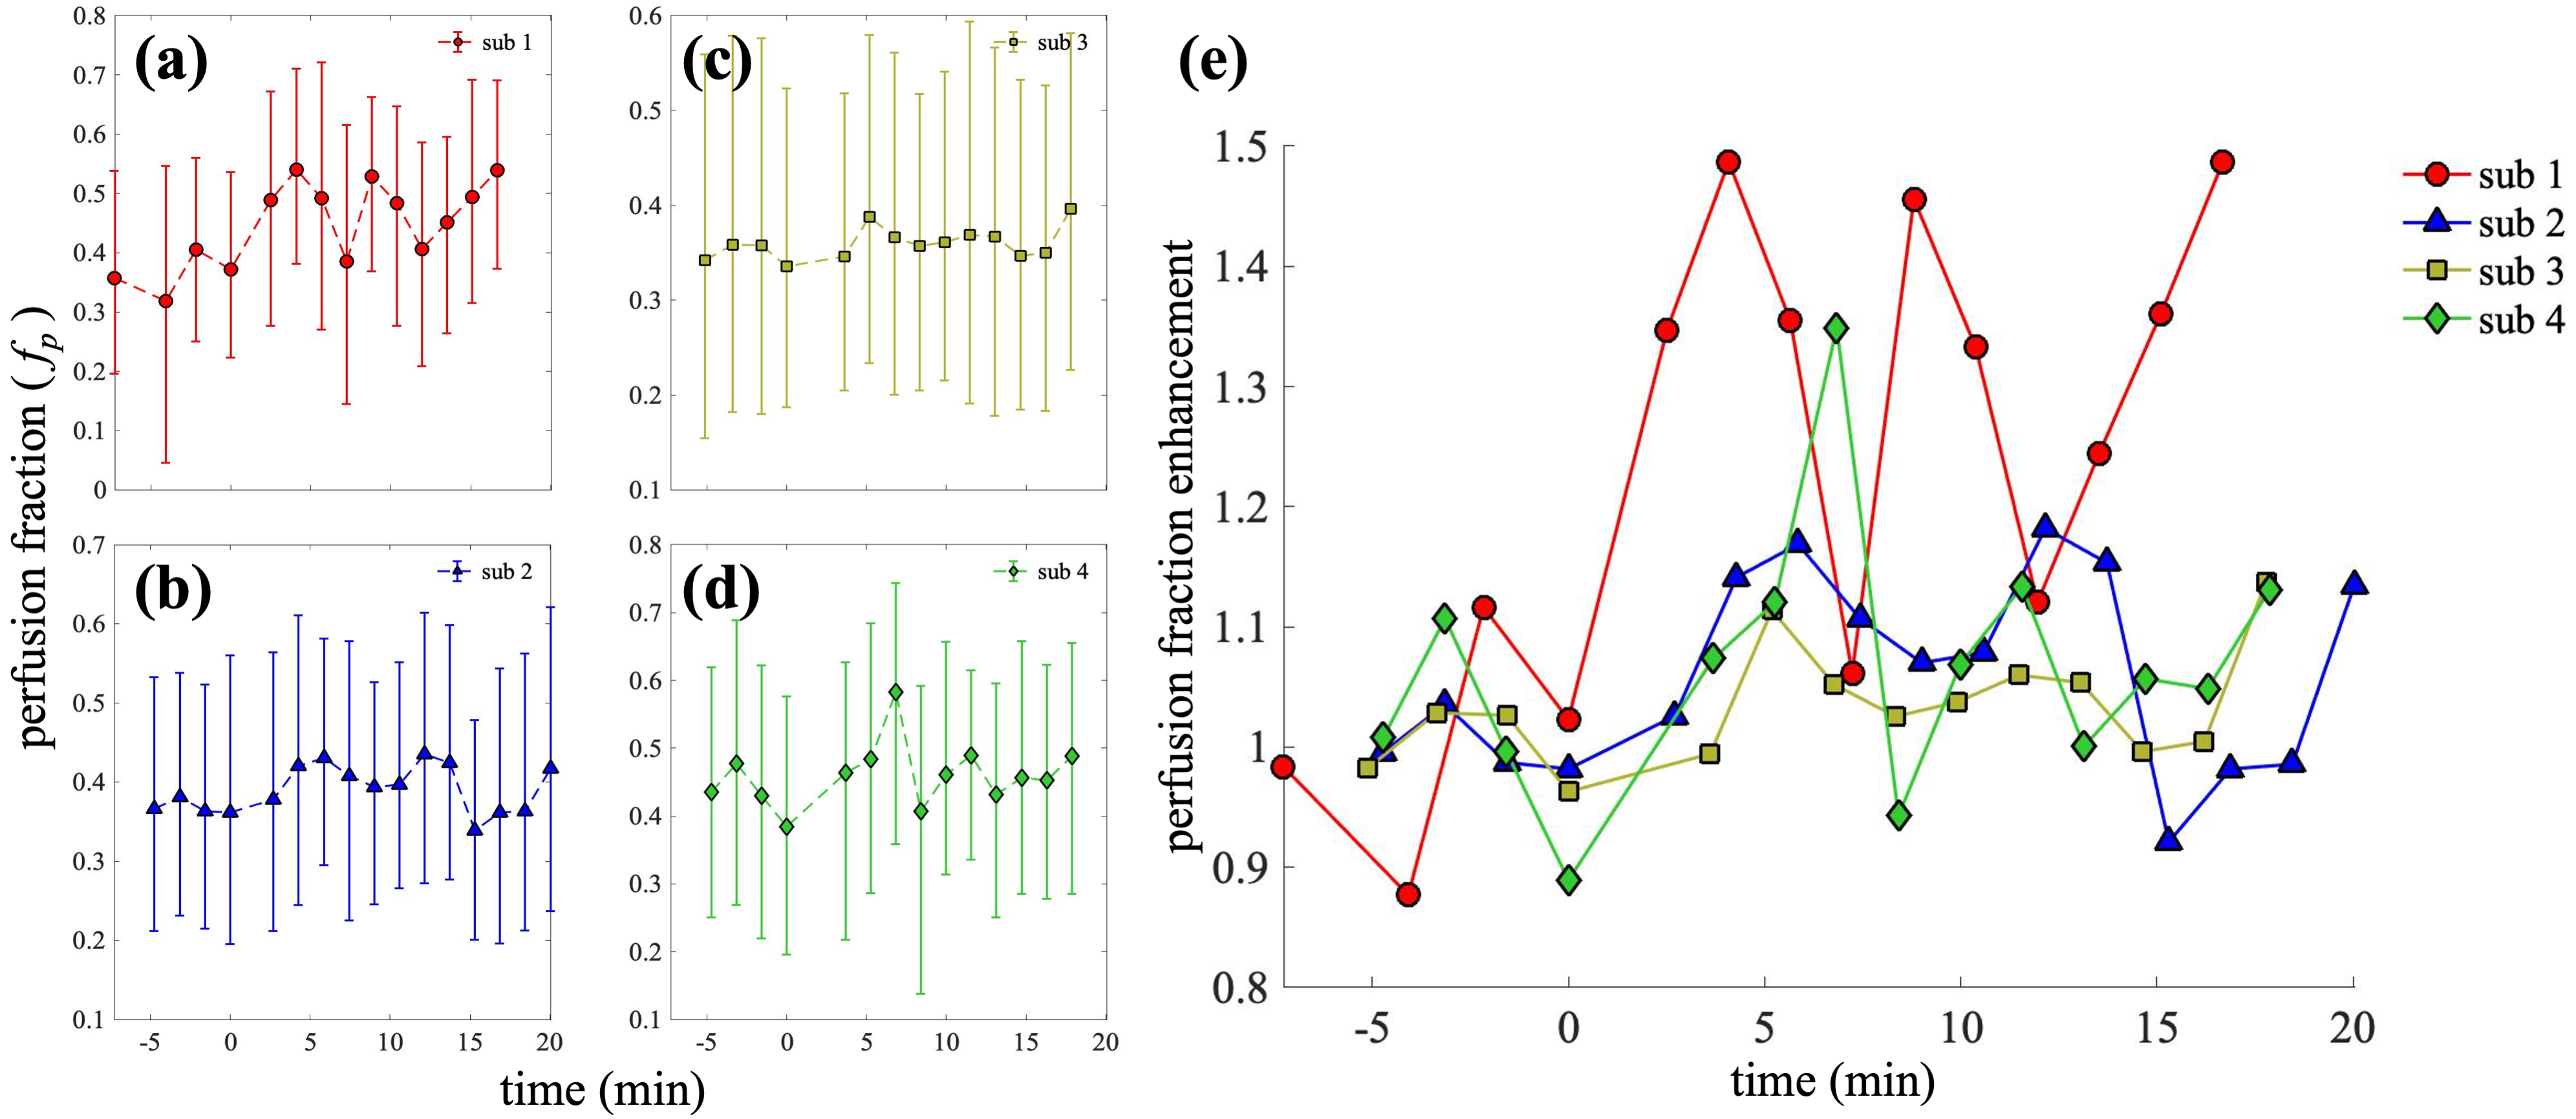
Two pancreas IVIM acquisition protocols were compared in one visit of a subject (Figure 1). Compared to the whole-FOV acquisition, the ZOOMit acquisition achieves higher in-plane spatial resolution (2.22×2.22 mm2 vs. 3×3 mm2) and higher temporal resolution (96s vs. 190s), while preserving similar image quality. Specifically, the three repeats of whole-FOV acquisition result in the median SRRs of 8.97, 6.99, 10.79, and the ZOOMit SRR is 7.57 (Figure 1e). The baseline perfusion estimated from the three whole-FOV IVIMs have the medians of 0.34, 0.40, and 0.32, while perfusion estimated from the ZOOMit IVIM has a median of 0.42 (Figure 1f). These observations indicate that the ZOOMit protocol is a better option for monitoring the dynamics of pancreas perfusion change as it provides similar estimates of perfusion to whole-FOV acquisition in half the acquisition time and 26% higher spatial resolution.Using the ZOOMit pancreas IVIM protocol, changes in pancreas perfusion in response to oral glucose consumption were obtained in four healthy subjects. As revealed in Figure 2, the observed dynamics of pancreas perfusion show a consistent pattern across the subjects: The first-phase enhancement of perfusion consists of an immediate peak (increasing by 11.39% – 48.68% compared to the baseline) observed between 4.07 – 6.84 min post-glucose and a second peak (increasing by 6.00% – 45.60%.) observed between 8.81 – 12.15 min pose-glucose. The time courses end at the beginning of the second-phase enhancement (16.68 – 20.02 min post-glucose), which reveals a perfusion increase of 13.11% - 48.67%. These results match with known biphasic dynamics of insulin release [5].
Discussion and Conclusions
These experiments demonstrate that alterations in pancreas perfusion can be detected non-invasively using IVIM. Reduced-FOV techniques increase the spatial and temporal resolution of perfusion measurements while preserving the image quality as well as the calculated perfusion values in the pancreas. Rapid imaging is needed to image changes in pancreas perfusion in response to glucose ingestion, as the pancreas displays biphasic response to glucose stimulus. Importantly, loss of the first phase of insulin response to glucose is an early indicator of type 2 diabetes [6]. Thus, application of this technique may identify individuals at risk of developing diabetes.Acknowledgements
This work was supported by the NIDDK (R03DK129979 and U24DK097771), the Thomas J. Beatson Jr. Foundation (#2021-003), and CPRIT (RR160005). T.E.Y. is a CPRIT Scholar in Cancer Research.References
[1] Nyman LR, Ford E, Powers AC, Piston DW. Glucose-dependent blood flow dynamics in murine pancreatic islets in vivo. Am J Physiol Endocrinol Metab. 2010;298(4):E807-14.
[2] Taso M, Papadopoulou F, Smith MP, Tsai LL, Mortele KJ, Alsop DC. Pancreatic perfusion modulation following glucose stimulation assessed by noninvasive arterial spin labeling (ASL) MRI. Journal of Magnetic Resonance Imaging. 2020;51(3):854-60.
[3] Espes D, Manell E, Rydén A, Carlbom L, Weis J, Jensen-Waern M, Jansson L, Eriksson O. Pancreatic perfusion and its response to glucose as measured by simultaneous PET/MRI. Acta Diabetol. 2019;56(10):1113-1120.
[4] D Le Bihan, E Breton, D Lallemand, P Grenier, E Cabanis, M Laval-Jeantet. MR imaging of intravoxel incoherent motions: application to diffusion and perfusion in neurologic disorders. Radiology. 1986;161(2):401-7.
[5] Curry DL, Bennett LL, Grodsky GM. Dynamics of insulin secretion by the perfused rat pancreas. Endocrinology 1968. 83, 572-584.
[6] Brunzell J, Robertson R, Lerner R, Hazzard W, Ensinck J, Bierman E, Porte D Jr. Relationships between fasting plasma glucose levels and insulin secretion during intravenous glucose tolerance tests. J Clin Endocrinol Metab 1976. 42:222–229.
Figures