0606
Dynamics of insulin secretion and pancreatic blood-flow: a simultaneous ASL perfusion imaging / hyperglycemic clamp study1Division of MRI Research, department of Radiology, Beth Israel Deaconess Medical Center, Harvard Medical School, Boston, MA, United States, 2Division of Endocrinology, Diabetes and Hypertension, Brigham and Women's Hospital, Harvard Medical School, Boston, MA, United States
Synopsis
Loss of β-cell function and mass are hallmarks of type-1 and type-2 diabetes. Non-invasive imaging of endocrine pancreatic function would provide valuable insights into the degree and temporal patterns of endocrine dysfunction. For this purpose, Arterial Spin Labeling (ASL) is a uniquely suited non-invasive technique. We therefore conducted a dynamic ASL study during a hyperglycemic clamp to explore the dynamics of insulin secretion and pancreatic blood-flow.
This study showed that hyperglycemia and arginine-stimulated insulin secretion causes an increase in pancreatic perfusion and that the rate of insulin concentration change seems to be driving perfusion changes rather than absolute concentration.
Introduction
Loss of β-cell function and mass are hallmarks of type 1 and type 2 diabetes. Non-invasive imaging of endocrine pancreatic function would provide valuable insights into the degree and temporal patterns of endocrine dysfunction. Knowing that islets receive a major portion of total pancreatic flow (1,2) and that their activity is tightly linked to insulin secretion, pancreatic blood-flow could offer surrogate markers of endocrine functional integrity. For this purpose, Arterial Spin Labeling (ASL) is a uniquely suited non-invasive technique. Although challenging because of motion and short T1, pancreatic ASL has been successfully performed and pioneering studies have evaluated pancreatic flow at rest (3) and during exocrine (4) and oral endocrine (5) stimulation, though with significant limitations. The gold-standard method for evaluating insulin secretory capacity is the hyperglycemic clamp (6), in which a high glucose level is maintained through a continuing IV infusion of glucose. We therefore conducted a dynamic ASL study during a hyperglycemic clamp to explore the dynamics of insulin secretion and pancreatic blood-flow.Methods
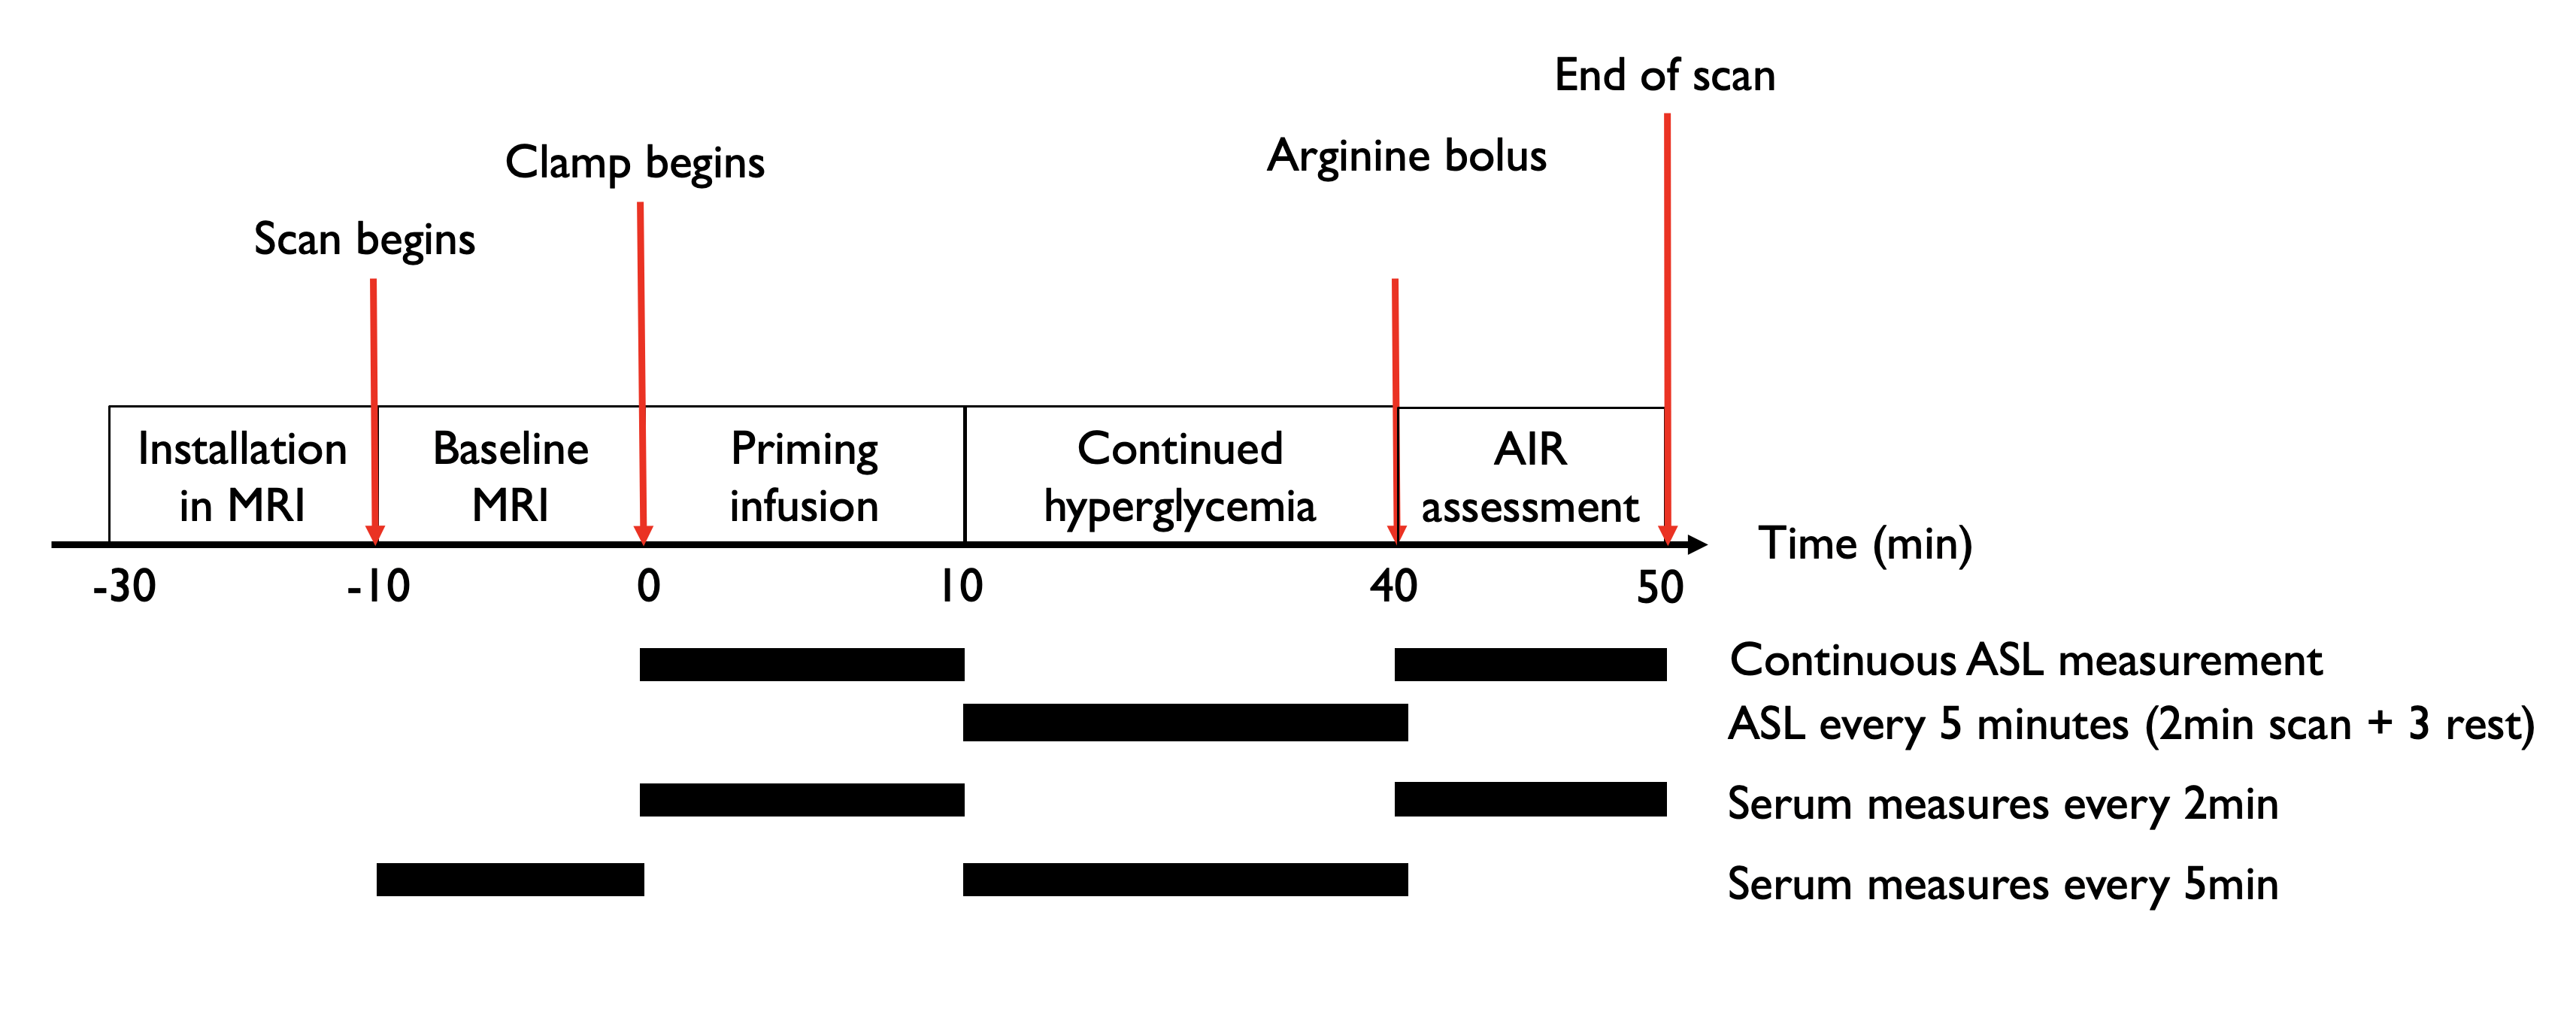
12 healthy volunteers (29 ± 5yo, balanced gender, BMI = 24±3 kg/m2, HbA1c = 5.1±0.3%) were enrolled in this prospective study. The simultaneous clamp/MRI procedure was performed after an overnight fast. Scans were performed at 3T (GE Discovery MR750) using a 32-ch body array. The flowchart of the simultaneous clamp/MRI is shown in Fig1.Clamp : At T=0min, a primed-continuous IV infusion of 20% dextrose was initiated to raise plasma glucose levels to 100mg/dl above baseline over 10min (Phase 1). From T=10min to T=40min, the hyperglycemic state was maintained through adjustment of the infusion rate every 5 minutes based on a negative feedback approach (Phase 2) (6). At T=40min, a bolus of 5g of arginine was injected to measure the maximum insulin secretory capacity (Phase 3). Frequency of MRI and serum measurements is shown in Figure 1.
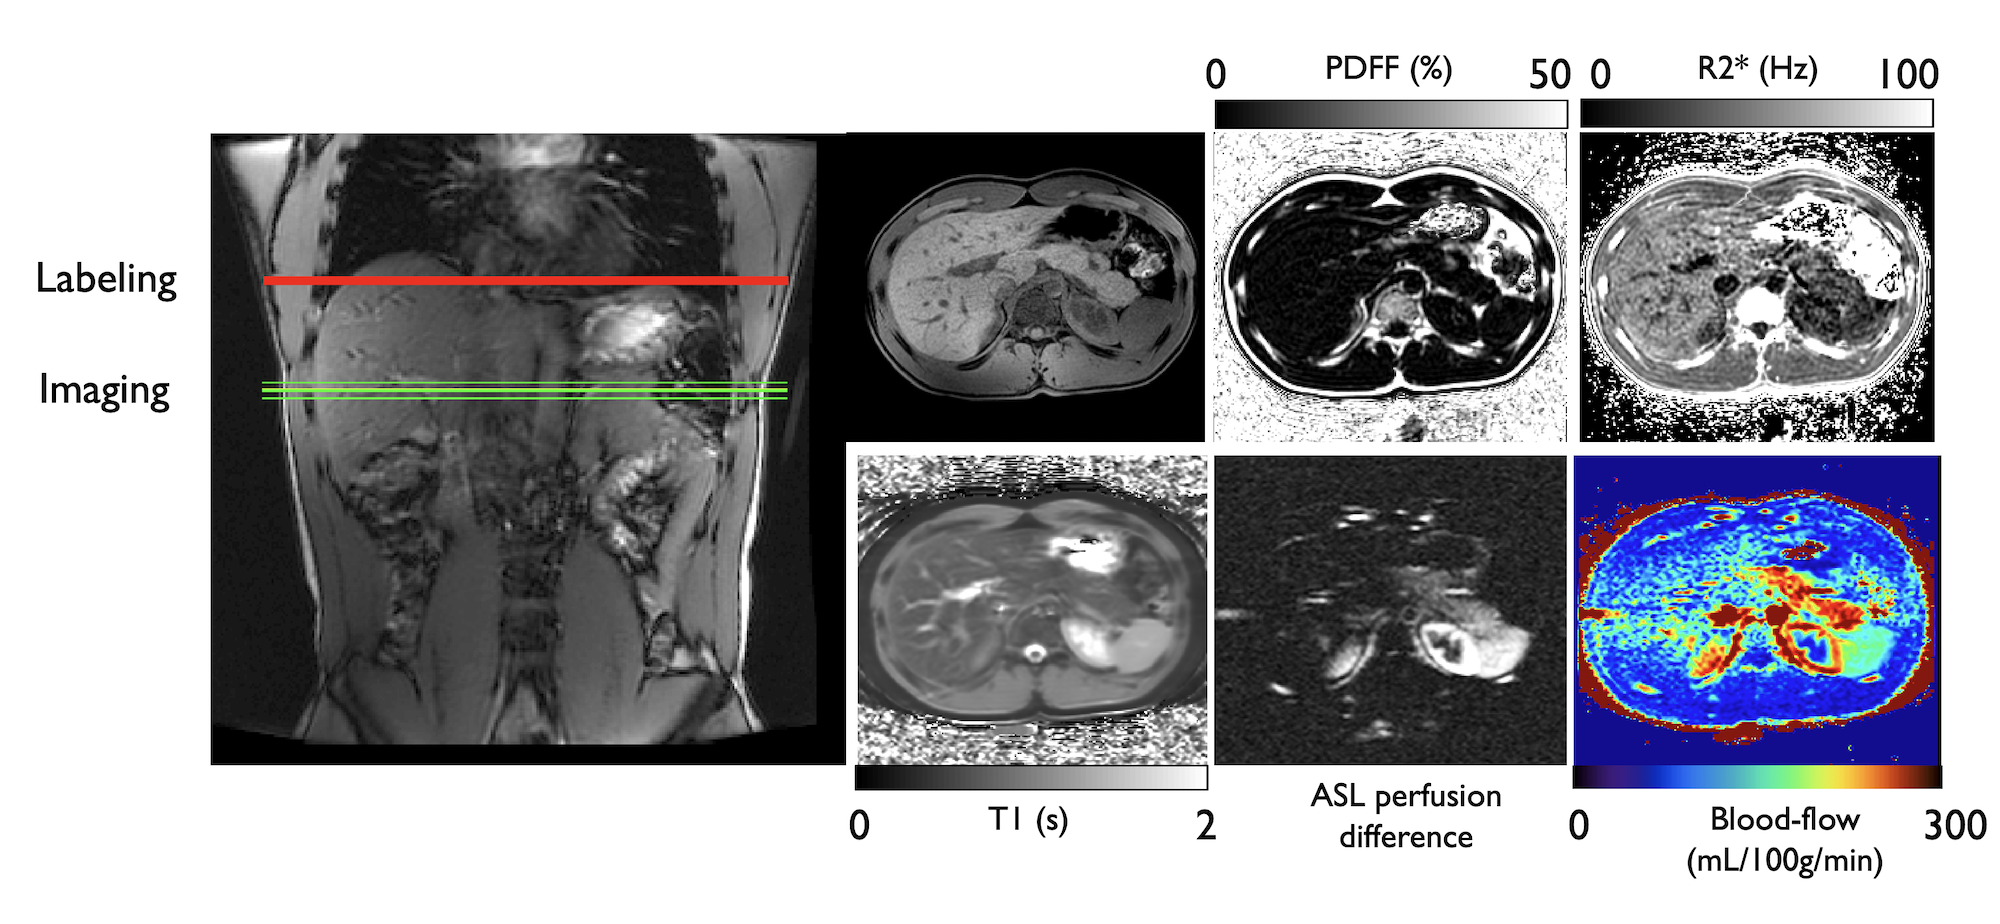
Imaging : Baseline imaging included axial 2-point Dixon (LAVA-Flex) and PDFF/T2* measurement (IDEAL-IQ), as well as single-slice FS-T2-SSFSE for ASL positioning. Two baseline ASL measures were collected prior to starting the clamp. During the clamp, ASL data were acquired at time-points matching serum measures as seen in Fig1. All perfusion data were acquired with an axial single-slice background-suppressed unbalanced PCASL-SSFSE sequence (labeling/PLD =1.5/1s,B1av=1.4uT,Gmax/Gav=3.5/0.5mT/m,TR/TE=7000/36ms, 10-mm thickness). The labeling plane was positioned and adjusted 5-6cm above the imaging slice to label descending aortic blood. Each acquisition took 2.5min and was performed with a timed-breathing approach. A typical individual dataset is shown in Figure 2.
Analysis : All images were reconstructed on the scanner, providing quantitative blood-flow maps calculated using a two-compartment kinetic model. A single ROI was drawn in the pancreas at each time-point to calculate a total pancreatic flow. We studied group-averaged time-curves for the various serum measures and pancreatic blood-flow. For statistics, we performed a Granger causality test between blood-flow, glucose, insulin and C-peptide concentration as well as their 1st order time-derivative, with a significance set at p<0.05 and a max lag of 3 time-points. We also calculated Pearson correlations between baseline flow and HbA1c, fasting glucose and BMI.
Results and Discussion
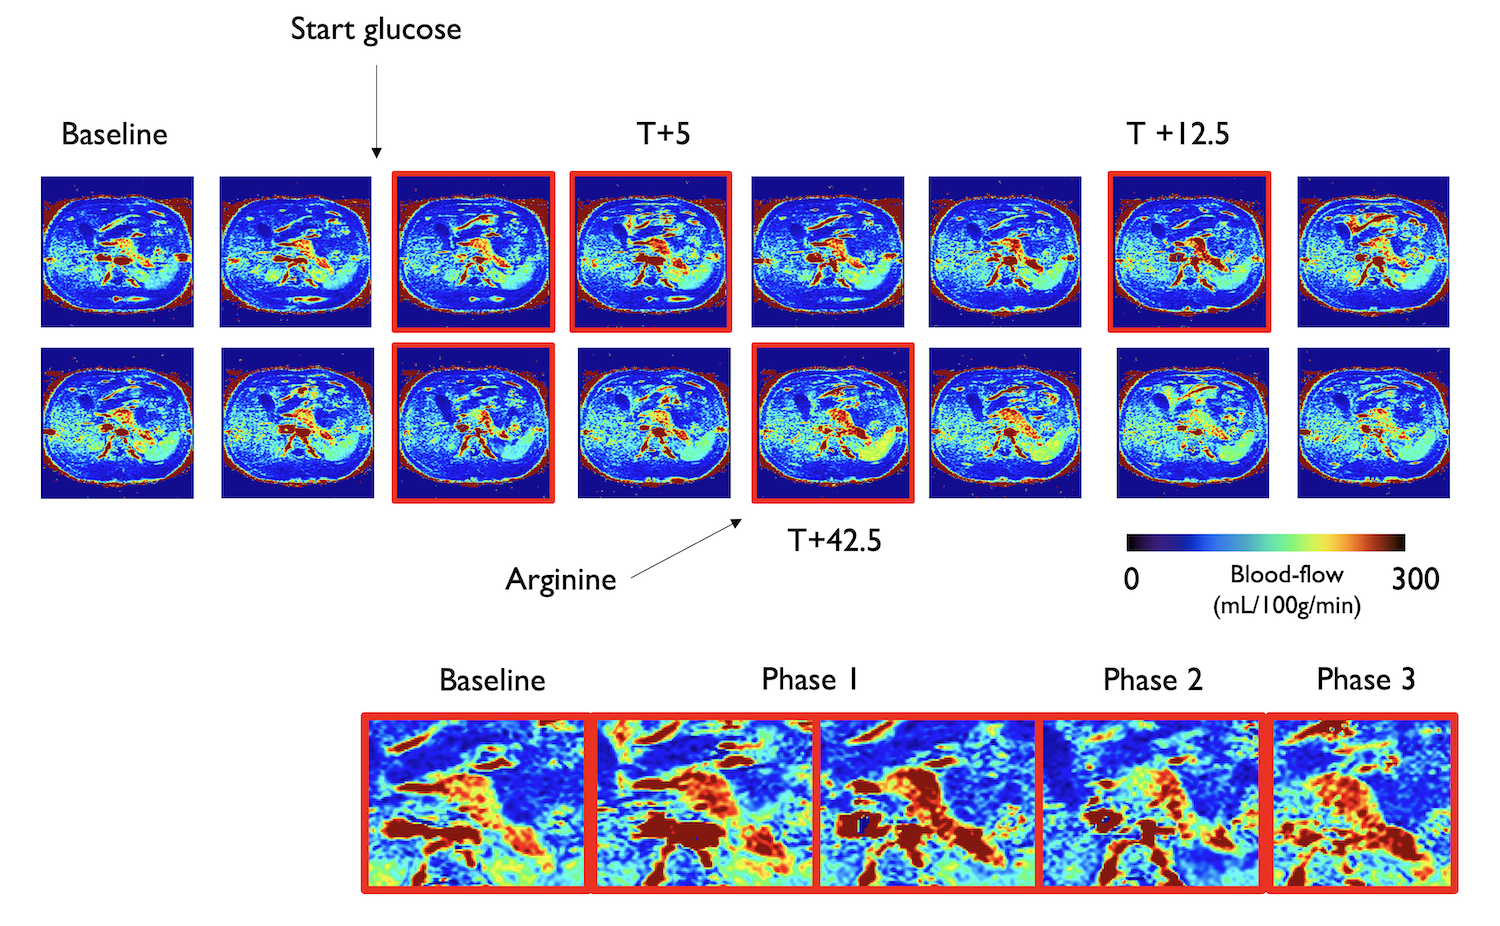
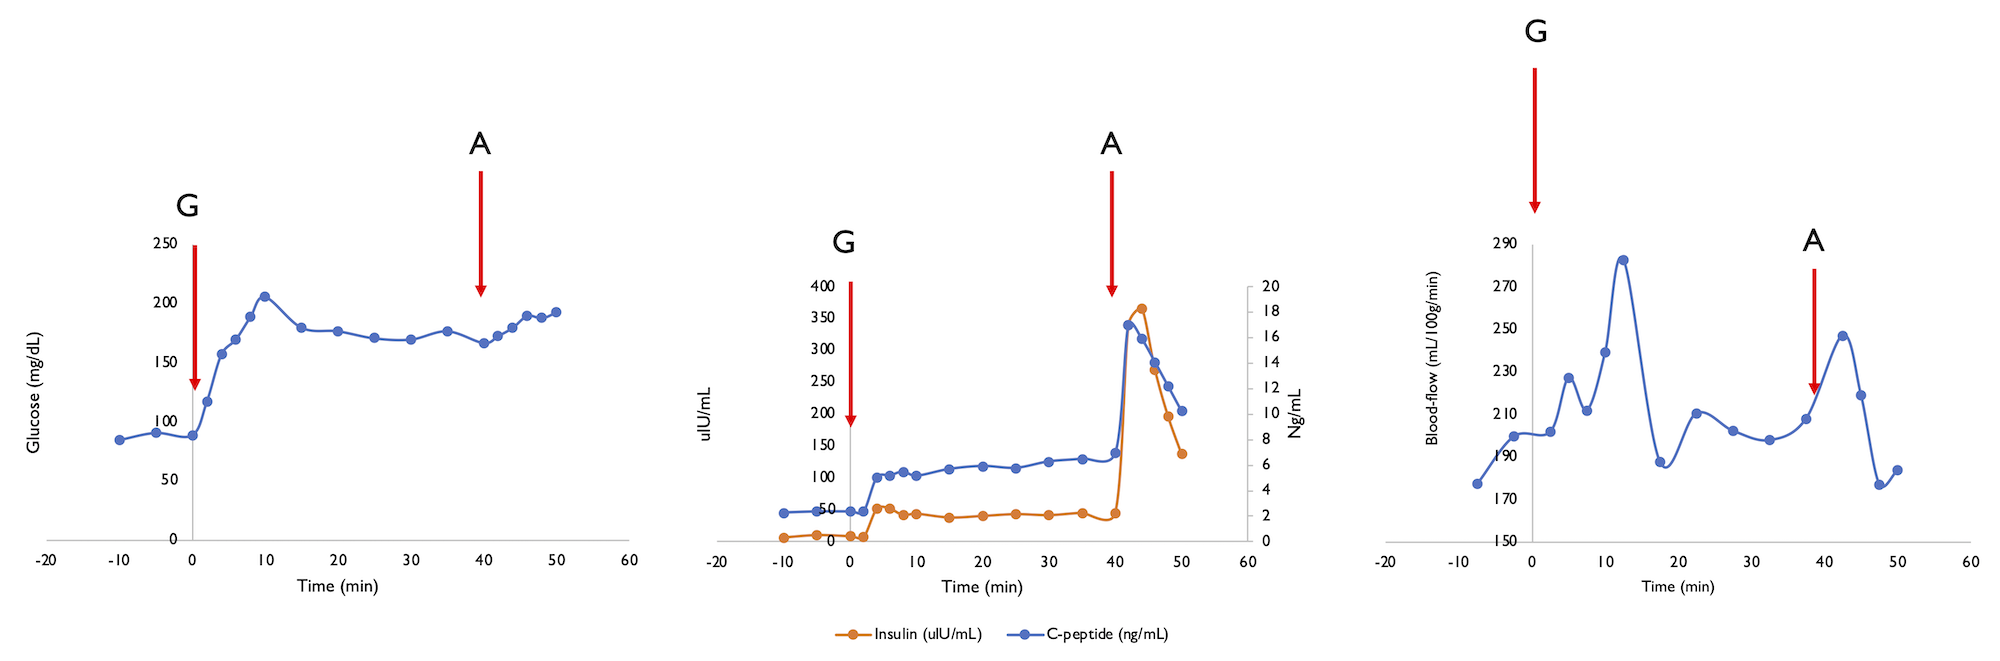
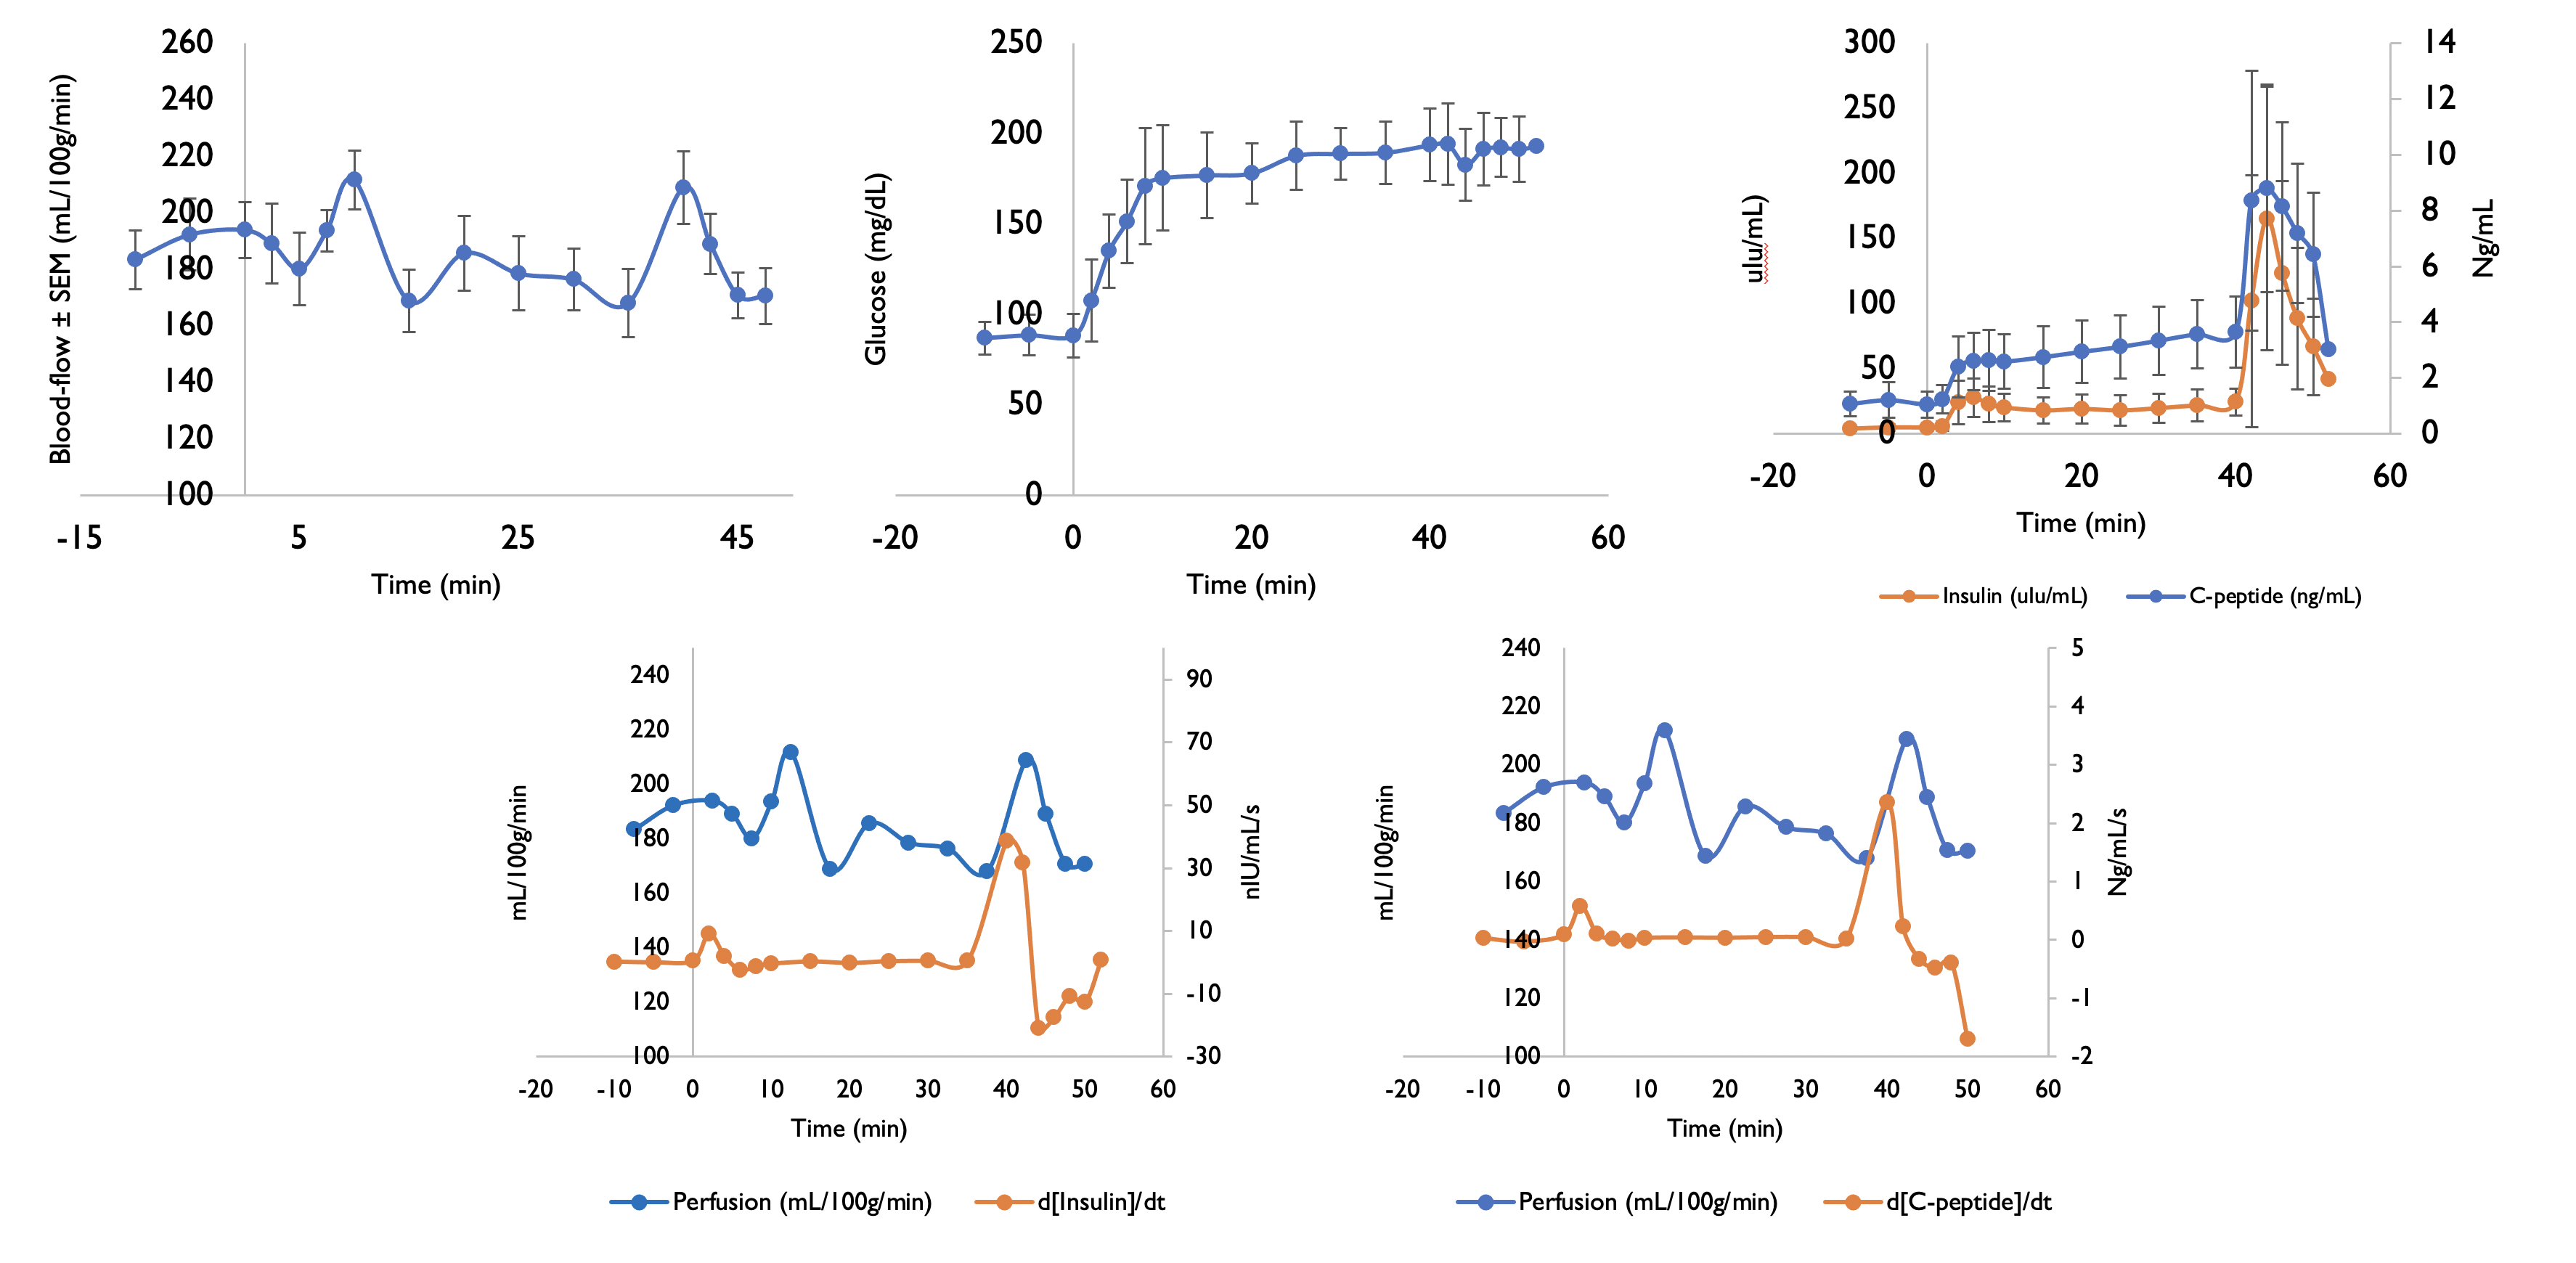
An individual ASL time-series is shown in Fig3, accompanied by blood-flow/serum time-curves in Figure 4. We can observe two increases in pancreatic blood-flow after the initial glucose infusion and arginine injection while the blood-flow returns to baseline during phase 2. Moving from single-subject to group-averages confirmed those observations as seen in Figure 5. While we could not observe any direct causal relationship between glucose, insulin or C-peptide concentration and pancreatic blood-flow, the time-derivative of C-peptide and insulin concentrations, reflective of variations in insulin secretion, was found to cause a delayed increase of pancreatic blood-flow (p=0.03 and 0.04 for d[C-peptide]/dt and d[Insulin]/dt).Interestingly, while the magnitude of blood-flow increase is similar for the glucose infusion and arginine infusion, the delay between maximal d[C-peptide]/dt and blood-flow seem to differ (12min vs 2min). Furthermore, we found a trend towards a correlation between BMI and basal blood-flow (r=-0.51,p=0.08) similar to earlier results (5).Conclusions
While the underlying mechanisms are not fully elucidated, this study showed that:- hyperglycemia and arginine-stimulated insulin secretion causes an increase in pancreatic perfusion
- the rate of insulin concentration change seems to be driving perfusion changes rather than absolute concentration
However, technical limitations (single-slice acquisition) and potential for significant intra/inter-subject variability should be considered when interpreting results.We nonetheless have shown the potential of ASL for physiological studies in the pancreas, a new area of potential development with significant implications for studies of the natural history of β-cell mass and function in diabetes.. Realizing the full potential of the technique requires additional developments, such as volumetric acquisitions for pancreatic imaging so as to enable regional studies of pancreatic function.
Acknowledgements
No acknowledgement found.References
1. Jansson L, Barbu A, Bodin B, et al. Pancreatic islet blood flow and its measurement. Ups. J. Med. Sci. 2016;121:81–95 doi: 10.3109/03009734.2016.1164769.
2. Jansson L. The regulation of pancreatic islet blood flow. Diabetes. Metab. Rev. 1994;10:407–416 doi: 10.1002/dmr.5610100405.
3. Taso M, Guidon A, Zhao L, Mortele KJ, Alsop DC. Pancreatic perfusion and arterial-transit-time quantification using pseudocontinuous arterial spin labeling at 3T. Magn. Reson. Med. 2019;81:542–550 doi: 10.1002/mrm.27435.
4. Cox EF, Smith JK, Chowdhury AH, Lobo DN, Francis ST, Simpson J. Temporal assessment of pancreatic blood flow and perfusion following secretin stimulation using noninvasive MRI. J. Magn. Reson. Imaging JMRI 2015;42:1233–1240 doi: 10.1002/jmri.24889.
5. Taso M, Papadopoulou F, Smith MP, Tsai LL, Mortele KJ, Alsop DC. Pancreatic perfusion modulation following glucose stimulation assessed by noninvasive arterial spin labeling (ASL) MRI. J. Magn. Reson. Imaging 2020;51:854–860 doi: 10.1002/jmri.26899.
6. DeFronzo RA, Tobin JD, Andres R. Glucose clamp technique: a method for quantifying insulin secretion and resistance. Am. J. Physiol.-Endocrinol. Metab. 1979;237:E214 doi: 10.1152/ajpendo.1979.237.3.E214.
Figures