0604
The association of Liver Stiffness with Liver tissue T1 and Superior Mesenteric Artery blood flow across disease severity.
1Sir Peter Mansfield Imaging Centre, University of Nottingham, Nottingham, United Kingdom, 2NIHR Biomedical Research Centre, Nottingham University Hospitals NHS Trust, Nottingham, United Kingdom
Synopsis
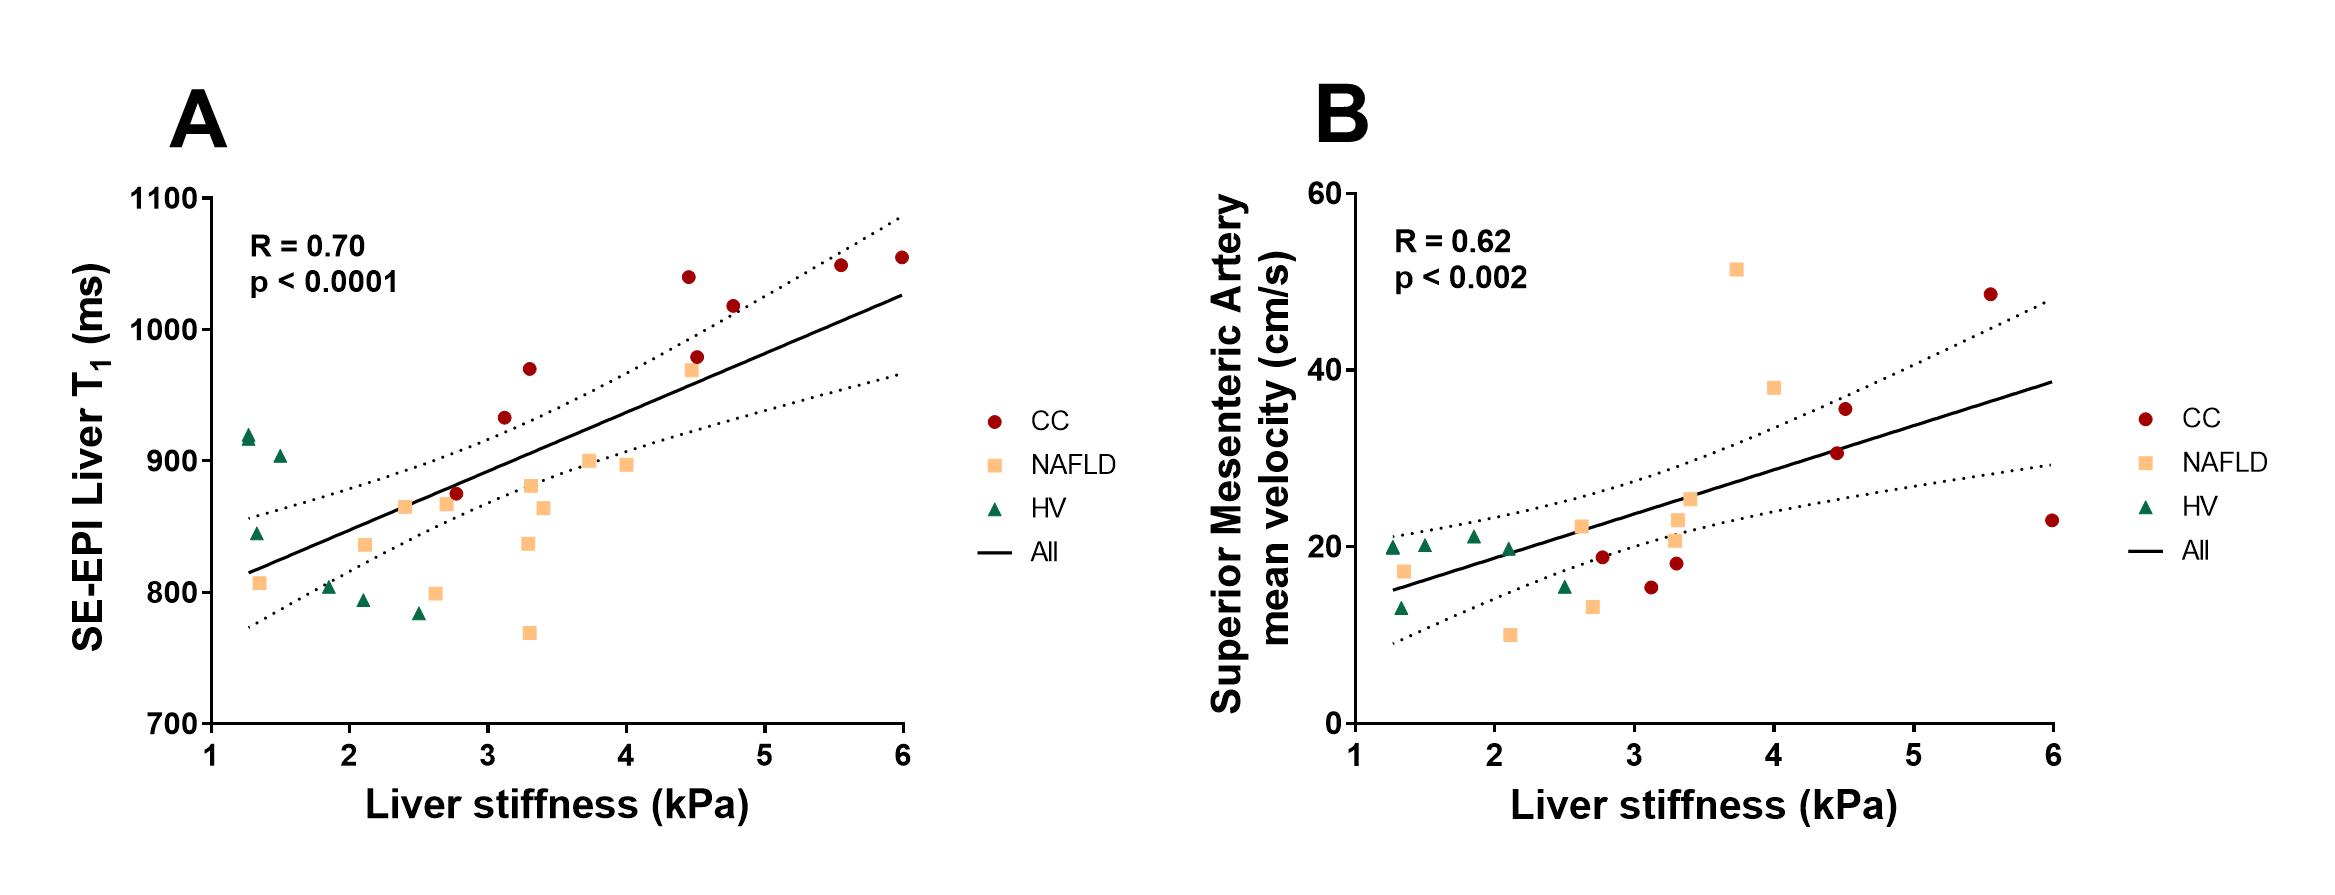
We assess liver stiffness measured using magnetic resonance elastography (MRE) and longitudinal relaxation time T1 in three groups: healthy volunteers, non-alcoholic fatty liver disease patients and compensated cirrhosis patients. MRE liver stiffness was measured using the Quantitative Imaging Biomarker Alliance (QIBA) recommendation. T1 longitudinal relaxation time of the liver was measured using a respiratory triggered inversion recovery fat-suppressed spin-echo echo planar imaging scheme. A positive correlation between Liver tissue T1 and Liver stiffness (R=0.70, p<0.0001) across the 3 groups was observed. Superior mesenteric artery flow also correlates with liver stiffness (R=0.62, p<0.002) suggesting worsening hyperdynamic circulation with progressive fibrosis.
Introduction
Magnetic resonance elastography (MRE) liver stiffness and liver longitudinal Relaxation time (T1) using a modified look-locker inversion recovery scheme (MOLLI) are becoming accepted biomarkers in clinical studies of liver disease1,2. Together liver tissue T1 measured with spin-echo echo planar imaging (SE-EPI) (microstructure) and superior mesenteric artery (SMA) flow (haemodynamics) have been shown to provide surrogate measures of portal pressure as measured by hepatic venous pressure gradient (HVPG)3. Here we assess the relationship between liver stiffness measured using 2D-GRE MRE, with measures of liver tissue T1 (comparing both SE-EPI and MOLLI T1 mapping methods) and SMA blood flow, and their link to liver disease severity.Methods
7 healthy volunteers (HV) (5M/2F, BMI 23.1±1 kg/m2, 24-27 years), 12 biopsy confirmed non-alcoholic Fatty Liver Disease (NAFLD) patients (5M/7F, BMI 34.1±5.6 kg/m2, 20-75years) and 7 biopsy confirmed compensated cirrhosis (CC) patients (aetiology: 3 NAFLD/2 ALD/2 HBV, BMI 31.3±4 kg/m2, 45-85 years) were recruited. Participants attended an MRI scan after an overnight fast.Data was collected on a 3T Philips Ingenia scanner. This included a 2D-GRE MRE measure using the Quantitative Imaging Biomarker Alliance (QIBA) recommendation (FOV 360x375mm2, voxel 1.5x4.5x10mm3, TE/TR=20/50ms, 4 axial slices, slice gap 1mm, 1 slice per 18s breath hold, 4 slices acquired) with vibrations applied at 60Hz4. Liver T1 was measured using a respiratory-triggered inversion recovery fat-suppressed SE-EPI scheme (9 axial slices, 3x3x8mm3 voxel, 10 inversion times between 100-1500ms, 58ms temporal slice spacing, ascending/descending slice order acquired in ~ 3 minutes)3 and a 5(3)3 native MOLLI T1 scheme5. Liver T2* maps were collected using a multi-echo fast-field echo (m-FFE) data acquired at 12 echo times (TE1=2.5ms, ΔTE=2.5ms, 9 axial slices, 3x3x8mm3 voxel). Fat fraction maps were acquired using the mDIXON Quant scheme. SMA flow was assessed using phase contrast MRI with VENC = 140cm/s6.
Data Analysis
Scanner computed elastograms provided maps of the spatial distribution of the shear stiffness in kPa, with confidence masks computed from voxels with confidence values >0.95. Manually drawn ROIs were created in accordance with the QIBA recommendations (within ~1 cm of liver boundary, including at least 500 voxels)4. Histogram analysis was then performed to assess the modal stiffness.SE-EPI liver T1 data was motion corrected and fit to generate a T1 map (MATLAB). MOLLI liver T1 maps, liver Tissue T2* maps and fat fraction maps were scanner computed. Manual ROIs were drawn on map images, avoiding large blood vessels, bile ducts, and edges of the liver parenchyma. Histogram analysis was performed and the mode of the distribution used to represent liver tissue T1, T2* and fat fraction. Q-flow software (Philips) provided an estimate of SMA velocity, flux, and cross-sectional area.
Statistical Analysis
Data was Shapiro-Wilk normality tested, correlations were assessed using a Pearson test. Multiple regression analysis was performed in 20 patients to assess the relationship between MRE with T1, fat fraction and T2*.Results
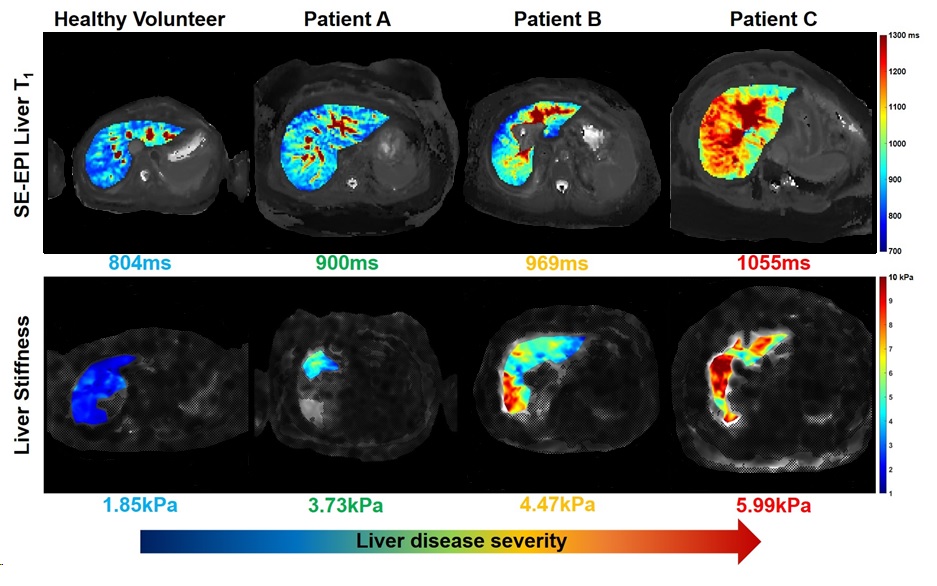
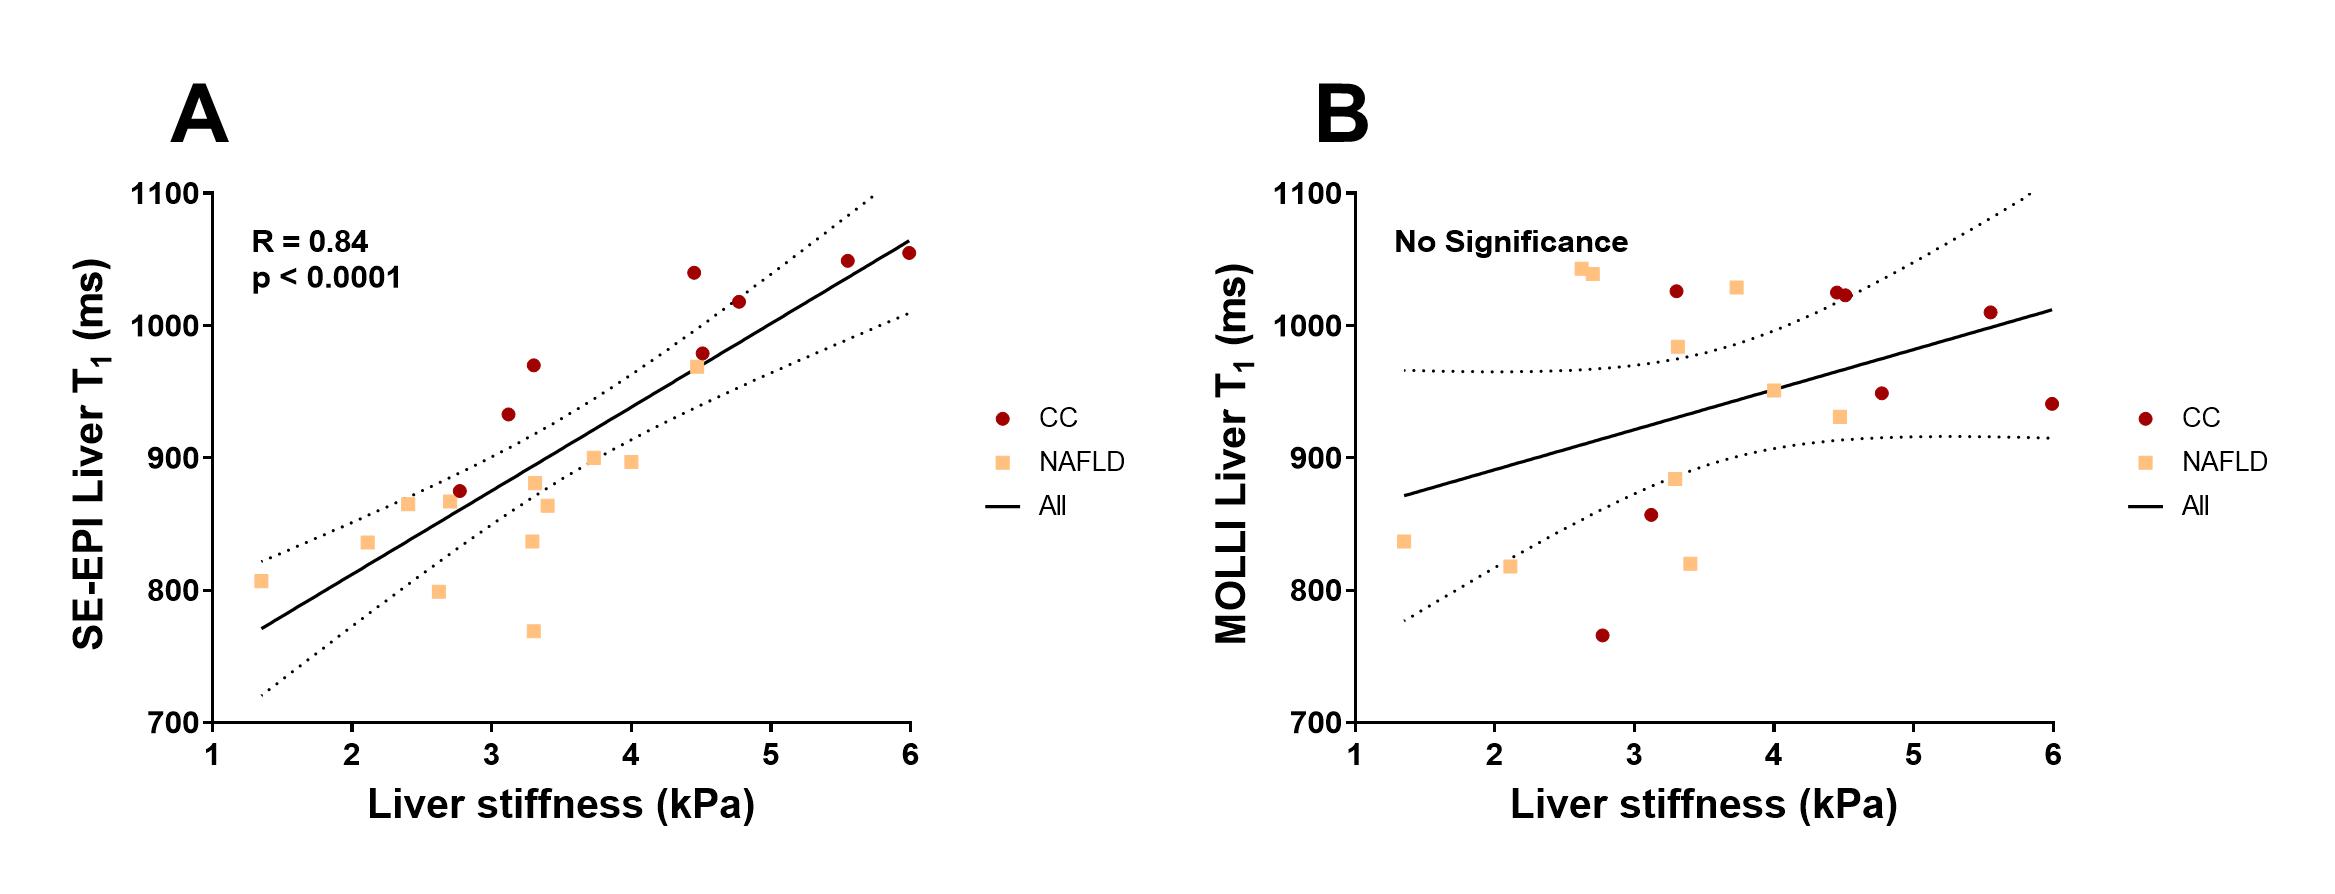
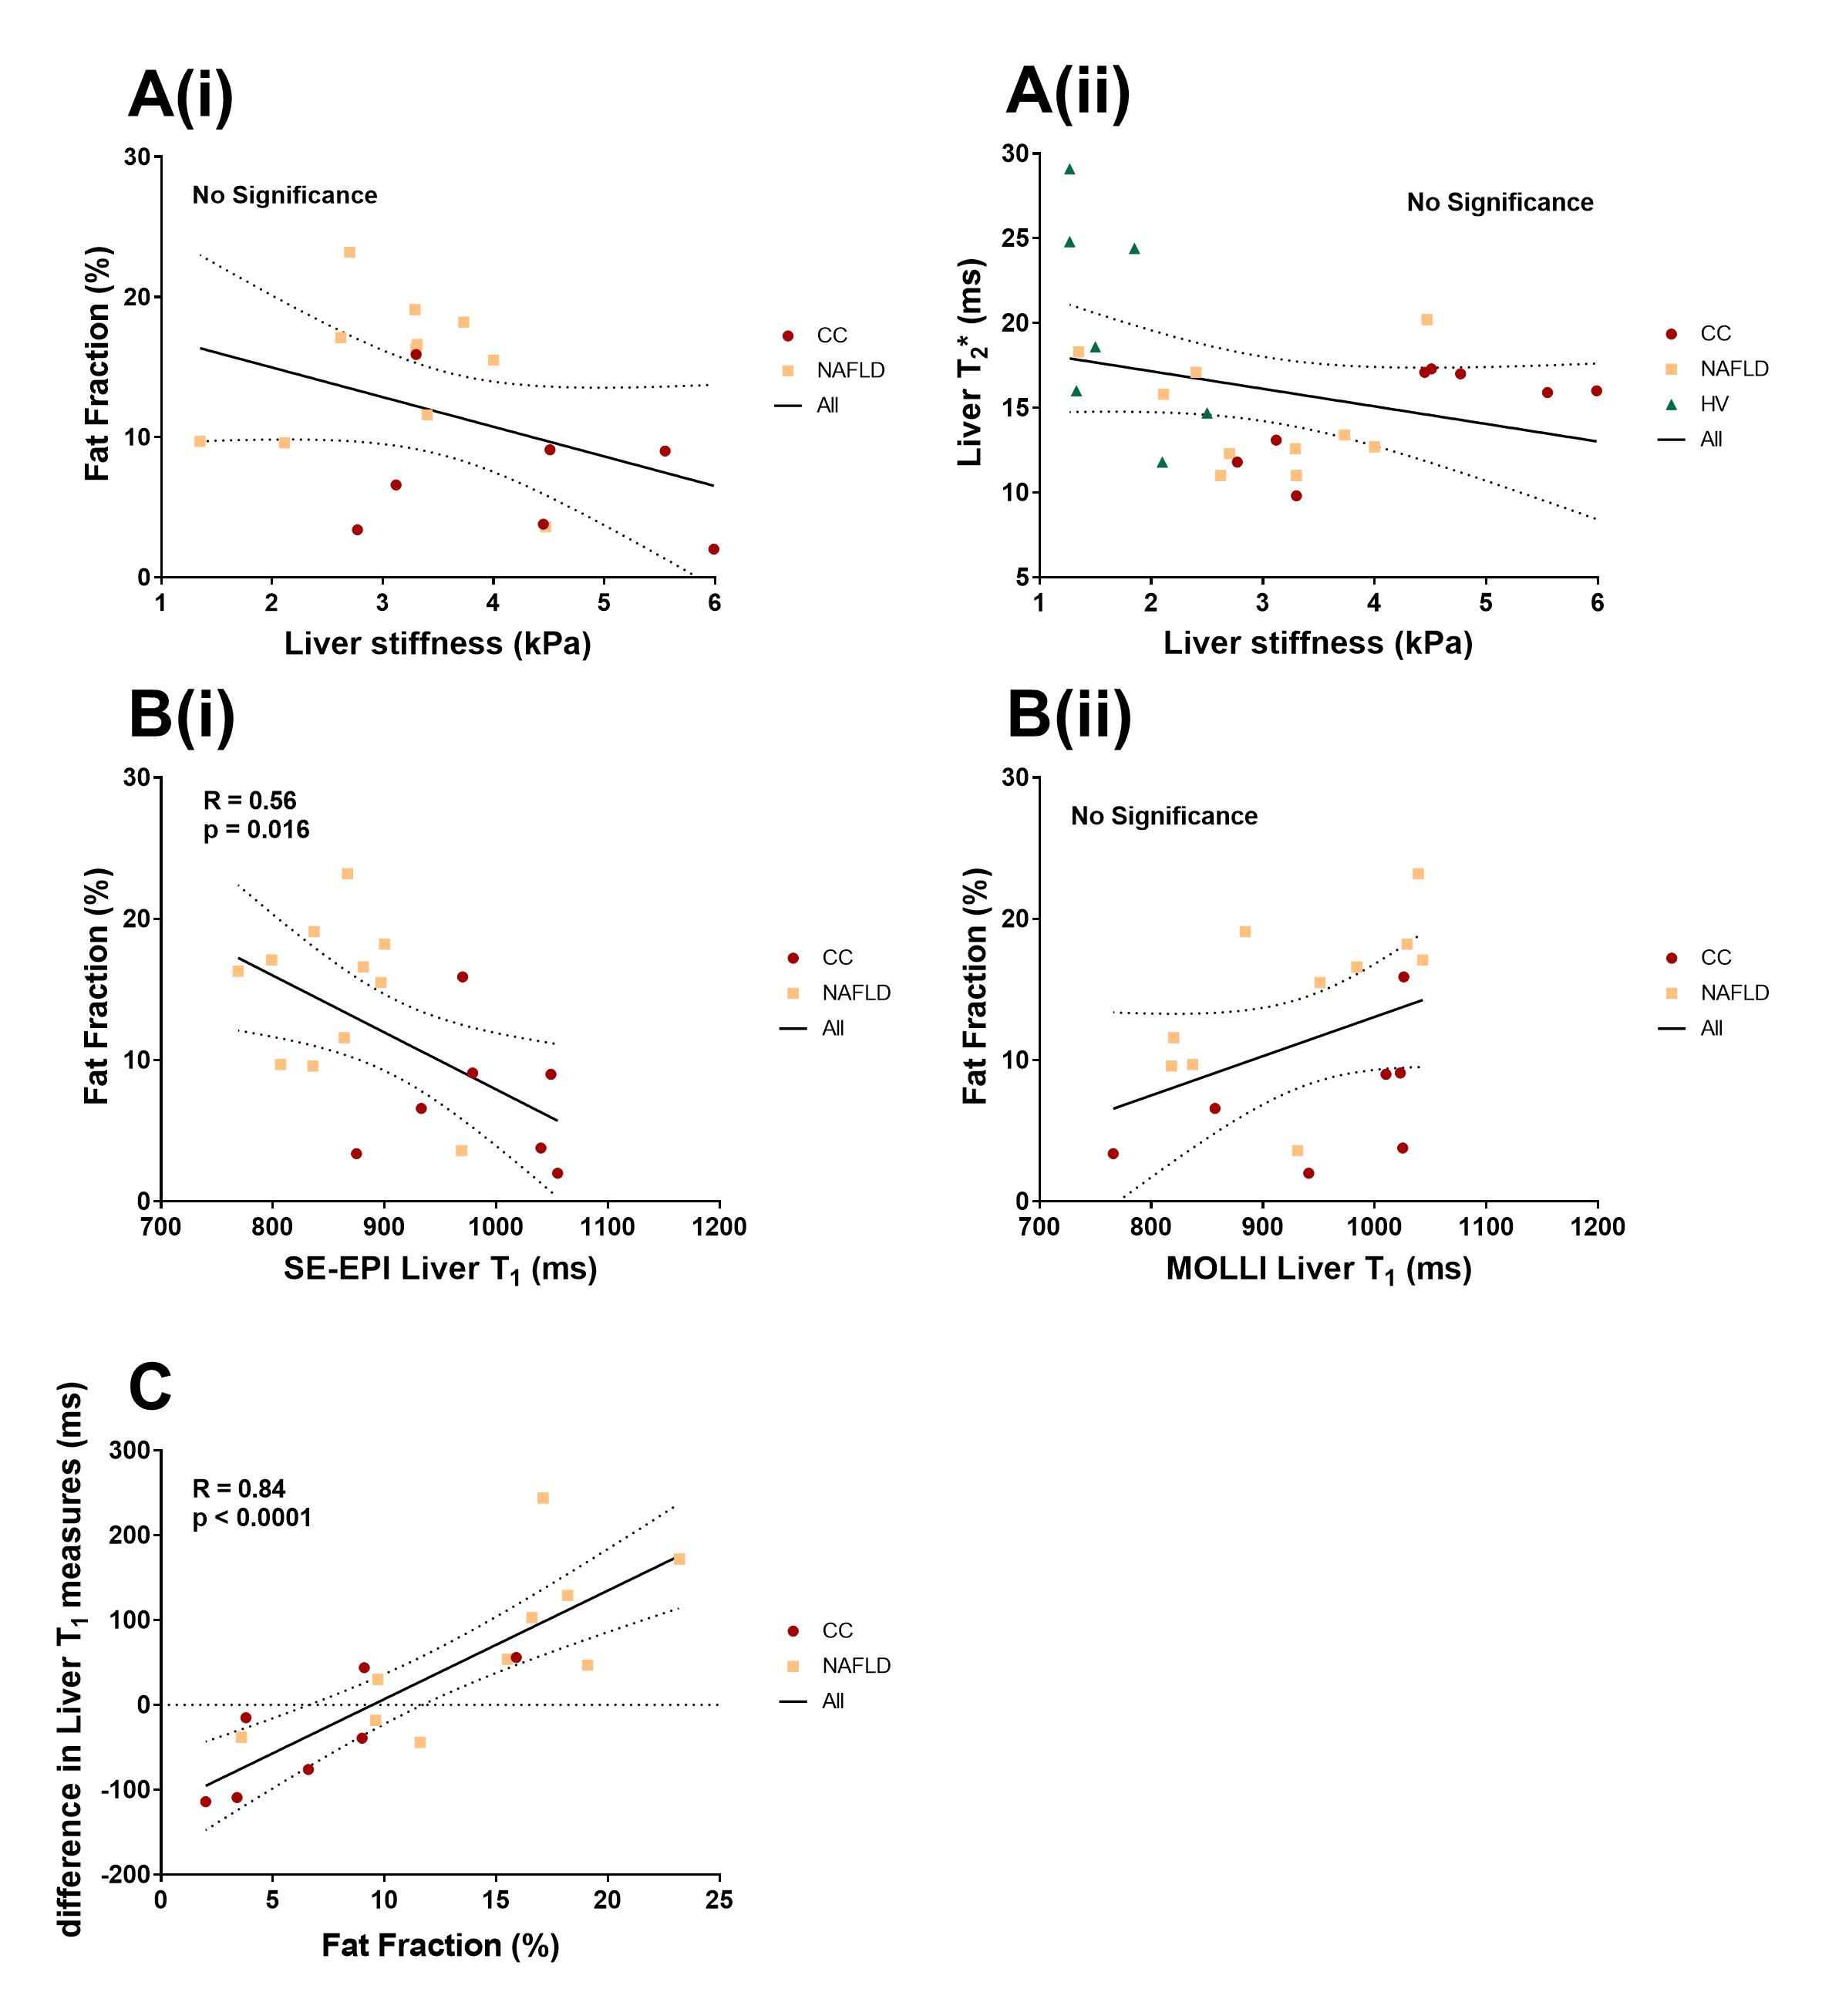
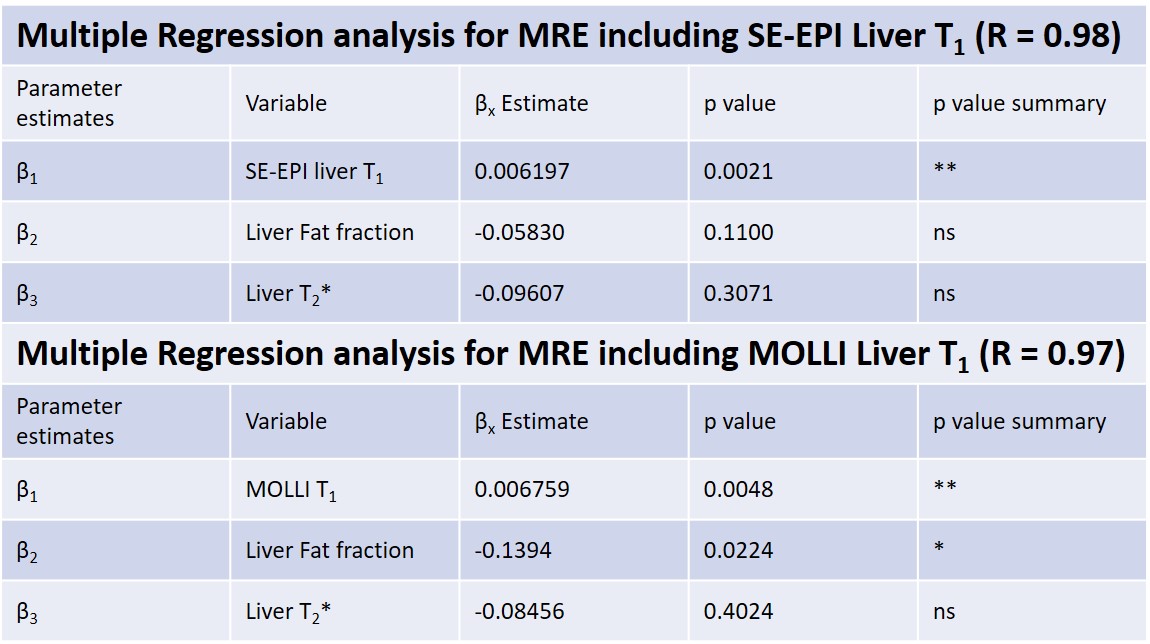
Figure 1 shows there was a highly significant positive correlation of SE-EPI liver T1 (R=0.70, p<0.0001) and mean SMA velocity (R=0.62, p<0.002) with liver MRE stiffness. Figure 2 provides example stiffness and SE-EPI T1 maps with disease severity. Figure 3 compares those subjects who had both SE-EPI and MOLLI Liver T1 measures vs MRE; SE-EPI T1 correlates with liver stiffness (R=0.84, p<0.0001), no significant correlation was observed for MOLLI T1. Liver stiffness was not correlated with either fat fraction or liver tissue T2* (Fig. 4A). A negative correlation was observed between SE-EPI liver tissue T1 and fat fraction (R=0.56, p=0.016), whereas no correlation is observed between MOLLI tissue T1 and fat fraction (Fig. 4B). Fat fraction correlated with the difference between the two measures of Liver T1 (MOLLI T1– SE-EPI T1) (Fig. 4C). Table 1 shows multiple regression analysis of independent variables: liver tissue T1, fat fraction and liver tissue T2* to predict liver stiffness. The analysis shows that SE-EPI liver T1 is sufficient to predict liver stiffness (R=0.98), whereas MOLLI liver T1 requires inclusion of liver fat fraction (R=0.97). Liver T2* does not contribute to either prediction model.Discussion
The strong correlation observed between liver stiffness and both SE-EPI liver Tissue T1 and SMA velocity suggest liver stiffness is a good additional measure to compliment these measures of liver disease severity, and suggests that liver stiffness could also provide a good predicter of HVPG3,7. MOLLI liver T1 has previously been shown to correlate with liver stiffness in a much larger cohort (n=155, R=0.49, p<0.001)2. However, we did not observe a significant correlation between MOLLI liver T1 and liver stiffness in our smaller cohort. This is likely due to MOLLI T1 being dependent on many factors, such as the degree of fat in the liver tissue8,9. In this cohort, SE-EPI T1 negatively correlates with fat fraction as the CC cohort has lower fat fraction but more severe liver disease when compared with the NAFLD group. We propose that SE-EPI T1 is the more sensitive T1 measure to be used in conjunction with MRE and SMA velocity to provide a powerful tool for assessment of liver disease and portal pressure.Acknowledgements
This work was funded by NIHR Biomedical Research Centre, Nottingham University Hospitals NHS Trust.References
1. Erden A, Öz DK, Peker E, et al (2021) MRI quantification techniques in fatty liver: the diagnostic performance of hepatic T1, T2, and stiffness measurements in relation to the proton density fat fraction. Diagnostic Interv Radiol 27:7. https://doi.org/10.5152/DIR.2020.19654
2. Obmann VC, Mertineit N, Marx C, et al (2019) Liver MR relaxometry at 3T – segmental normal T1 and T2* values in patients without focal or diffuse liver disease and in patients with increased liver fat and elevated liver stiffness. Sci Reports 2019 91 9:1–11. https://doi.org/10.1038/s41598-019-44377-y
3. Palaniyappan N, Cox E, Bradley C, et al (2016) Non-invasive assessment of portal hypertension using quantitative magnetic resonance imaging. J Hepatol 65:1131–1139. https://doi.org/10.1016/j.jhep.2016.07.021
4. Quantitative Imaging Biomarkers Alliance (2017) QIBA Profile : Magnetic Resonance Elastography of the Liver. 1–65
5. Banerjee R, Pavlides M, Tunnicliffe EM, et al (2014) Multiparametric magnetic resonance for the non-invasive diagnosis of liver disease. J Hepatol 60:69–77. https://doi.org/10.1016/j.jhep.2013.09.002
6. Bradley CR, Cox EF, Scott RA, et al (2018) Multi-organ assessment of compensated cirrhosis patients using quantitative magnetic resonance imaging. J Hepatol 69:1015–1024. https://doi.org/10.1016/j.jhep.2018.05.037
7. Danielsen KV, Hove JD, Nabilou P, et al (2021) Using MR elastography to assess portal hypertension and response to beta-blockers in patients with cirrhosis. Liver Int 41:2149–2158. https://doi.org/10.1111/liv.14981
8. Mozes FE, Tunnicliffe EM, Pavlides M, Robson MD (2016) Influence of fat on liver T 1 measurements using modified Look-Locker inversion recovery (MOLLI) methods at 3T. J Magn Reson Imaging 44:105–111. https://doi.org/10.1002/jmri.25146
9. Mozes FE, Tunnicliffe EM, Moolla A, et al (2019) Mapping tissue water T1 in the liver using the MOLLI T1 method in the presence of fat, iron and B0 inhomogeneity. NMR Biomed 32:e4030. https://doi.org/10.1002/NBM.4030
Figures