0602
Histological correlates of DR-HIGADOS microstructural metrics in the mouse and human liver1Radiomics Group, Vall d'Hebron Institute of Oncology, Vall d'Hebron Barcelona Hospital Campus, Barcelona, Spain, 2NMR Lab, Vall d'Hebron Institute of Oncology, Vall d'Hebron Barcelona Hospital Campus, Barcelona, Spain, 3Prostate Cancer Translational Research Group, Vall d'Hebron Institute of Oncology, Vall d'Hebron Barcelona Hospital Campus, Barcelona, Spain, 4Cardiff University Brain Research Imaging Centre, Cardiff University, Cardiff, United Kingdom, 5Molecular Oncology Group, Vall d'Hebron Institute of Oncology, Vall d'Hebron Barcelona Hospital Campus, Barcelona, Spain, 6Institut de Diagnòstic per la Imatge (IDI), Catalonia, Spain, 7Department of Radiology, Hospital Universitari Vall d'Hebron, Barcelona, Spain, 8Siemens Healthineers, Madrid, Spain, 9Hospital Universitari de Bellvitge, L'Hospitalet de Llobregat, Spain, 10Gastrointestinal and Endocrine Tumors Group, Vall d'Hebron Institute of Oncology, Vall d'Hebron Barcelona Hospital Campus, Barcelona, Spain, 11Early Clinical Drug Development Group, Vall d'Hebron Institute of Oncology, Vall d'Hebron Barcelona Hospital Campus, Barcelona, Spain
Synopsis
“Diffusion-Relaxation Hepatic Imaging via Generalised Assessment of DiffusiOn Simulations” (DR-HIGADOS) is a recent liver diffusion MRI method for intra-cellular fraction, cell size and cellularity measurement. Here we compare DR-HIGADOS metrics to counterparts from histology in two data sets: i) preclinical 9.4T MRI of formalin-fixed patient-derived xenograft mouse livers, with co-localised histological sections; ii) clinical 1.5T in vivo MRI of metastatic and primary liver cancer patients, with co-localised biopsies. Results confirm that DR-HIGADOS cell size and cellularity are histologically meaningful, paving the way to the application of the new technique in clinical studies.
Introduction
Diffusion-Relaxation Hepatic Imaging via Generalised Assessment of DiffusiOn Simulations (DR-HIGADOS) was recently proposed to enable clinically-viable estimation of liver intra-cellular fraction as well as cell size and density (cellularity), key features of tumour microstructure1. Their in vivo measurement may provide biomarkers of cancer pathology, and ultimately support early detection2 and tumour heterogeneity characterisation3, knowledge of which is key to fight drug resistance4. In this study we validate DR-HIGADOS indices by comparing them against co-localised histological metrics in patient-derived xenograft (PDX) mouse livers and clinical liver biopsies, following patients’ written consent.Methods
DR-HIGADOSThe diffusion-weighted (DW) signal acquired at varying echo time and diffusion-weighting was modelled as arising from intra-cellular, extra-cellular and vascular-like (fast pseudo-diffusion within fluid-filled conduits) water, as common in cancer imaging5,6. This enabled estimation of intra-cellular signal fraction/diffusivity ($$$f_C$$$, $$$D_0$$$), cell size and cellularity ($$$CSI$$$, $$$C$$$) in four steps.
Step 1 The model
$$s\,\,=\,\,s_0 \left( \,f_V\,e^{-bD_V\,-\,\frac{TE}{T_{2V}}}\,\,+\,\,(1-f_V)e^{-bD_T\,+\frac{1}{6}(bD_T)^2K_T\,-\,\frac{TE}{T_{2T}}} \right)\,\,[Eq.1]$$
was fitted to disentangle vascular-like and tissue signals, obtaining $$$f_V$$$ (vascular signal fraction); $$$T_{2V}$$$/$$$T_{2T}$$$ (vascular/tissue T2); $$$D_V$$$/$$$D_T$$$ (vascular/tissue apparent diffusivity); $$$K_T$$$ (tissue apparent kurtosis).
Step 2 The tissue signal was split into intra-/extra-cellular contributions. At $$$b \geq b_{th}$$$, the signal is dominated by intra-cellular components6-8, i.e.,
$$s(b \geq b_{th}, TE) \,\,\approx\,\, s_0\,(1 - f_V)\,e^{-\frac{TE}{T_{2C}}}\,f_C\,h_C(D_0, CSI; G).\,\,\,[Eq.2]$$
We use $$$b_{th}$$$ of 1200 s/mm2 in vivo (liver extra-cellular diffusivity: 2.6-2.8 μm2/ms 6, implying $$$e^{-1.2 \,\,\cdot\,\, 2.6}$$$~ 0.05), and 3000 s/mm2 ex vivo, owing to potential diffusivity drops of up to 50% or more. $$$f_C$$$, $$$D_0$$$, $$$T_{2C}$$$ are the intra-cellular signal fraction, diffusivity and T2; $$$CSI$$$ the cell size index; $$$h_C(D_0, CSI; G)$$$ describes intra-cellular diffusion weighting caused by the diffusion encoding gradient $$$G(t)$$$.
Step 3 $$$(f_C, CSI, D_0)$$$ were estimated from high b-values $$$b \geq b_{th}$$$ as
$$(f_C, CSI, D_0)^* \,\,=\,\,\arg \min_{(f_C,CSI,D_0)}\,\left(s\,\,-\,\, s_0\,(1 - f_V)\,e^{-\frac{TE}{T_{2C}}}\,f_C\,h_C(D_0, CSI; G) \right)^2\,\,[Eq.3]$$
over a dictionary9,10 of synthetic Monte Carlo-simulated signals11 with $$$T_{2C}$$$, $$$s_0$$$, $$$f_V$$$ fixed to $$$T_{2T}$$$, $$$s_0$$$, $$$f_V$$$ from step 1.
Step 4 Cellularity
$$C_{MRI}\,\,=\,\,\frac{\,(1 - f_V)f_C\,}{CSI^3}\,\,[Eq.4]$$
was computed as in related methods5.
Preclinical data
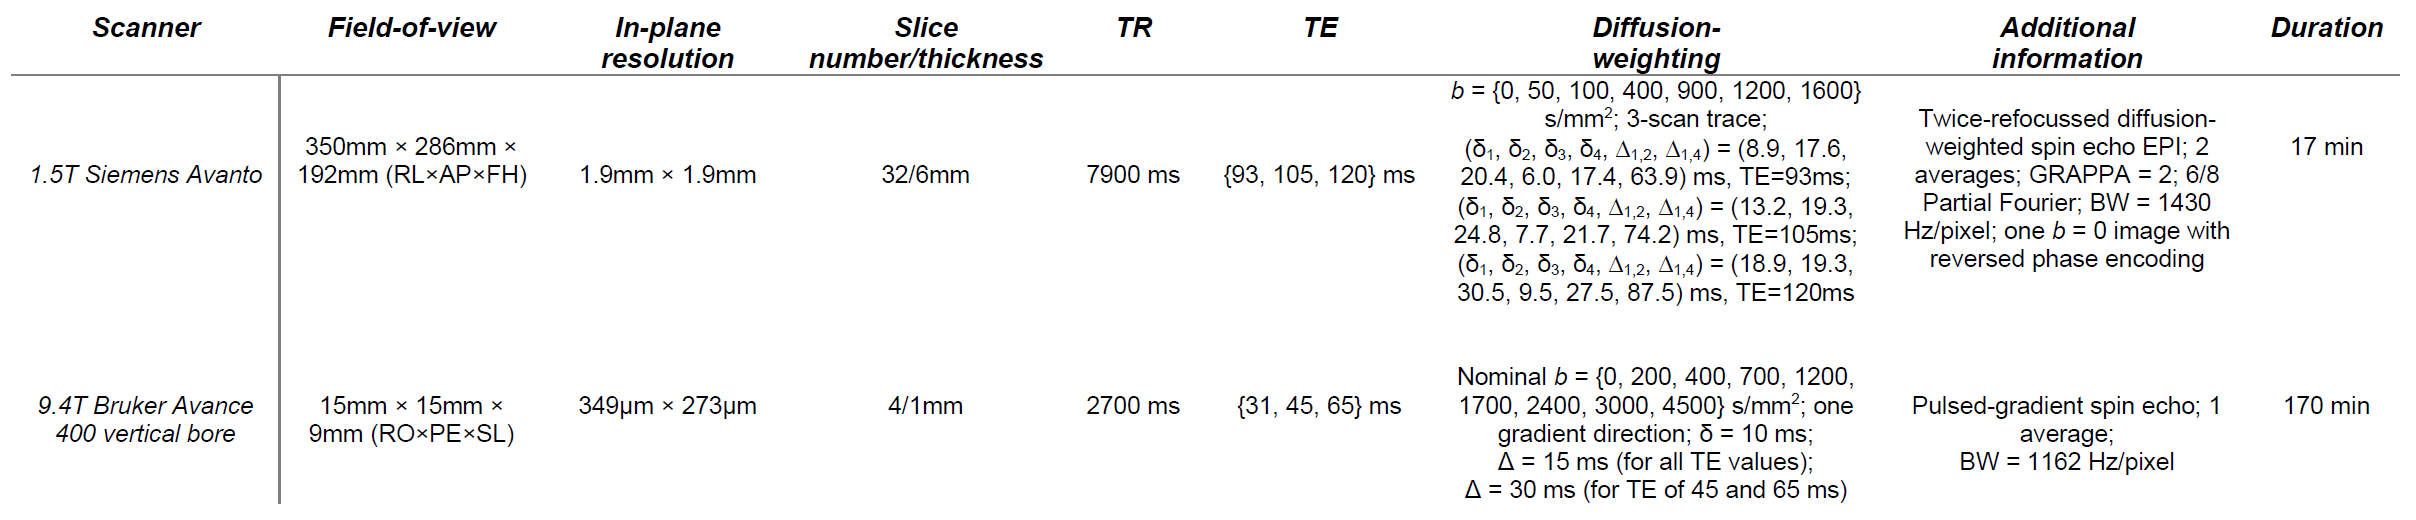
MRI Fixed ex vivo tissue from two NOD.Cg-Prkdcscid IL2rgtm1WjI/SzJ mouse livers (one PDX, sub-cutaneous bone biopsy implantation; one wild-type (WT)) was scanned in phosphate-buffered solution on a 9.4T Bruker Avance system (protocol: Table 1; room temperature). Scans were pre-processed (denoising12; Gibbs unringing13; drift correction) and DR-HIGADOS metrics computed.
Histology Cells were segmented with QuPath14 on digitised hematoxylin-eosin (HE)-stained sections from each MRI slice (Hamamatsu scanner, resolution: 0.227 μm). Cell size/cellularity $$$CSI_{histo}$$$/$$$C_{histo}$$$ were evaluated within patches matching MRI resolution. $$$CSI_{histo}$$$ was computed from distributions of individual cell sizes $$$L$$$ as8
$$CSI_{histo}\,\,=\,\,\left( \frac{<L^7>}{<L^3>} \right)^{\frac{1}{4}}\,\,[Eq.5]$$
while $$$C_{histo}$$$ as patch-wise cell density.
Analysis Histological maps were warped to MRI (symmetric diffeomorphic registration15) for qualitative comparison.
Clinical data
MRI Liver DW scans were acquired on 3 patients using a 1.5T Siemens Avanto scanner (patient 1: 68 M, melanoma; patient 2: 54 F, ovarian cancer; patient 3: 66 M, hepatocellular carcinoma (HCC); protocol in Table 1). Scans were pre-processed (denoising12; Gibbs unringing13; distortion/motion correction16) and DR-HIGADOS metrics computed.
Histology Ultrasound-guided biopsies of a liver lesion, stained for HE, were digitised on a Hamamatsu scanner (resolution: 0.454 μm) and processed as detailed for the preclinical data, obtaining per-biopsy $$$C_{histo}$$$ values.
Analysis A radiologist outlined biopsied lesions on MRI. Mean $$$C_{MRI}$$$ within such lesions was compared to $$$C_{histo}$$$.
Results and discussion
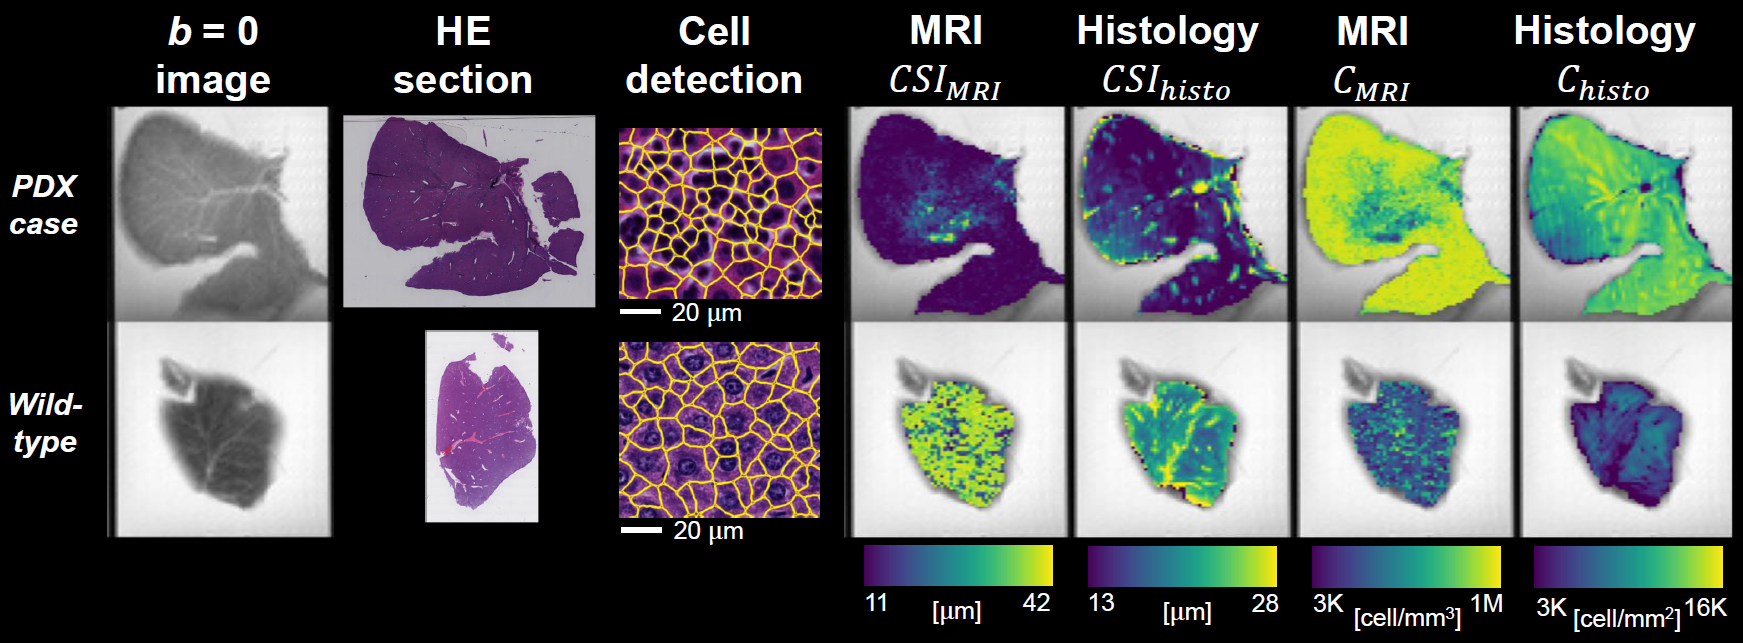
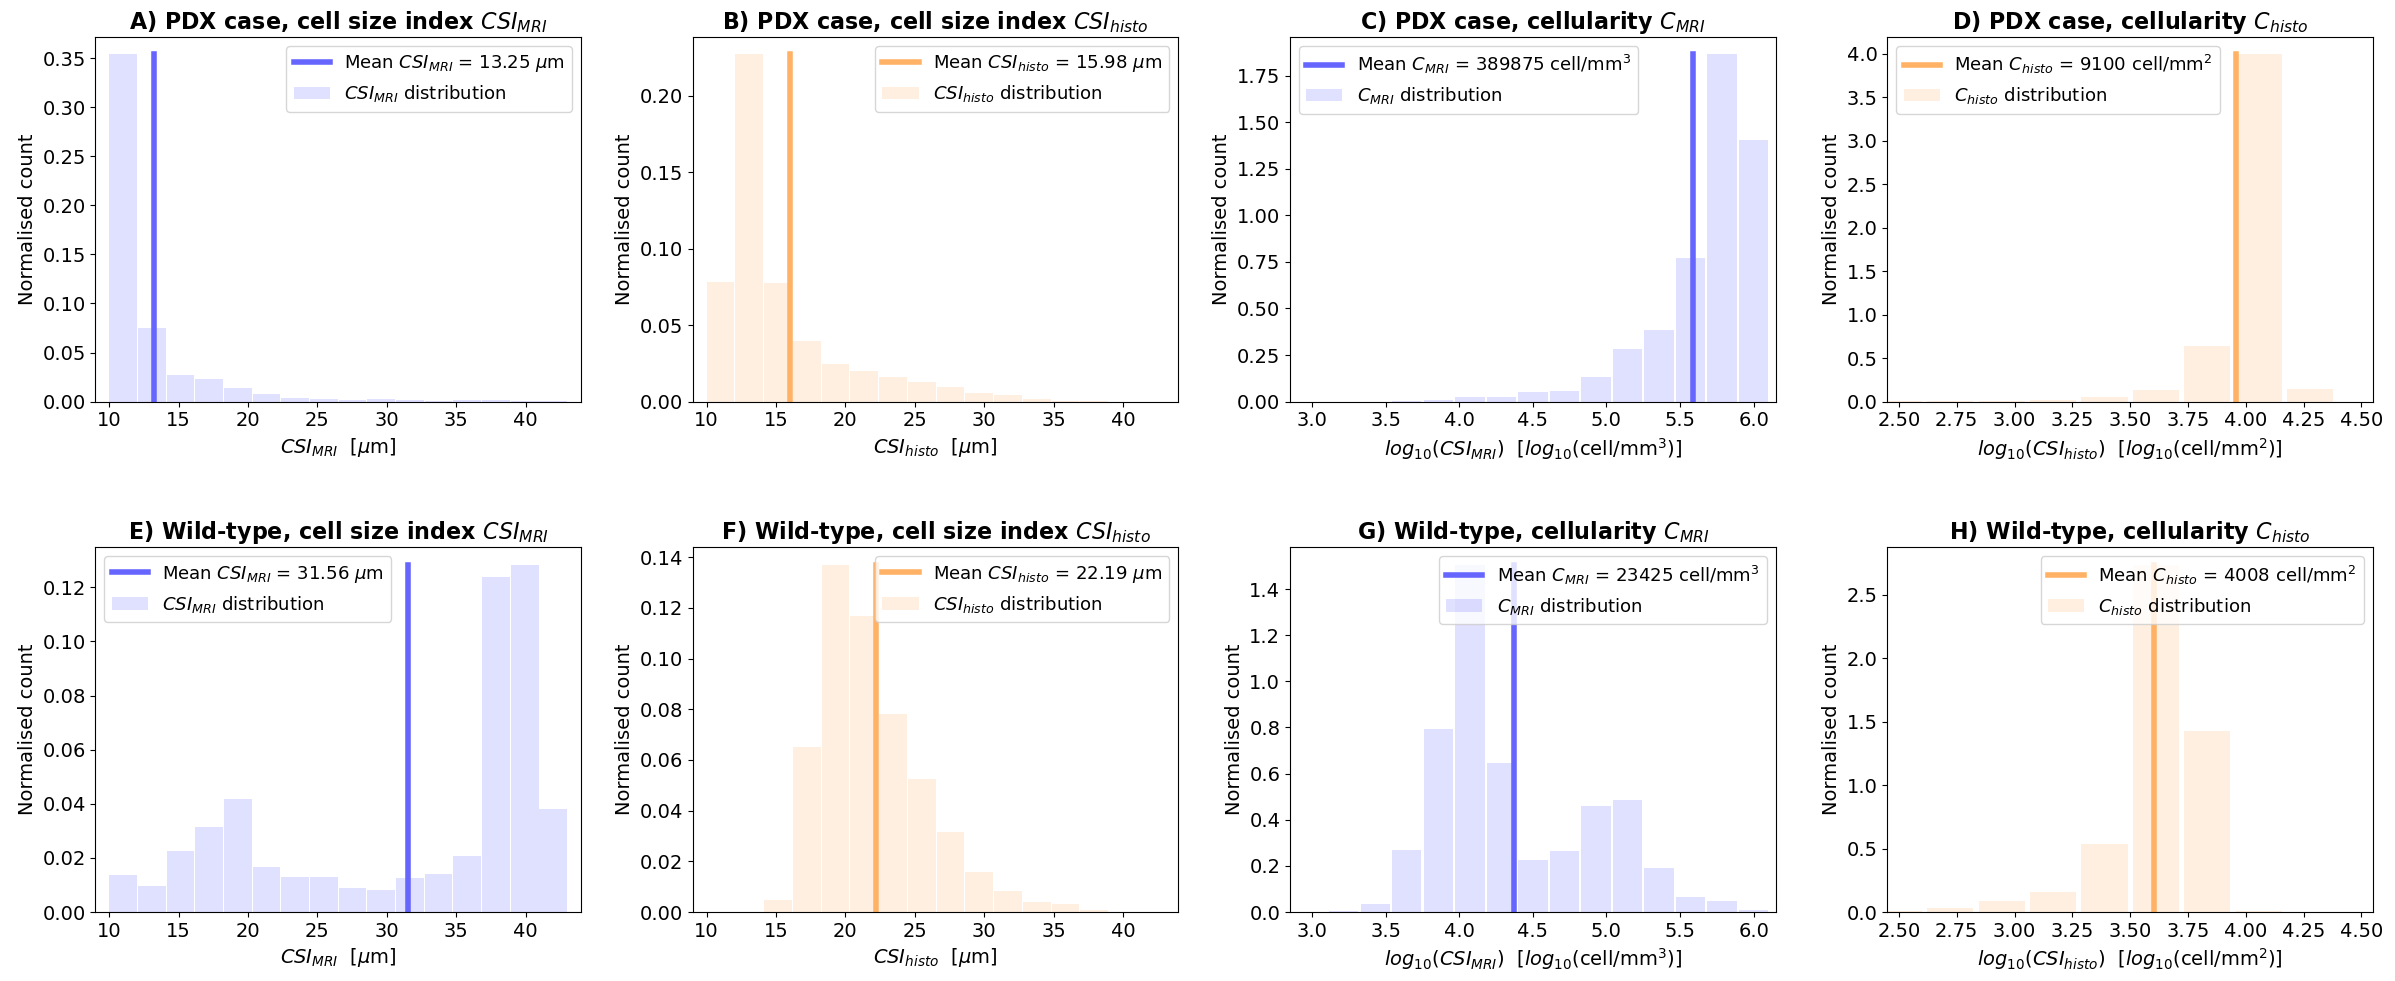
Preclinical dataFigure 1 shows mouse liver results. Unlike the WT, the PDX liver is characterised by abundant small leukocytes infiltration in between larger hepatocytes, without focal lesions. This diffuse process results in stark between-sample $$$CSI_{histo}$$$ and $$$C_{histo}$$$ contrasts ($$$CSI_{histo}$$$ and $$$C_{histo}$$$ respectively lower and higher in PDX than WT). $$$CSI_{MRI}$$$ and $$$C_{MRI}$$$ show between-sample contrasts that agree with histology, demonstrating that DR-HIGADOS detects widespread pathology that do not necessarily result in focal damage. Figure 2 shows $$$CSI_{MRI}$$$, $$$C_{histo}$$$, $$$CSI_{histo}$$$ and $$$C_{histo}$$$ distributions. These confirm the contrasts seen in Figure 1, and highlight that $$$CSI_{MRI}$$$ overestimates $$$CSI_{histo}$$$ for the largest cell sizes. This finding may be due, at least in part, to shrinkage during histological processing, or bias from surviving, unaccounted extra-cellular signal.
Clinical data
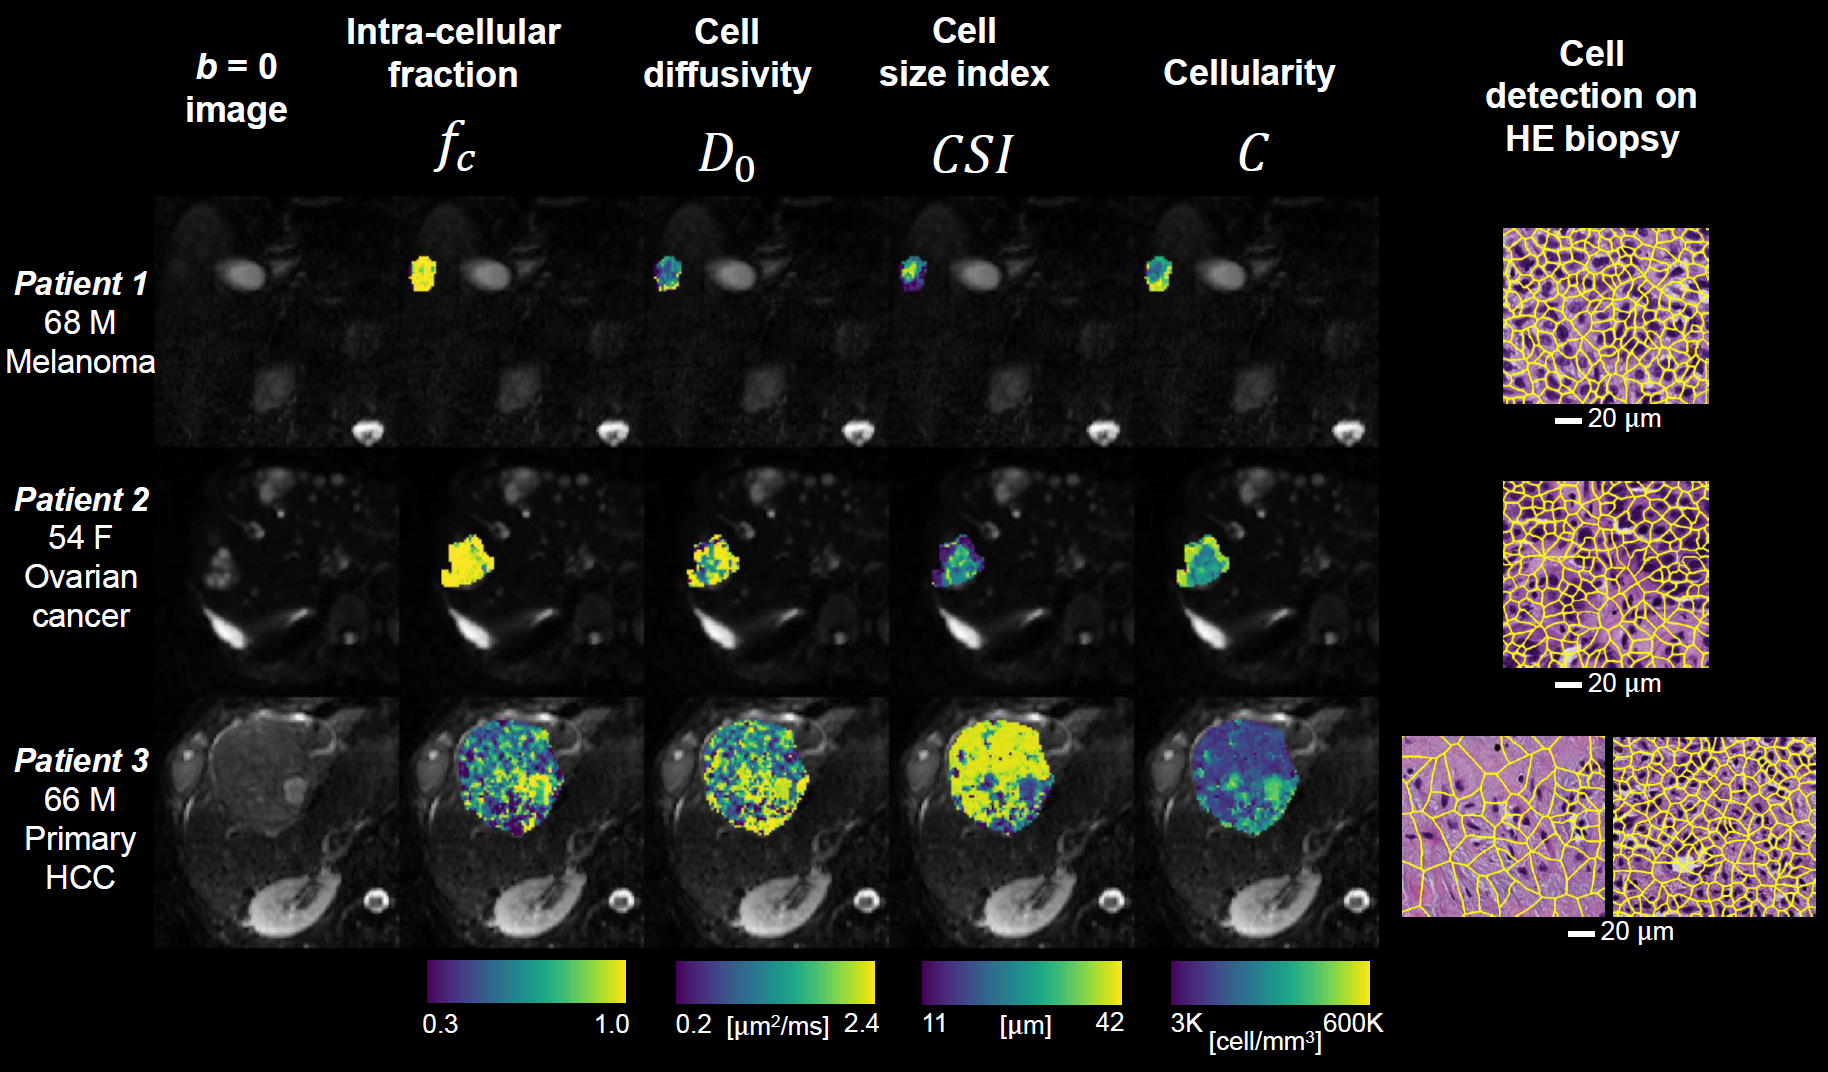
Figure 3 shows MRI and biopsy results in patients. Lesions in patients 1-2 (metastases) feature higher intra-cellular fraction $$$f_C$$$ than in patient 3 (HCC). This finding is compatible with presence of fibrosis, a known feature of HCC17,18. $$$CSI_{MRI}$$$ is higher in patients 1-2 than patient 3. In patient 3, $$$CSI_{MRI}$$$ shows high heterogeneity, highlighting areas with small cells embedded within areas with larger cells. Histology confirms the presence of two cell size components in patient 3.
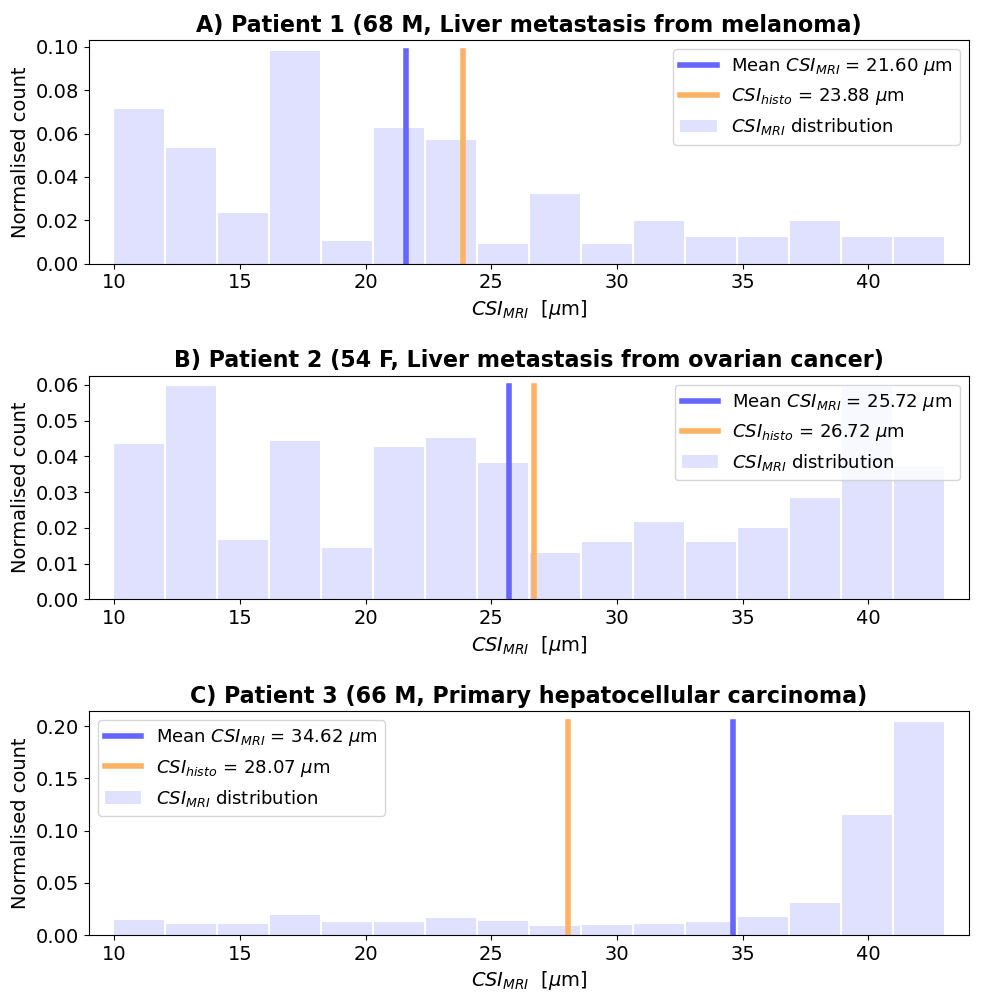
Figure 4 shows $$$CSI_{MRI}$$$ distributions and $$$CSI_{histo}$$$ values. Mean $$$CSI_{MRI}$$$ is the highest for patient 3, followed by that of patient 2 and then patient 1. $$$CSI_{histo}$$$ confirms this ranking.
Conclusions
DR-HIGADOS provides histologically meaningful indices of key liver microstructural properties, which are confirmed by quantitative analysis of co-localised histology. Therefore, DR-HIGADOS may play an important role in the oncology clinic, by improving the sensitivity and biological specificity of non-invasive imaging towards cancer. Future work is warranted to expand the sample size and to correlate MRI and histology quantitatively.Acknowledgements
This project was supported by ”la Caixa” Foundation (RTI2018-095209-B-C21), Spanish Ministry of Science and Innovation (FIS-G64384969), investigator-initiated PREdICT study at the Vall d'Hebron Institute of Oncology funded by AstraZeneca, and by the Comprehensive Program of Cancer Immunotherapy & Immunology (CAIMI), funded by the Banco Bilbao Vizcaya Argentaria Foundation (FBBVA) (grant 89/2017). KB is funded by a Beatriu de Pinós post-doctoral grant (2019BP/00182). RPL is supported by a CRIS Foundation Talent Award (TALENT19-05), the Instituto de Salud Carlos III-Investigación en Salud (PI18/01395) and the Prostate Cancer Foundation Young Investigator Award. ICS is supported by a fellowship from ”la Caixa” Foundation (ID 100010434) and the European Union’s Horizon 2020 research and innovation programme under the Marie Sklodowska-Curie grant agreement No 847648, fellowship code LCF/BQ/PI20/1176003. MP is supported by UKRI Future Leaders Fellowship (MR/T020296/1). AstraZeneca and Siemens did not influence data acquisition and analysis, result interpretation and the decision to submit this work in its present form.References
1. Grussu F, Barba I, Bernatowicz K, et al. DR-HIGADOS: a new diffusion-relaxation framework for clinically feasible microstructural imaging of the liver. Proceedings of ISMRM 2021, p. 0699.
2. Tsilimigras DI, Brodt P, Clavien P-A, et al. Liver metastases. Nat. Rev. Dis. Prim. 2021;7:27, doi: 10.1038/s41572-021-00261-6.
3. O’Connor JPB, Aboagye EO, Adams JE, et al. Imaging biomarker roadmap for cancer studies. Nat. Rev. Clin. Oncol. 2017;14:169–186, doi: 10.1038/nrclinonc.2016.162.
4. Bedard PL, Hansen AR, Ratain MJ, Siu LL. Tumour heterogeneity in the clinic. Nature 2013;501:355–364, doi: 10.1038/nature12627.
5. Panagiotaki E, Chan RW, Dikaios N, et al. Microstructural Characterization of Normal and Malignant Human Prostate Tissue With Vascular, Extracellular, and Restricted Diffusion for Cytometry in Tumours Magnetic Resonance Imaging. Invest. Radiol. 2015;50:218–227, doi: 10.1097/RLI.0000000000000115.
6. Jiang X, Xu J, Gore JC. Mapping hepatocyte size in vivo using temporal diffusion spectroscopy MRI. Magn. Reson. Med. 2020;84:2671–2683, doi: 10.1002/mrm.28299.
7. McKinnon ET, Helpern JA, Jensen JH. Modeling white matter microstructure with fiber ball imaging. Neuroimage 2018;176:11–21, doi: 10.1016/j.neuroimage.2018.04.025.
8. Veraart J, Nunes D, Rudrapatna U, et al. Noninvasive quantification of axon radii using diffusion MRI. Elife 2020;9, doi: 10.7554/eLife.49855.
9. Palombo M, Ianus A, Guerreri M, et al. SANDI: A compartment-based model for non-invasive apparent soma and neurite imaging by diffusion MRI. Neuroimage 2020;215:116835, doi: 10.1016/j.neuroimage.2020.116835.
10. Buizza G, Paganelli C, Ballati F, et al. Improving the characterization of meningioma microstructure in proton therapy from conventional apparent diffusion coefficient measurements using Monte Carlo simulations of diffusion MRI. Med. Phys. 2021;48:1250–1261, doi: 10.1002/mp.14689.
11. Rafael-Patino J, Romascano D, Ramirez-Manzanares A, Canales-Rodríguez EJ, Girard G, Thiran J-P. Robust Monte-Carlo Simulations in Diffusion-MRI: Effect of the Substrate Complexity and Parameter Choice on the Reproducibility of Results. Front. Neuroinform. 2020;14, doi: 10.3389/fninf.2020.00008.
12. Veraart J, Novikov DS, Christiaens D, Ades-aron B, Sijbers J, Fieremans E. Denoising of diffusion MRI using random matrix theory. Neuroimage 2016;142:394–406, doi: 10.1016/j.neuroimage.2016.08.016.
13. Kellner E, Dhital B, Kiselev VG, Reisert M. Gibbs-ringing artifact removal based on local subvoxel-shifts. Magn. Reson. Med. 2016;76:1574–1581, doi: 10.1002/mrm.26054.
14. Bankhead P, Loughrey MB, Fernández JA, et al. QuPath: Open source software for digital pathology image analysis. Sci. Rep. 2017;7:16878, doi: 10.1038/s41598-017-17204-5.
15. Garyfallidis E, Brett M, Amirbekian B, et al. Dipy, a library for the analysis of diffusion MRI data. Front. Neuroinform. 2014;8, doi: 10.3389/fninf.2014.00008.
16. Andersson JLR, Skare S, Ashburner J. How to correct susceptibility distortions in spin-echo echo-planar images: application to diffusion tensor imaging. Neuroimage 2003;20:870–888, doi: 10.1016/S1053-8119(03)00336-7.
17. Forner A, Reig M, Bruix J. Hepatocellular carcinoma. Lancet 2018;391:1301–1314, doi: 10.1016/S0140-6736(18)30010-2.
18. Dhar D, Baglieri J, Kisseleva T, Brenner DA. Mechanisms of liver fibrosis and its role in liver cancer. Exp. Biol. Med. 2020;245:96–108, doi: 10.1177/1535370219898141.
Figures