0600
Dependence of liver R2* on the fat spectral model.1Liver Imaging Group, Department of Radiology, University of California San Diego, San Diego, CA, United States
Synopsis
Using MRS, we examined whether the assumed fat spectral model (6-, or 9-peak) altered liver R2* estimation in vivo. We found that liver R2* estimation was model-independent, and liver R2*was not significantly different from water R2* (p = 0.07). However, fat R2* values estimated for these models were different (p < 0.0001), suggesting that fat R2* estimation in high-fat tissues may be model dependent.
Introduction
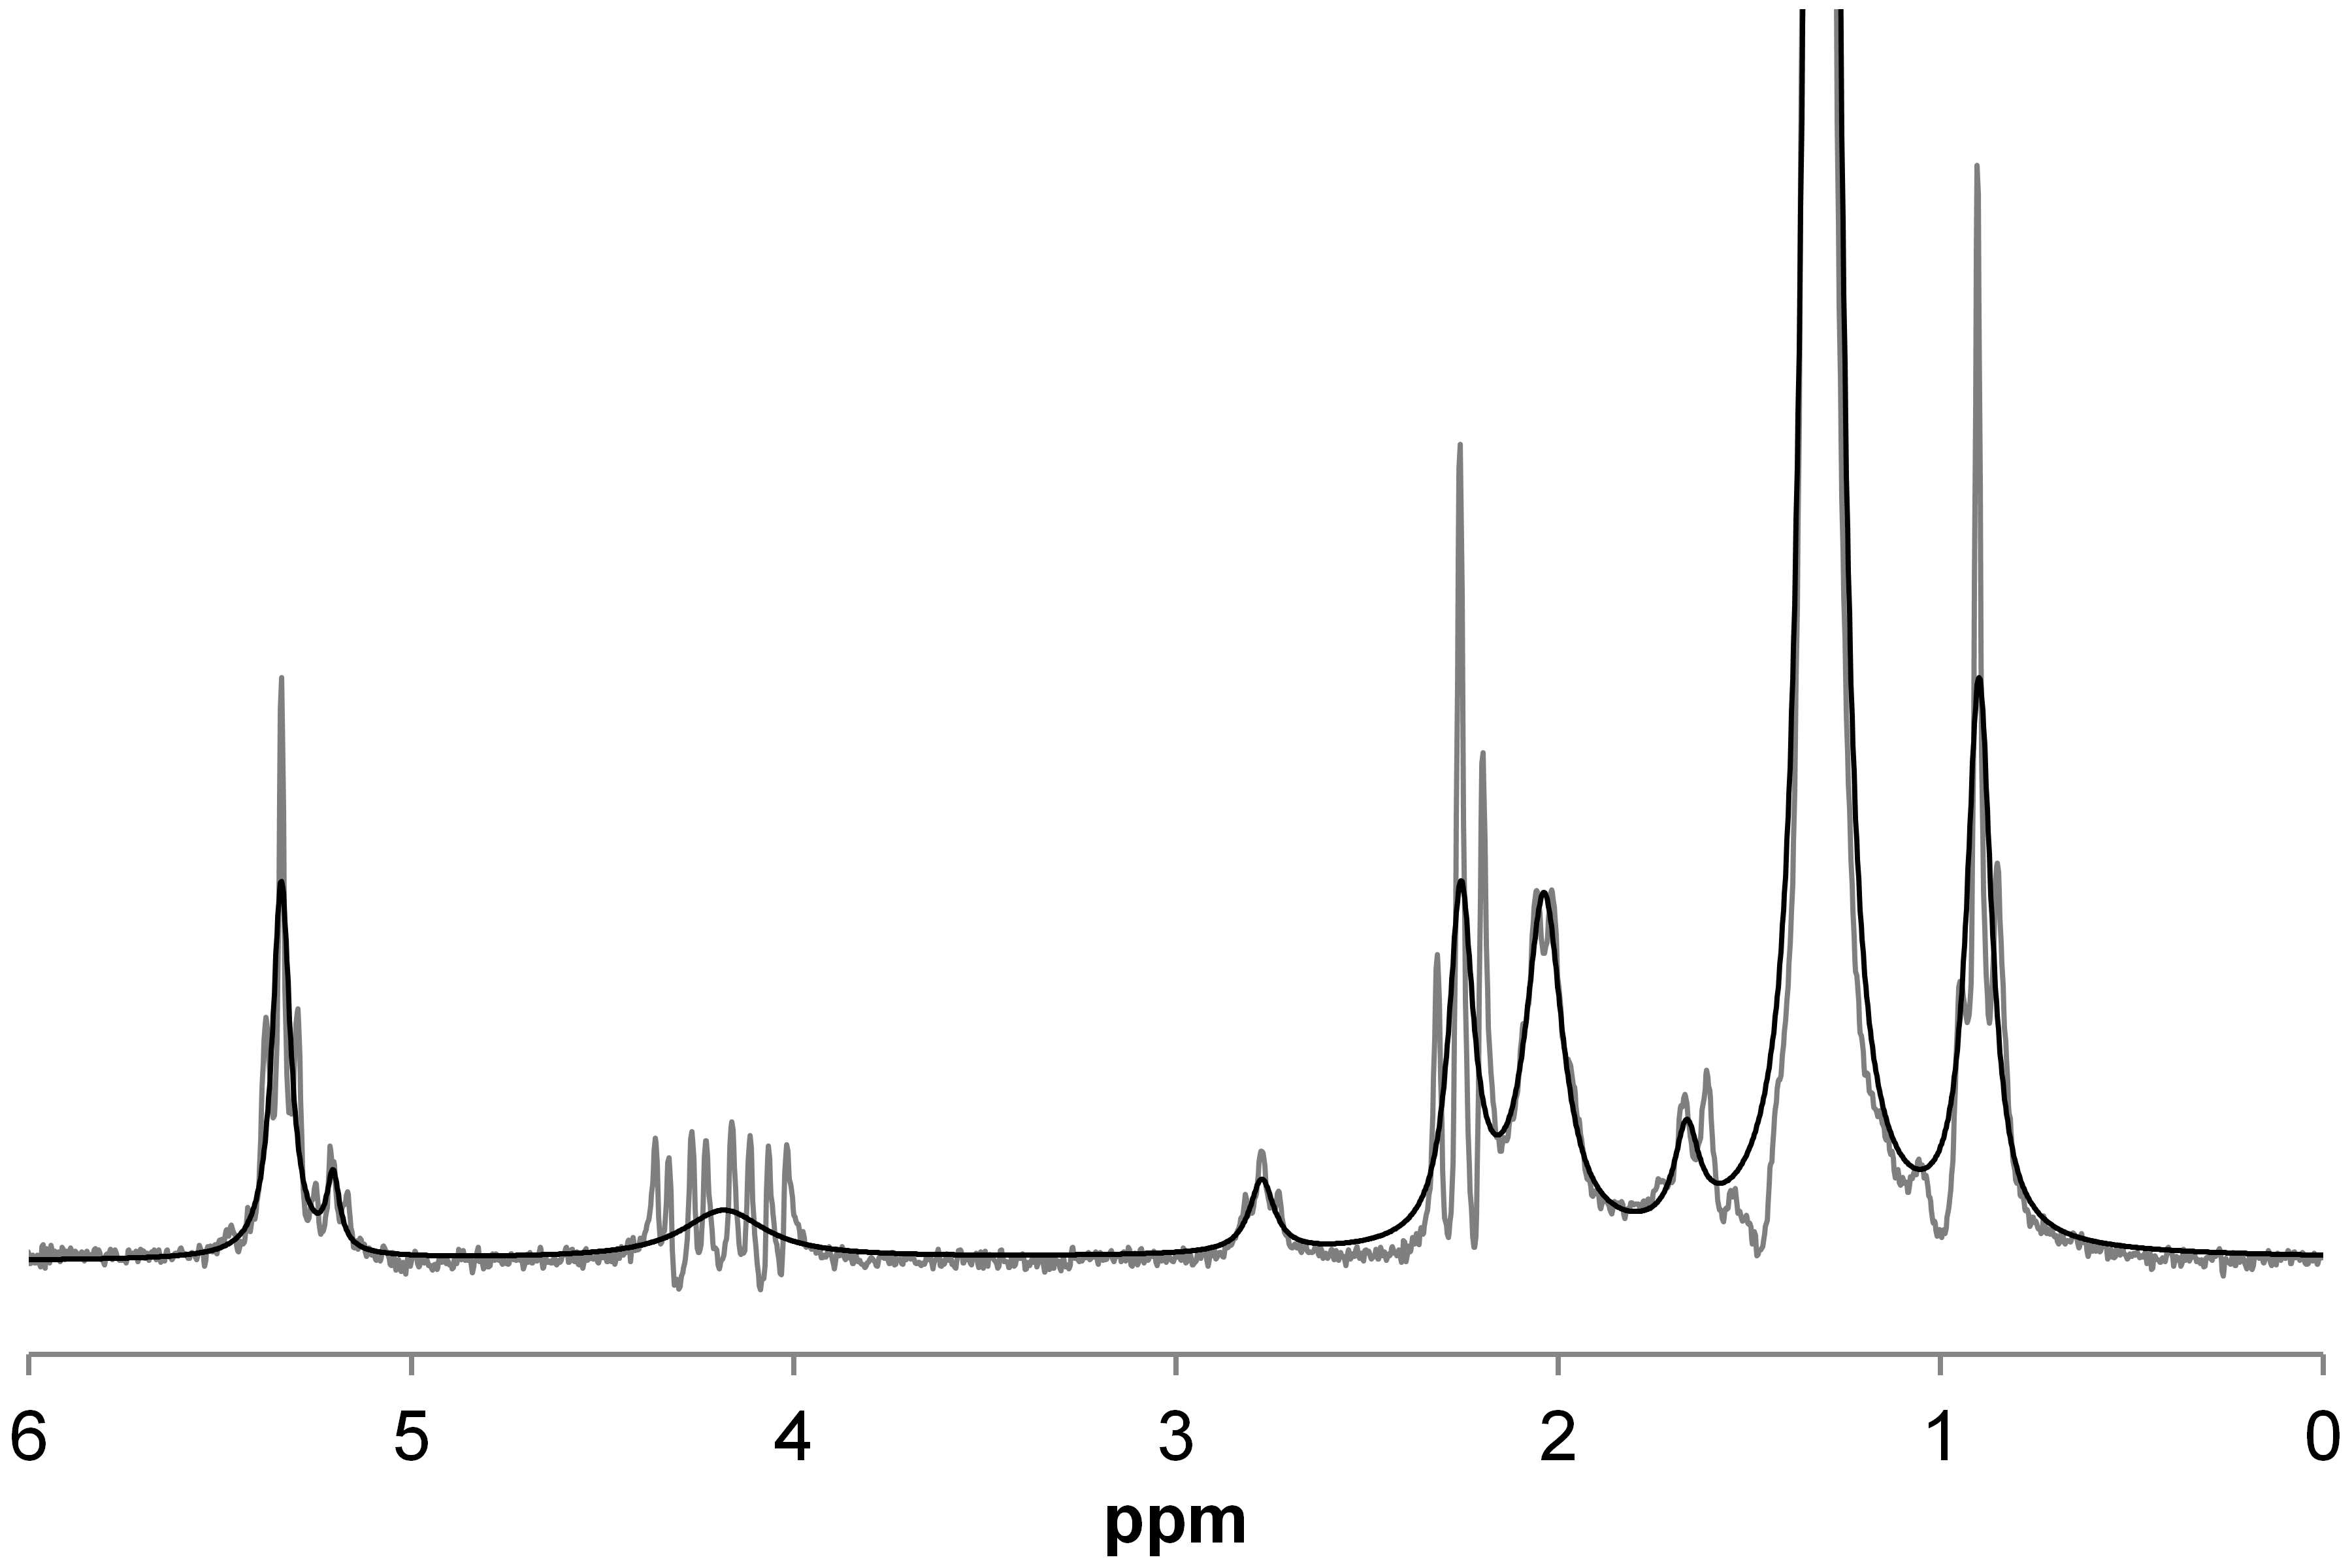
As well as permitting estimation of proton density fat fraction (PDFF), a standardized non-invasive MR-based biomarker of hepatic steatosis, chemical‑shift‑encoded (CSE) MRI also permits estimation of liver R2*, which can be used to assess hepatic iron concentration. One limitation of CSE-MRI is that R2* of liver water (R2w*) and liver fat (R2f*) are assumed to be the same (i.e., R2liver*). This assumption cannot be directly examined by CSE-MRI, but it can be investigated by MRS using a long-TR, multi-TE STEAM sequence, which can not only estimate liver water and fat R2 values, but also can also estimate R2w* and R2f* by measuring the width of the water and fat peaks, respectively. The fat spectrum has nine major peaks; however, CSE-MRI techniques often combine some of those peaks, to give a 6-peak model. This will change the width of some of the resulting fat peaks, and hence may affect R2f* estimates (Figure 1), and possibly also R2liver* estimates. We will examine in vivo how R2W*, R2f* and R2liver*compare for the 6-, and the 9-peak fat spectral models.Methods
117 adult subjects (mean age 54 yrs, range 26-79 yrs, 60 male, 57 female) with known or suspected nonalcoholic fatty liver disease provided written informed consent in this IRB-approved, HIPAA-compliant study, and underwent MRS at 3 Tesla (GE Signa EXCITE HD, GE Healthcare, Waukesha, WI). After conventional imaging, a 20x20x20 mm voxel was selected within the liver that avoided liver edges as well as large biliary or vascular structures. Following a single pre-acquisition excitation, five spectra (TR 3,500 ms, TM 5 ms) were acquired with a single average at progressively longer TEs of 10, 15, 20, 25 and 30 ms in a single 21 s breath-hold. Spectra from individual channels were combined using singular value decomposition (1). A single experienced observer analyzed the spectra using the AMARES algorithm (2) included in the MRUI software package (3). Spectra were analyzed using prior knowledge based on the fat spectrum used by MRI techniques (4). The spectra were modeled with a single water peak and either six fat peaks (5.29, 4.2, 2.75, 2.1, 1.3 and 0.9 ppm with relative areas 0.067, 0.056, 0.009, 0.172, 1.000 and 0.125) or nine fat peaks (5.29, 5.19, 4.2, 2.75, 2.24, 2.02, 1.6, 1.3 and 0.9 ppm with relative areas 0.058, 0.015, 0.061, 0.010, 0.091, 0.097, 0.091, 1.000 and 0.136), with the fat peaks locations and areas fixed relative to each other, and with identical fat peak linewidth (that is a single R2f* value for all fat peaks). For each of the models, the spectra were either fitted with R2w*and R2f* independent of each other, or with water and fat having the same R2* to give R2liver*. Finally, the spectra were fitted with the standard technique (4) to calculate PDFF. Thus, a total of five different models were investigated. For PDFF < 5%, it was assumed that R2f* could not be modelled, and so R2f* values were left out of those analyses.Results
Mean PDFF was 12.2% (range: 0.3 - 38.8%). When comparing R2* estimates for the 6- and 9-peak models, there was no significant difference in R2w* (p = 0.07), but there was a difference for R2f* (p < 0.0001), and the difference between the models increased as R2f*increased (Figure 2). For the range of PDFFs examined in this study, there was excellent agreement between the R2w*and R2liver* (Figure 3: 9-peak model: R2liver* = 0.996.R2w* - 0.045 s-1, r = 0.999; 6-peak model: R2liver* = 1.000.R2w* - 0.028 s-1, r = 1.000). No correlation was observed between PDFF and R2w* or R2f*.Conclusion
This study suggests that for the range of PDFF and R2* values seen in this study, R2* estimated by CSE-MRI modelling is independent of assumed fat spectral peak model and is simply equal to the R2w* value. However, we did observe model dependence on R2f*, suggesting that, in high fat tissues, R2* may be dependent on the fat spectrum model.Acknowledgements
No acknowledgement found.References
1) Bydder M, Hamilton G, Yokoo T, Sirlin CB. Optimal phased-array combination for spectroscopy. Magn Reson Imaging 2008;26:847-850.
2) Vanhamme L, van den Boogaart A, Van Huffel S. Improved Method for Accurate and Efficient Quantification of MRS Data with Use of Prior Knowledge. J Magn Reson 1997;129:35-43.
3) Naressi A, Couturier C, Devos JM, et al. Java-based graphical user interface for the MRUI quantitation package. Magn Reson Mater Physics, Biol Med 2001;12:141-152.
4) Hamilton G, Yokoo T, Bydder M, Cruite I, Schroeder ME, Sirlin CB, et al. In vivo characterization of the liver fat 1H MR spectrum. NMR Biomed. 2011;24(7):784–90.
Figures
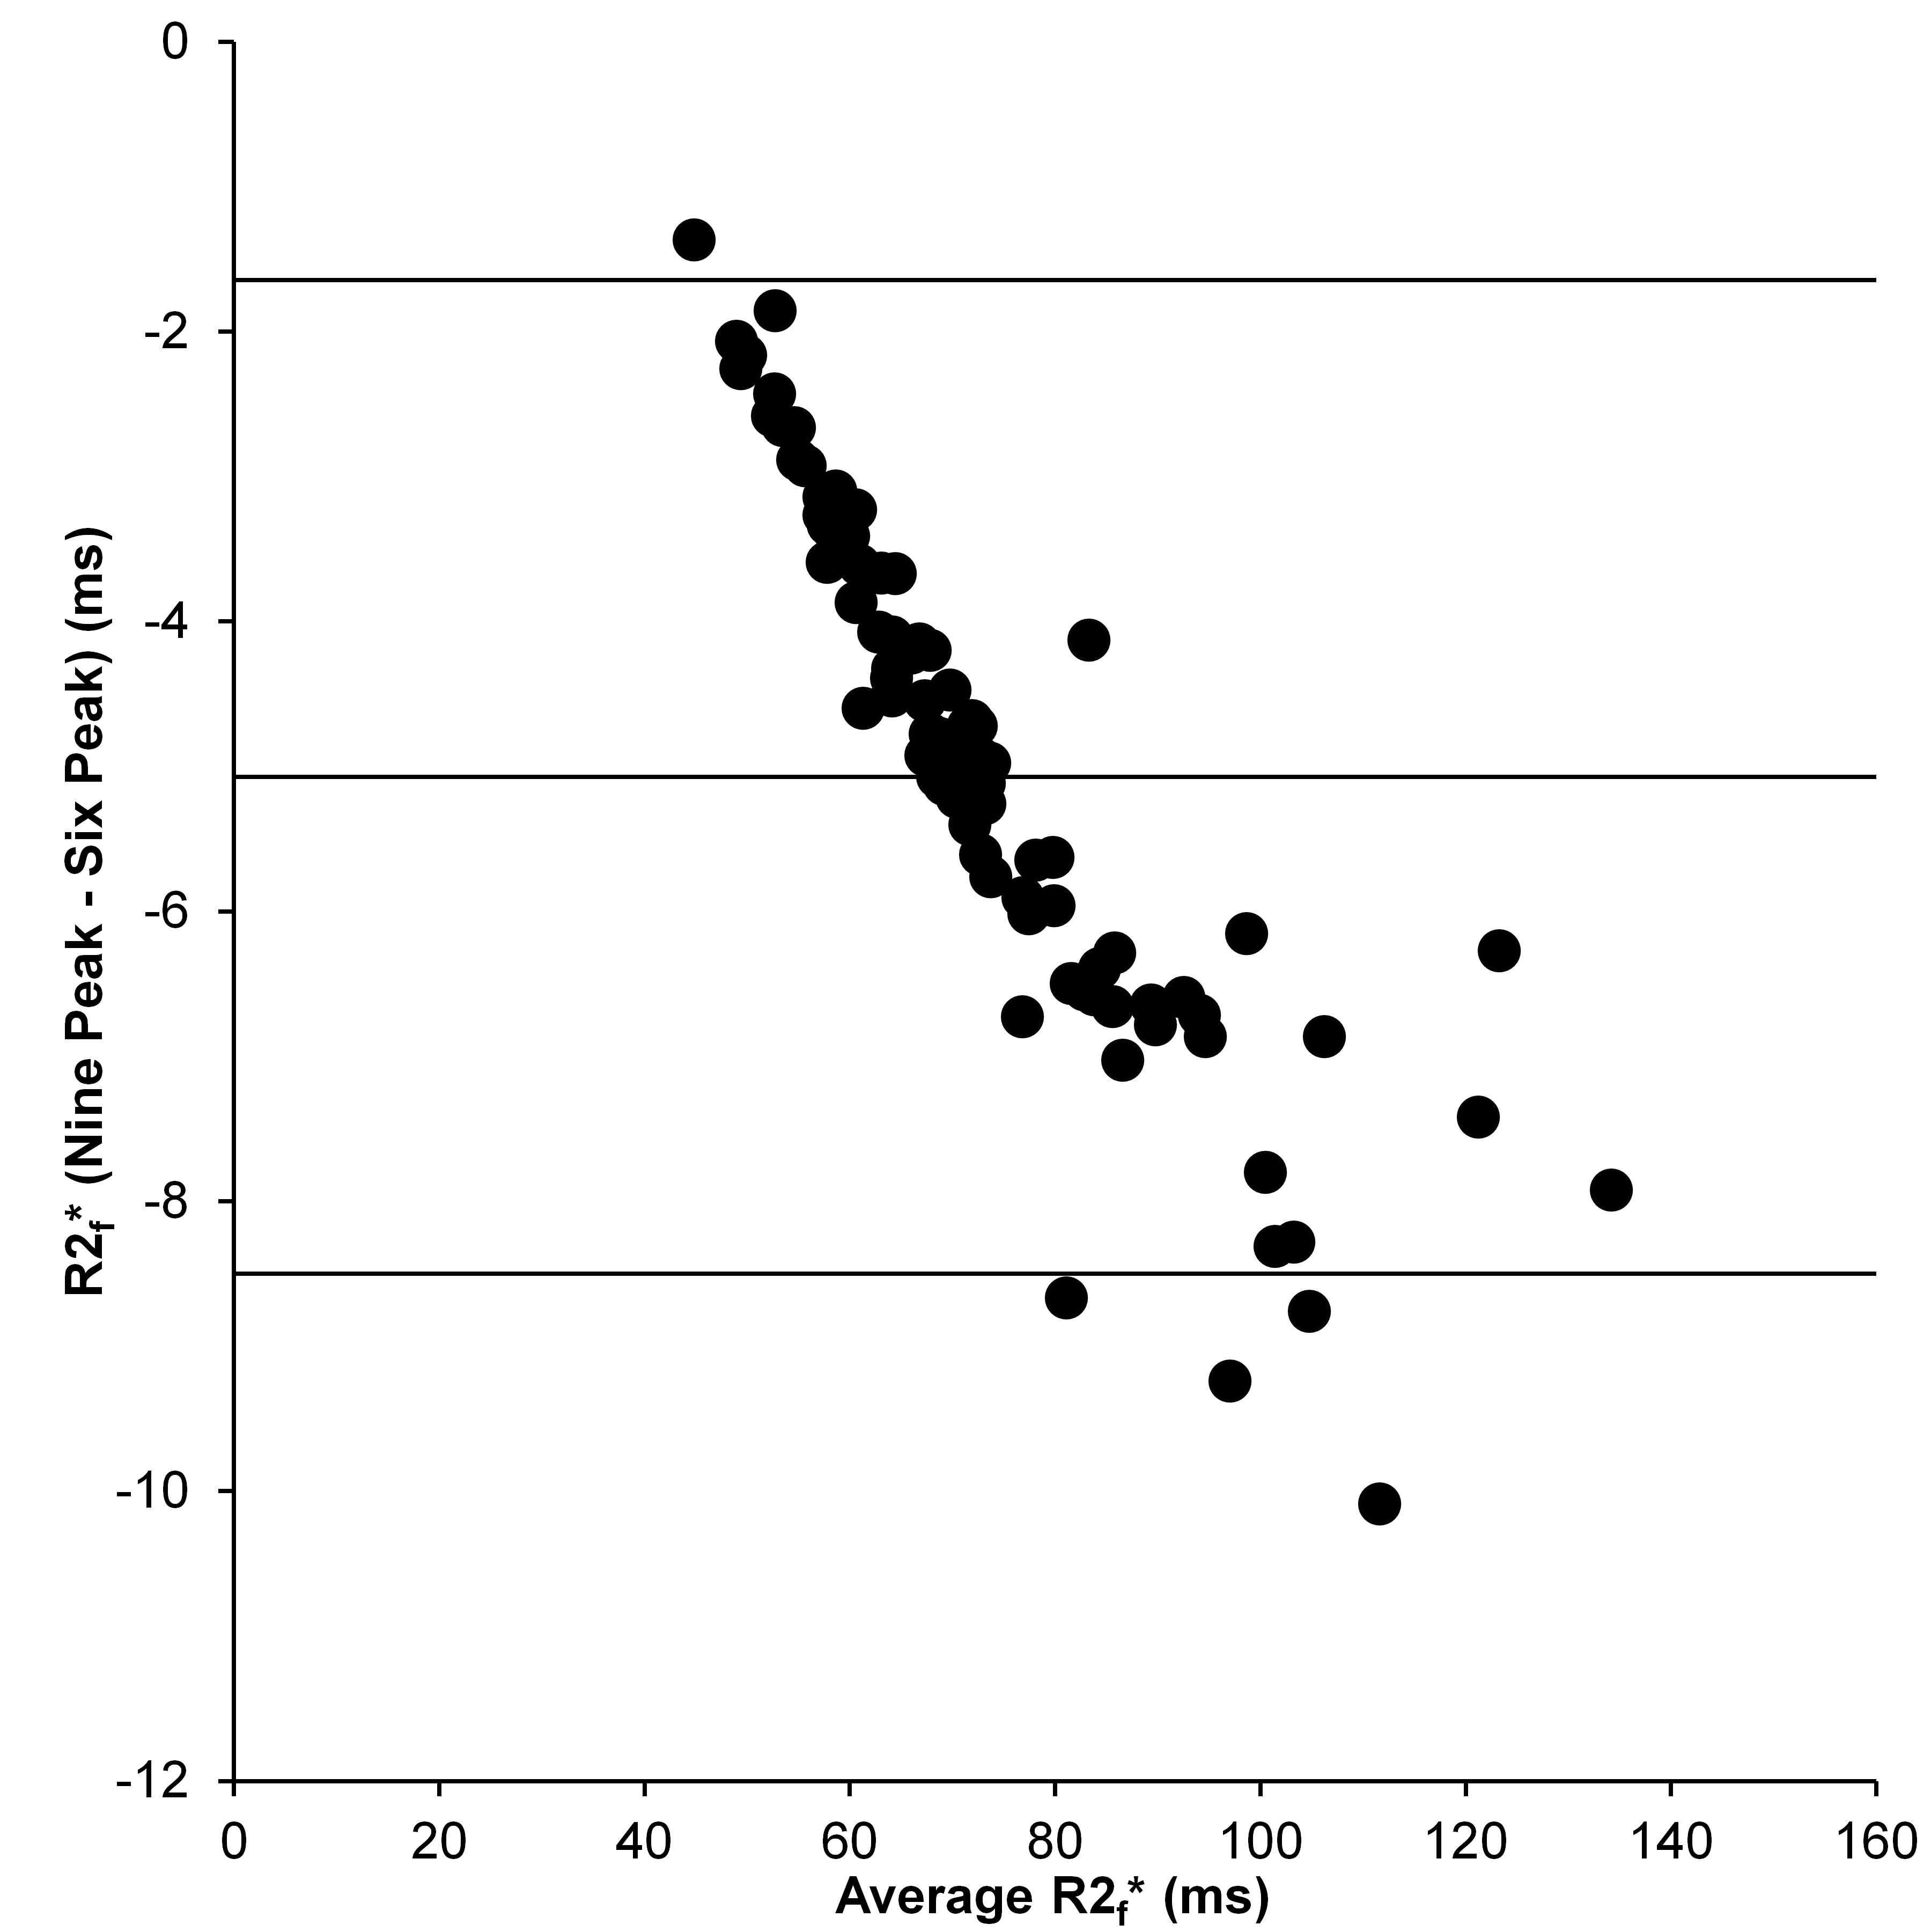
Bland-Altman comparison of R2f* given by the 6- and 9-peak models.
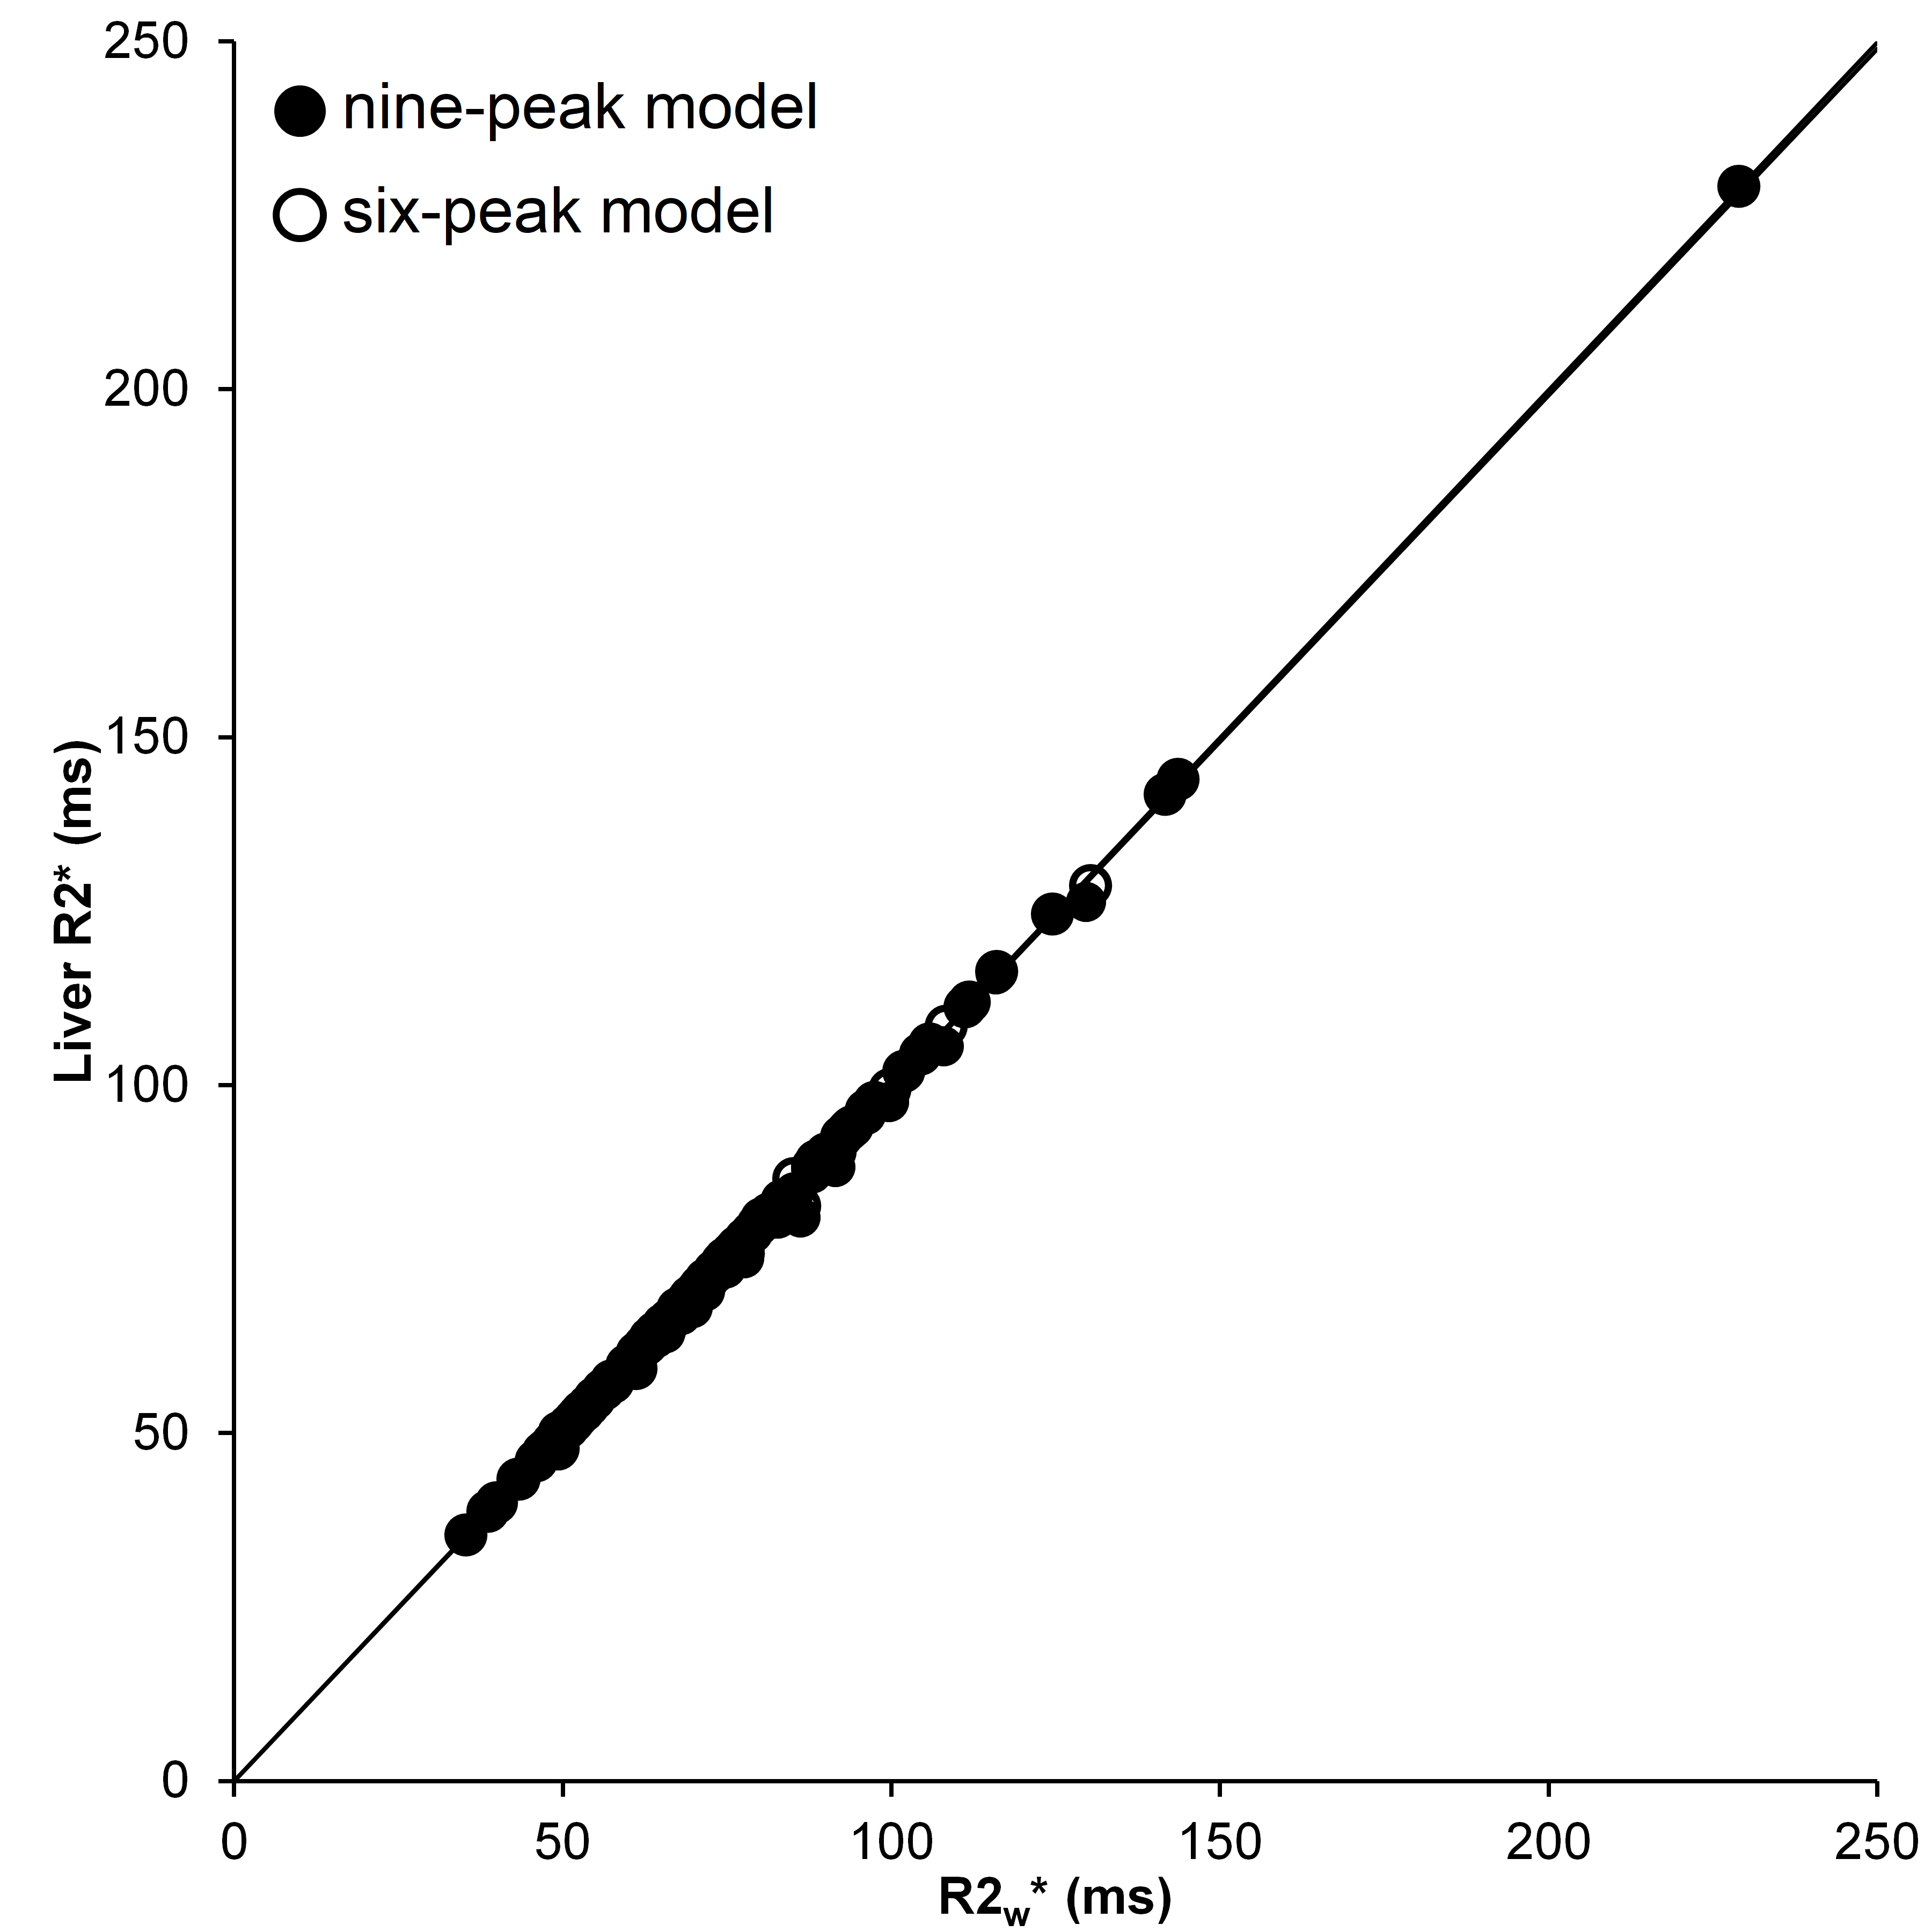
Comparison of the R2liver* and R2w* estimated by the 6- and 9-peaks models