0596
Laminar profiling in advanced susceptibility imaging reveals variations in iron and myelin concentrations1Department of Electrical and Computer Engineering, Seoul National University, Seoul, Korea, Republic of
Synopsis
The in-vivo imaging of iron and myelin concentrations along cortical laminae in the brain has significance in advancing knowledge about the roles of iron and myelin in brain function and in disease. In this study, we apply χ-separation, a recently developed advanced susceptibility imaging method, to explore changes in iron and myelin content throughout the cortex and into the white matter. Our findings show that iron and myelin peak at different laminar surfaces and that there is regional differences in the intensity profiles. The results suggest regional and laminar variation of iron and myelin throughout the brain.
INTRODUCTION
The spatial variation of iron and myelin concentrations across cortical laminae have been described in previous ex vivo studies1,2. In particular, high iron levels in the superficial white matter (SWM) regions, high intracortical myelination, and the colocalization of iron and myelin were observed, with regional differences. The in-vivo imaging of such iron and myelin distributions across the brain has many implications for studying the functional role of iron and myelin, as well as in ageing and in disease. Recent advanced susceptibility imaging methods3-5 such as χ-separation5 allow the separation of susceptibility signals into positive and negative source distributions, which can measure paramagnetic iron and diamagnetic myelin, respectively. The objective of this study is to investigate laminar distributions of iron and myelin across the cortex and underlying white matter in vivo using χ-separation. We present laminar profiles of χ-separation positive (χpos) and χ-separation negative (χneg) maps, along with quantitative susceptibility mapping (QSM), in two representative regions reported to harbor contrasting levels of iron and myelin2.METHODS
[Image Acquisition and Processing] Five volunteers were scanned at 3T MRI. Multi-echo gradient-echo (MEGE) data were acquired in 6 head positions in the following parameters: resolution=1×1×1 mm3, TR=38 ms, TE=7.7/5/32.9 ms, and flip angle=15°. 3D T1 weighted images were acquired using the MPRAGE sequence with the following parameters: resolution=1×1×1 mm3, FoV=256×256×224 mm3, TR/TI=2400/1000 ms. The MEGE data were reconstructed into QSM using COSMOS (Calculation Of Susceptibility through Multiple Orientation Sampling)6, and further separated into positive and negative susceptibility source maps using χ-separation3. The T1 weighted data were processed with FreeSurfer v.6.0.7 to obtain parcellated regional labels and vertex-wise pial surfaces and gray-white matter (GM-WM) boundary surfaces.[ROI Selection] The choice of regions-of-interest (ROI) for laminar analysis was based on a previous finding of regional distribution of SWM iron levels2. The ROIs were placed in the fundus (deepest part) of the sulcus. Specifically, sulcal areas of the middle frontal and insula were chosen on a single coronal slice in each subject (Fig. 2). To ensure consistent areas were selected across each subject, we cross-referenced two atlases. The high-SWM-iron level region was defined as “left rostral middle frontal cortex” and the “left middle frontal sulcus” on the Desikan-Killiany atlas8 and Destrieux atlas9 respectively. The low-SWM-iron level region was defined as “left insular cortex” and “left superior part of the central sulcus of insula” respectively.
[Laminar Profiling] Laminar surfaces in the cortex were calculated at 10% fractional intervals using an Equivolume model10,11, resulting in 11 surfaces corresponding to 0~100% cortical depth. The QSM and χ-separation maps were sampled at each vertex along the surfaces to create a laminar profile. The images were also sampled at points projected inwards from the GM-WM boundary to the SWM and deep WM at 10% fractional intervals, reaching 200% cortical depth.
RESULTS
Average profiles across subjects show that iron is dominant in the middle frontal sulcus, while myelin is dominant in the insular sulcus (Fig. 3). Individual profiles confirm that the laminar distribution patterns in each region are consistent across subjects (Fig. 4). In both regions, iron shows a pattern of peaking towards the SWM area (located between 100~150% cortical depth), while myelin peaks after the point of 150% cortical depth. The QSM, which is equivalent to the sum of χ-separation maps, shows a profile that is overall similar to that of the χpos map, but with slightly different peaking points due to the bias from myelin. In particular, in the middle frontal sulcus of subjects 1,2, and 5, the QSM signal peaks in the cortex while the χpos map peaks in the SWM. Regarding noise, signals near the pial surface harbor many artefacts, with contribution from vessels. Thus, signals from cortical depths of 0~60% are deemed unreliable and are not considered in the interpretation. Also in some subjects, myelin levels in the insular area decrease near 200% cortical depth, which is possibly due to influence from reduced myelin signals in the neighboring deep gray matter (e.g., putamen).DISCUSSION AND CONCLUSION
Our study demonstrates that there are regional differences in the concentration of iron and myelin along the laminae from the cortex to the underlying white matter. In both regions, iron levels peak in the SWM and myelin peaks after the SWM. The frontal sulcus has a higher iron content relative to the insular sulcus, and vice versa for the myelin content. The different peaking points of QSM and χpos map in some areas is consistent with previous findings of an increased iron content in the SWM relative to the cortex2. This also suggests interpretations regarding iron content from QSM must be made with caution, as it is a sum of both positive and negative susceptibility sources and as such, iron measurement may be biased by myelin contributions. Our study highlights the usefulness of χ-separation in the investigation of iron and myelin.Acknowledgements
NRF-2021R1A2B5B03002783References
1. Fukunaga, Masaki, et al. "Layer-specific variation of iron content in cerebral cortex as a source of MRI contrast." Proceedings of the National Academy of Sciences 107.8 (2010): 3834-3839.
2. Kirilina, Evgeniya, et al. "Superficial white matter imaging: Contrast mechanisms and whole-brain in vivo mapping." Science advances 6.41 (2020): eaaz9281.
3. Shin, Hyeong-Geol, et al. "𝜒-separation: Magnetic susceptibility source separation toward iron and myelin mapping in the brain." NeuroImage 240 (2021): 118371.
4. Chen, Jingjia, et al. "Decompose quantitative susceptibility mapping (QSM) to sub-voxel diamagnetic and paramagnetic components based on gradient-echo MRI data." NeuroImage 242 (2021): 118477.
5. Emmerich, Julian, et al. "On the separation of susceptibility sources in quantitative susceptibility mapping: Theory and phantom validation with an in vivo application to multiple sclerosis lesions of different age." Journal of Magnetic Resonance 330 (2021): 107033.
6. Liu, Tian, et al. "Calculation of susceptibility through multiple orientation sampling (COSMOS): a method for conditioning the inverse problem from measured magnetic field map to susceptibility source image in MRI." Magnetic Resonance in Medicine: An Official Journal of the International Society for Magnetic Resonance in Medicine 61.1 (2009): 196-204.
7. Fischl, Bruce. "FreeSurfer." Neuroimage 62.2 (2012): 774-781.
8. Desikan, Rahul S., et al. "An automated labeling system for subdividing the human cerebral cortex on MRI scans into gyral based regions of interest." Neuroimage 31.3 (2006): 968-980.
9. Destrieux, Christophe, et al. "Automatic parcellation of human cortical gyri and sulci using standard anatomical nomenclature." Neuroimage 53.1 (2010): 1-15.
10. Waehnert, M. D., et al. "Anatomically motivated modeling of cortical laminae." Neuroimage 93 (2014): 210-220.
11. Wagstyl, K., et al. (2018). Equivolumetric layering for mesh surfaces (v1.0.0). Zenodo. https://doi.org/10.5281/zenodo.1442584
Figures
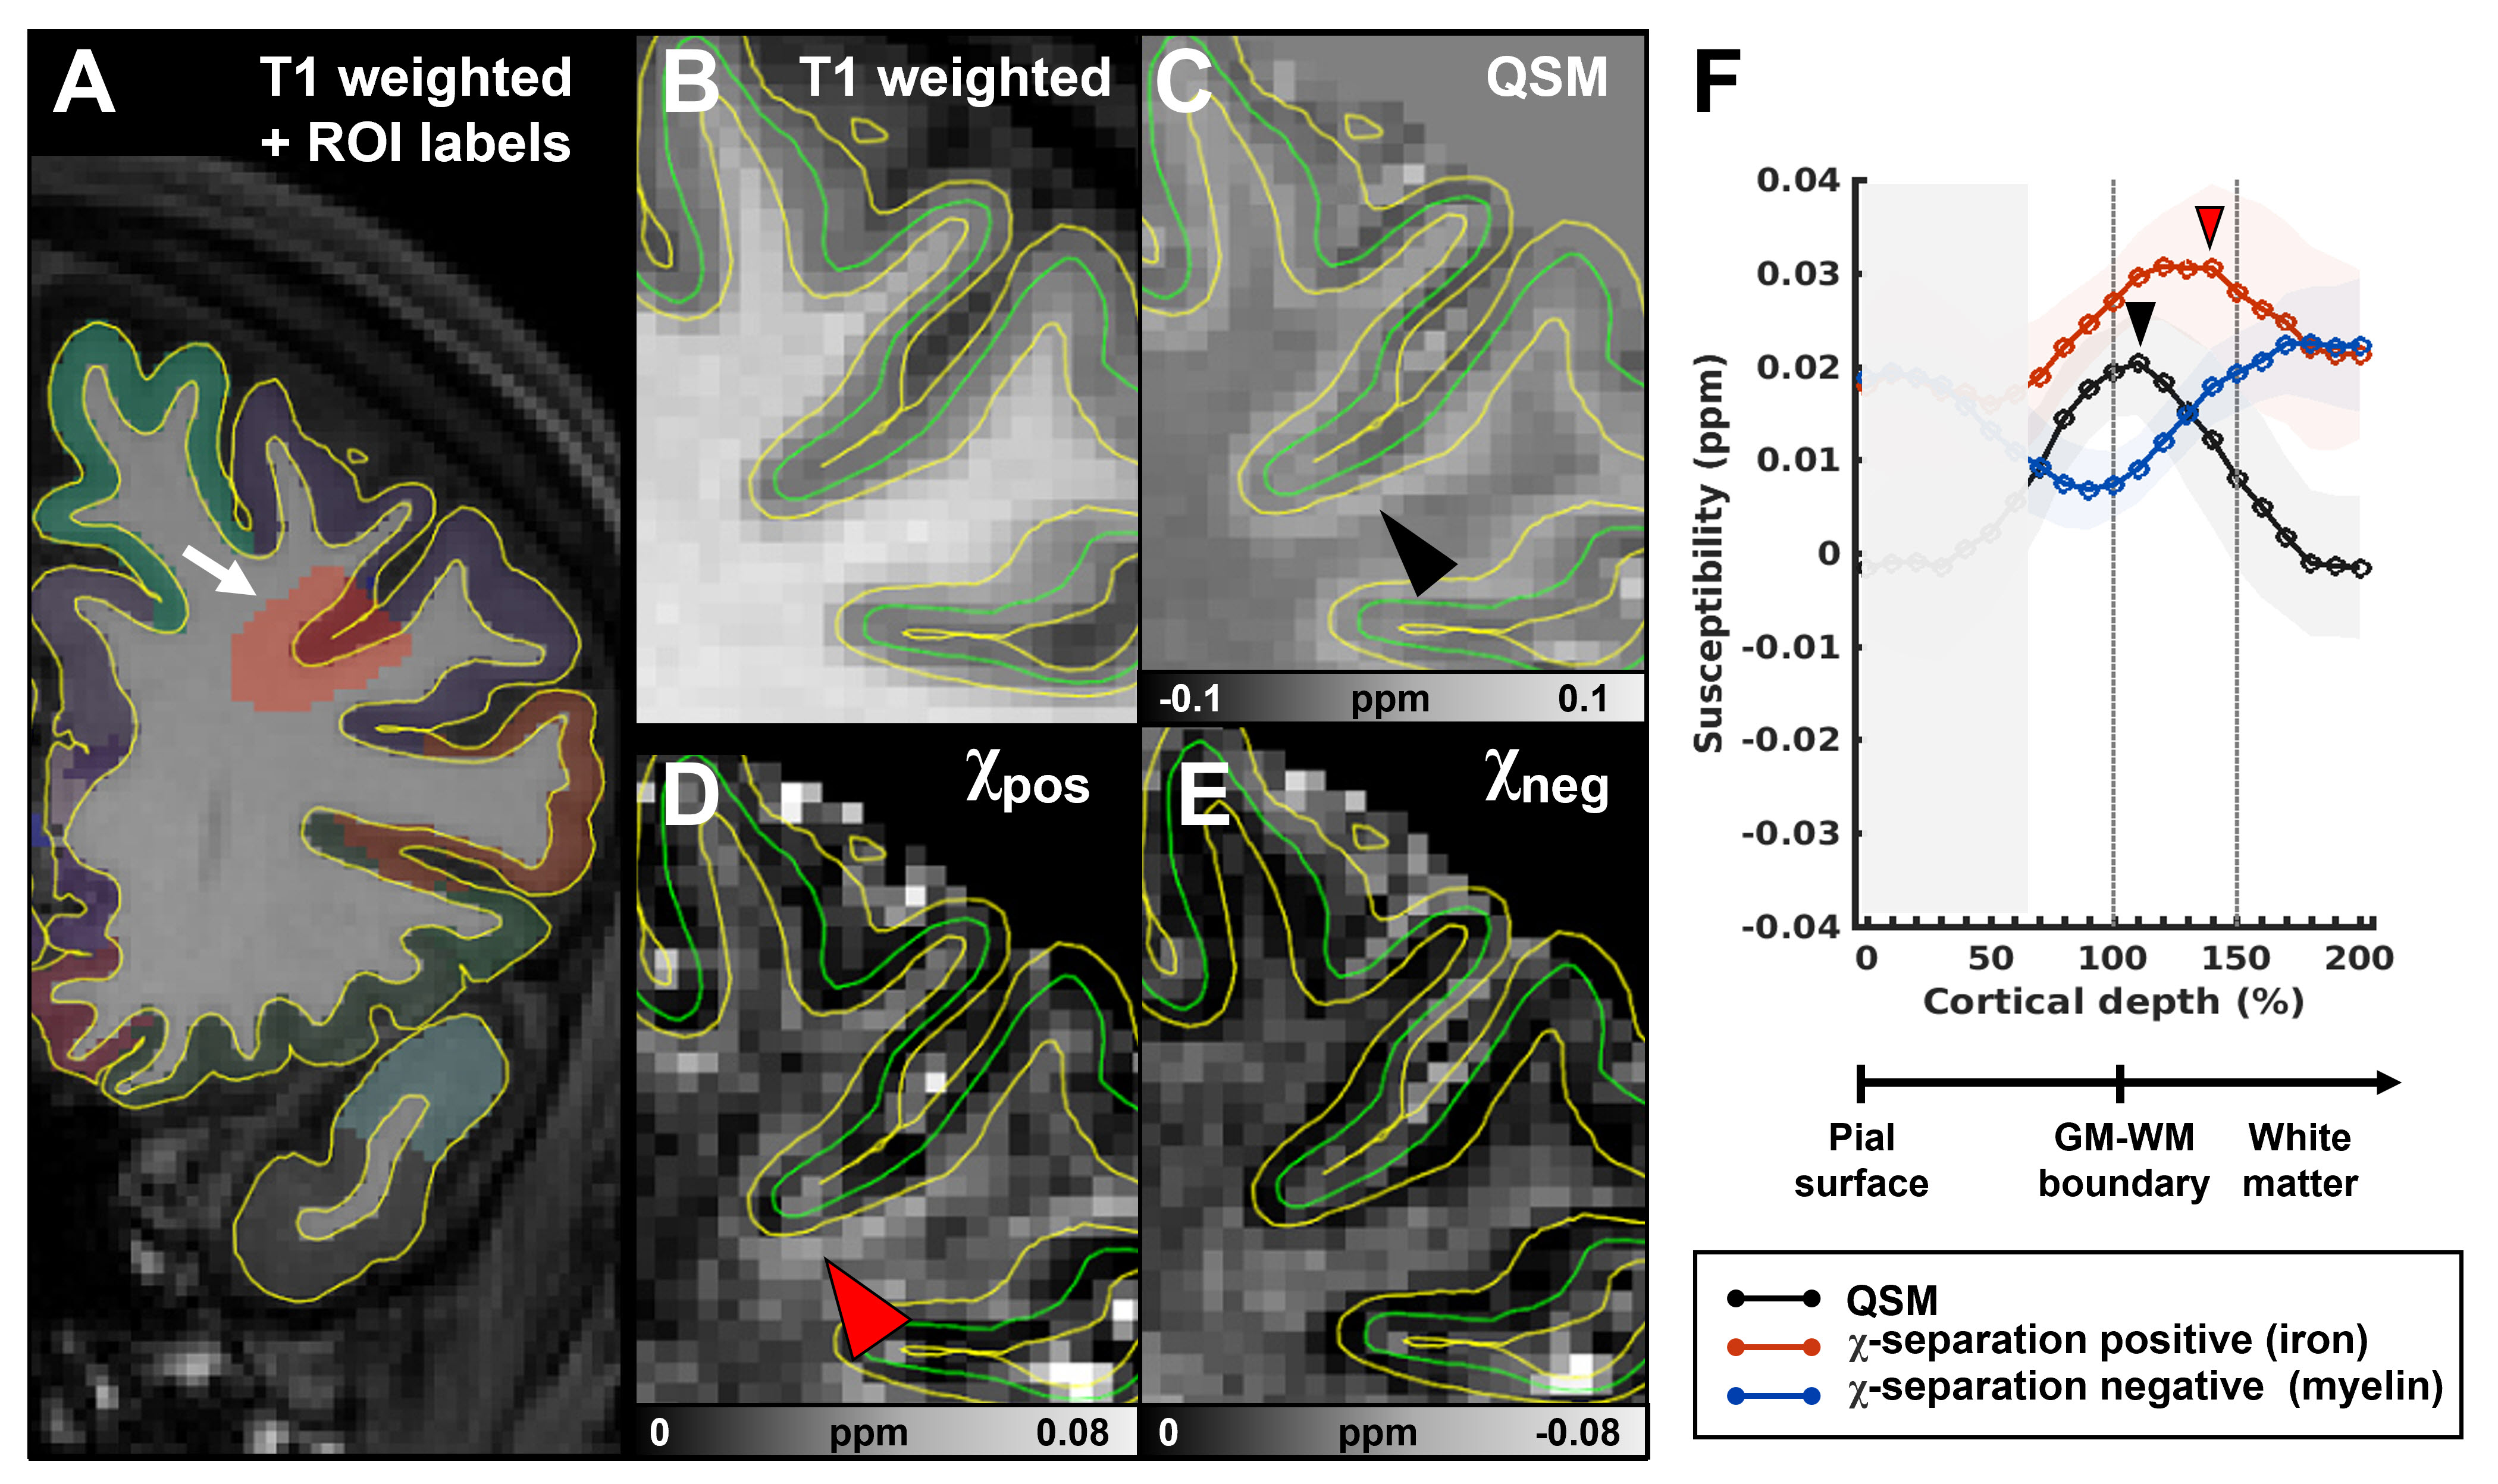
Fig 1. Overview of the laminar profiling analysis. (A) The ROI (red shaded area) is indicated by a white arrow. Enlarged views of the shaded area are shown on T1 weighted image (B), QSM (C), and two χ-separation maps (χpos (D) and χneg (E)). Pial and GM-WM boundary surfaces (yellow lines) and 50% midpoint of the cortex (green lines) are shown. Other surfaces are not shown. Laminar profiles of the ROI for QSM, χpos, and χneg are shown (F), with standard deviations in shaded areas. Black arrowheads (C, F) and red arrowheads (D, F) indicate peak susceptibility in the QSM and χpos respectively.
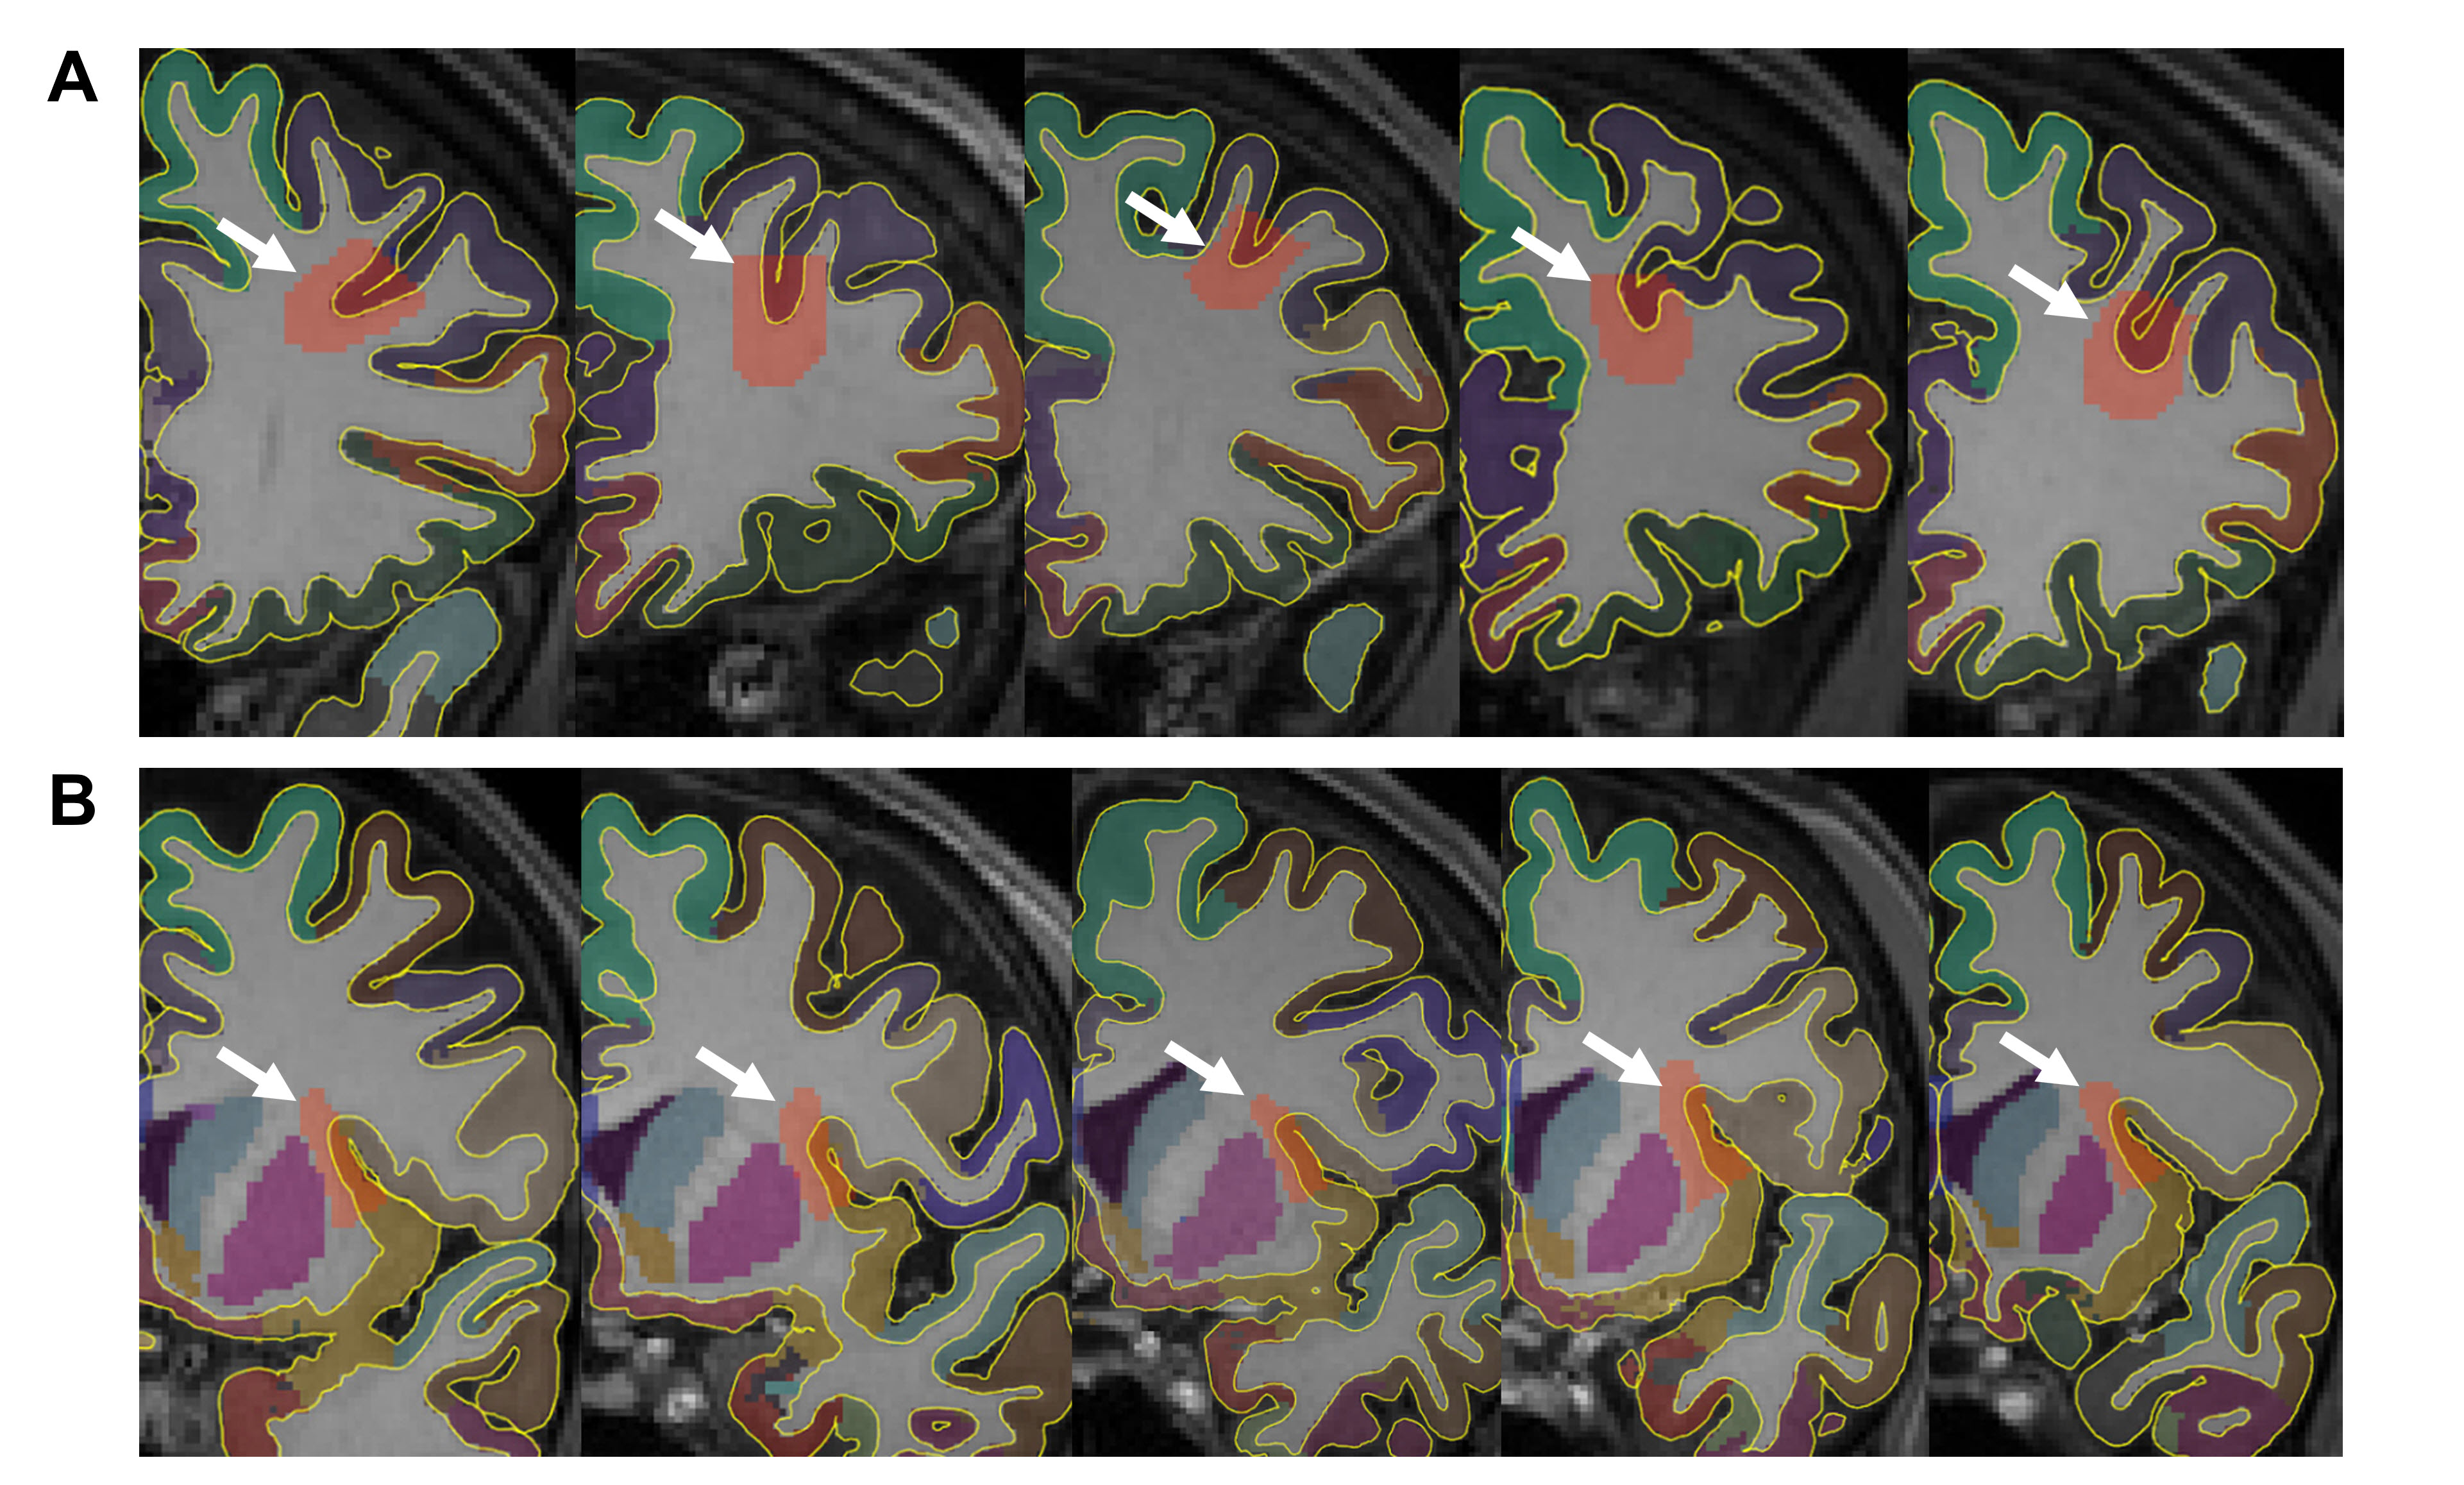
Fig 2. Coronal slices of regions analyzed for each subject. Regional parcellation labels (based on the Desikan-Killiany atlas) are overlaid on T1 weighted images of subjects 1 to 5 (left to right). Sections of the middle frontal sulcus (A) and superior part of the central sulcus of the insula (B) that are analyzed for laminar profiling are shown in red shaded areas and indicated by white arrows.
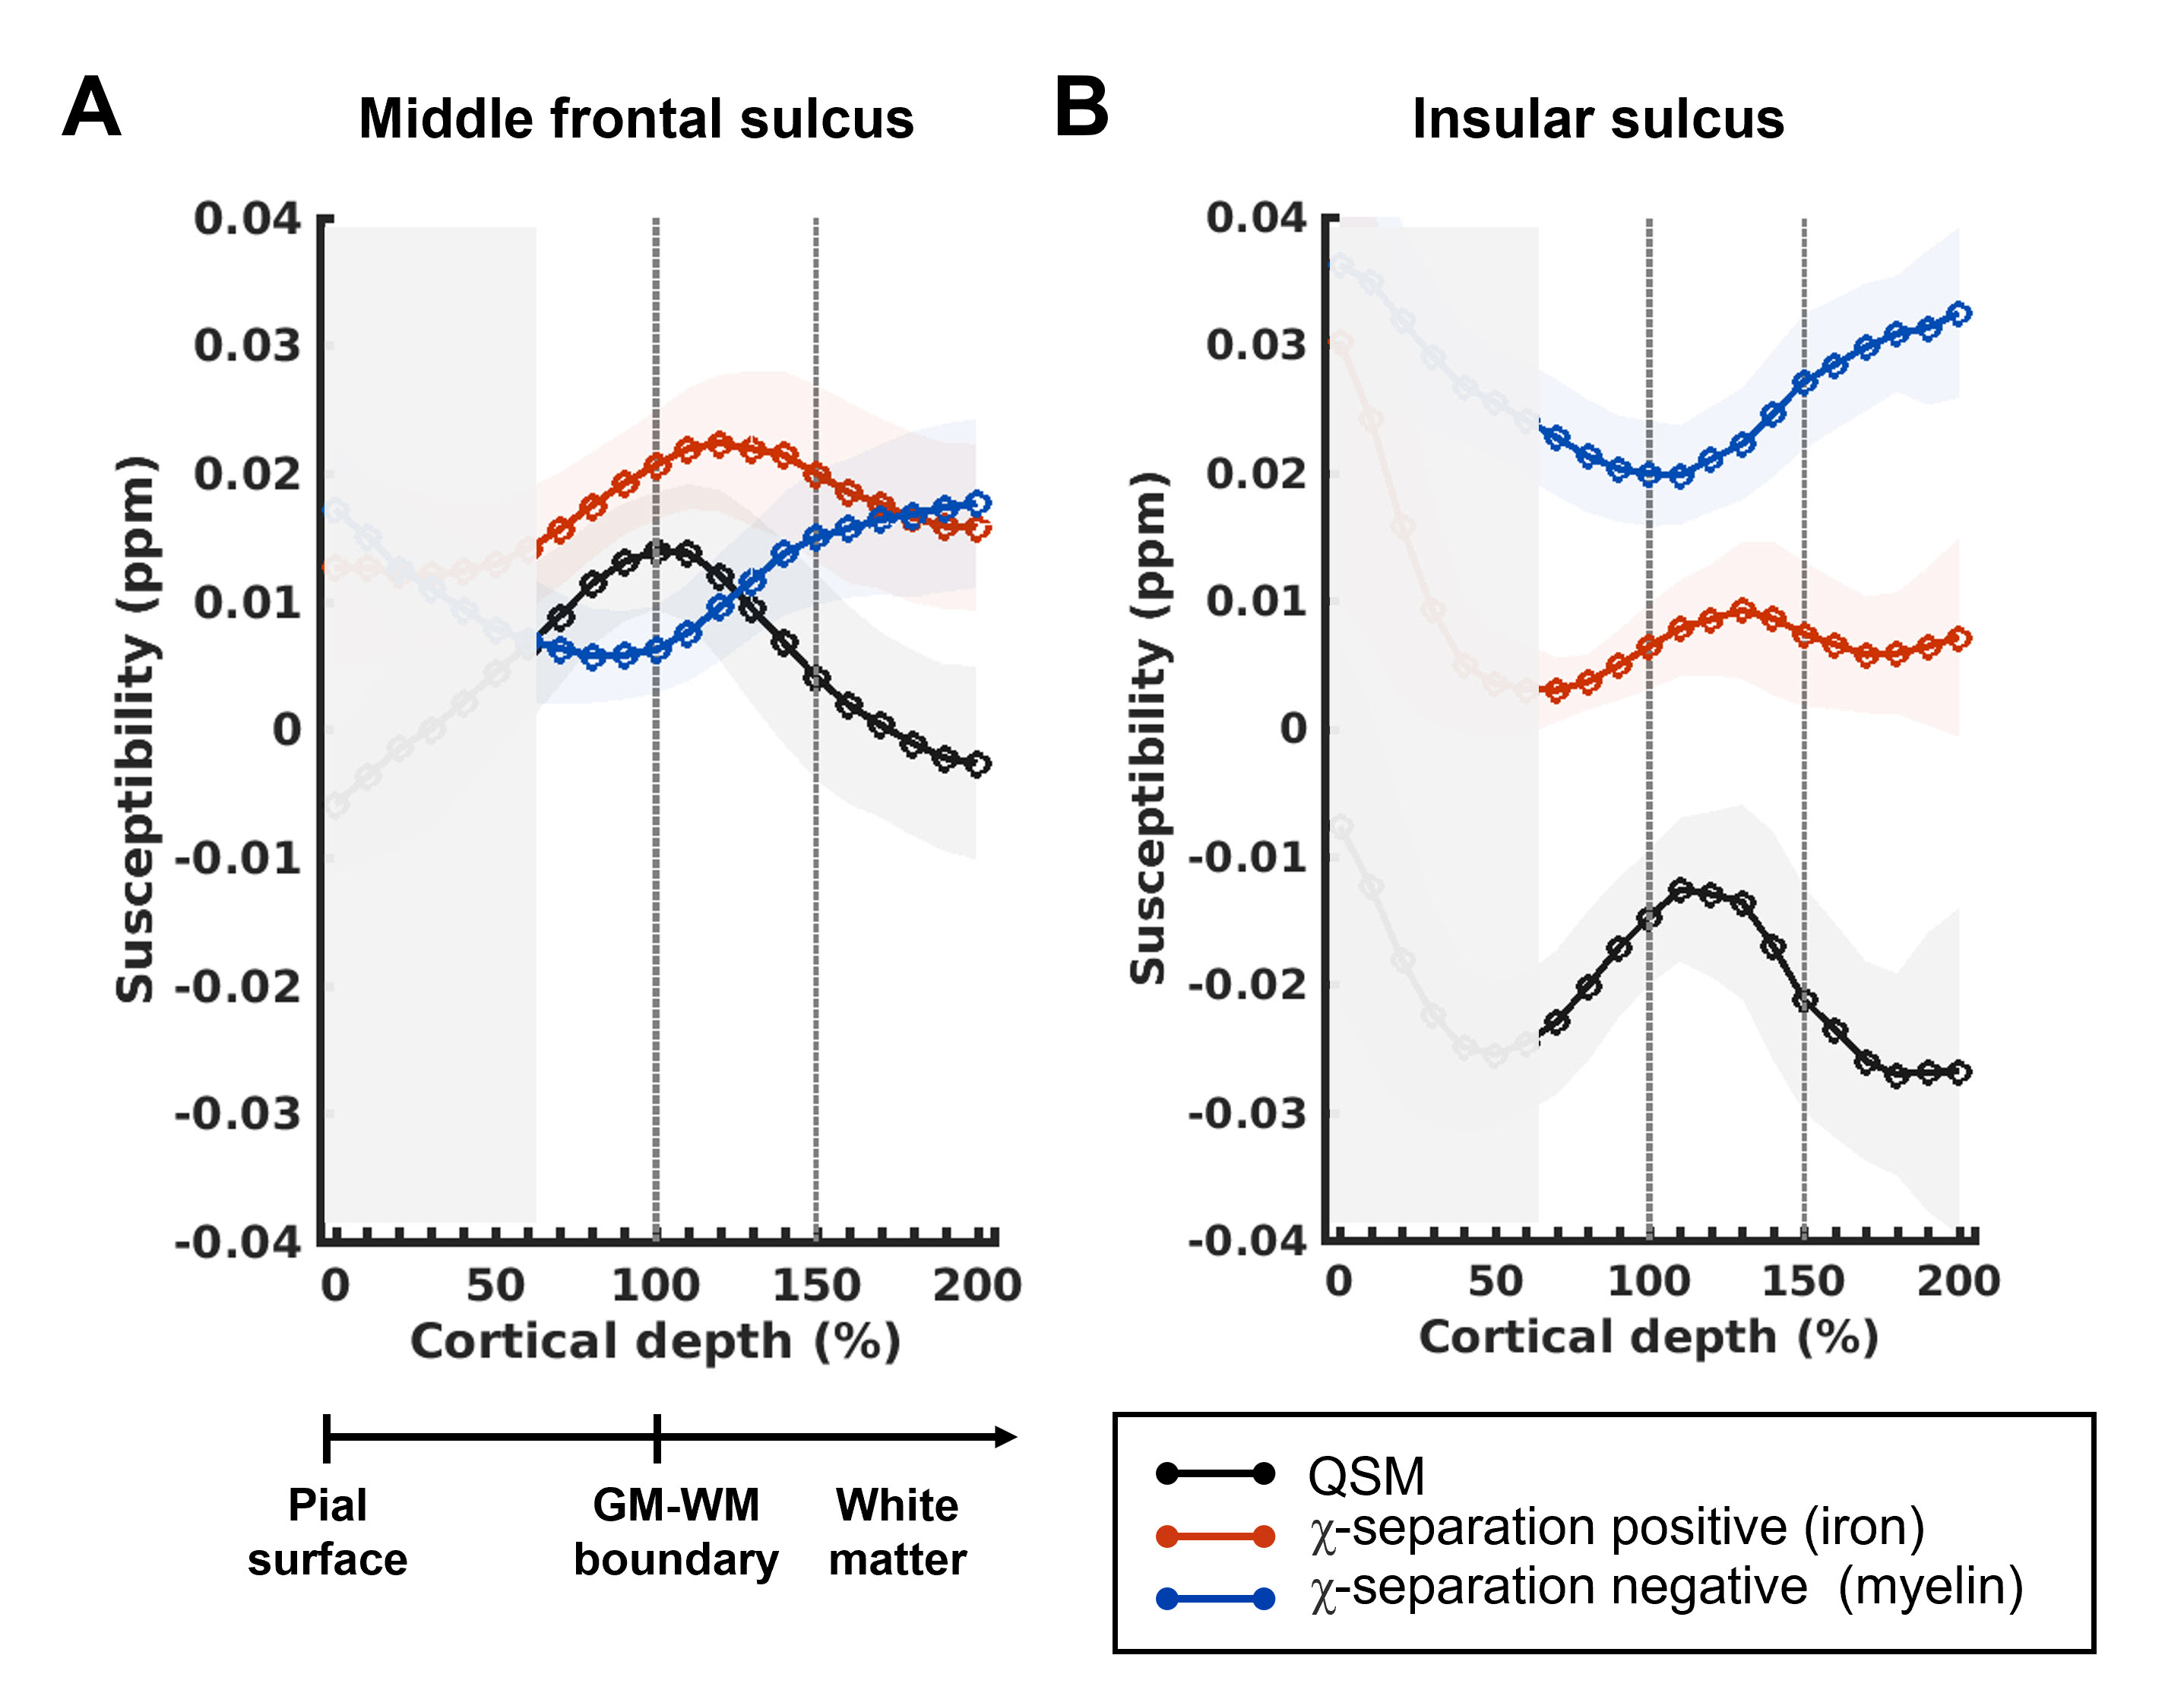
Fig 3. Average laminar profiles across subjects. Profiles of QSM, χpos and χneg, averaged across 5 subjects, are plotted at 10% fractional intervals from the pial surface (cortical depth 0%), past the SWM (cortical depth 100~150%) to the deep white matter (cortical depth 150%~). Standard deviations are shown in shaded areas. Cortical depths of 0~60% are grayed out due to artifacts. On average, χpos peaks at SWM whereas χneg continue to increase in deep white matter. This pattern is consistent in both regions. The insula has substantially higher myelin levels and lower iron levels (B).
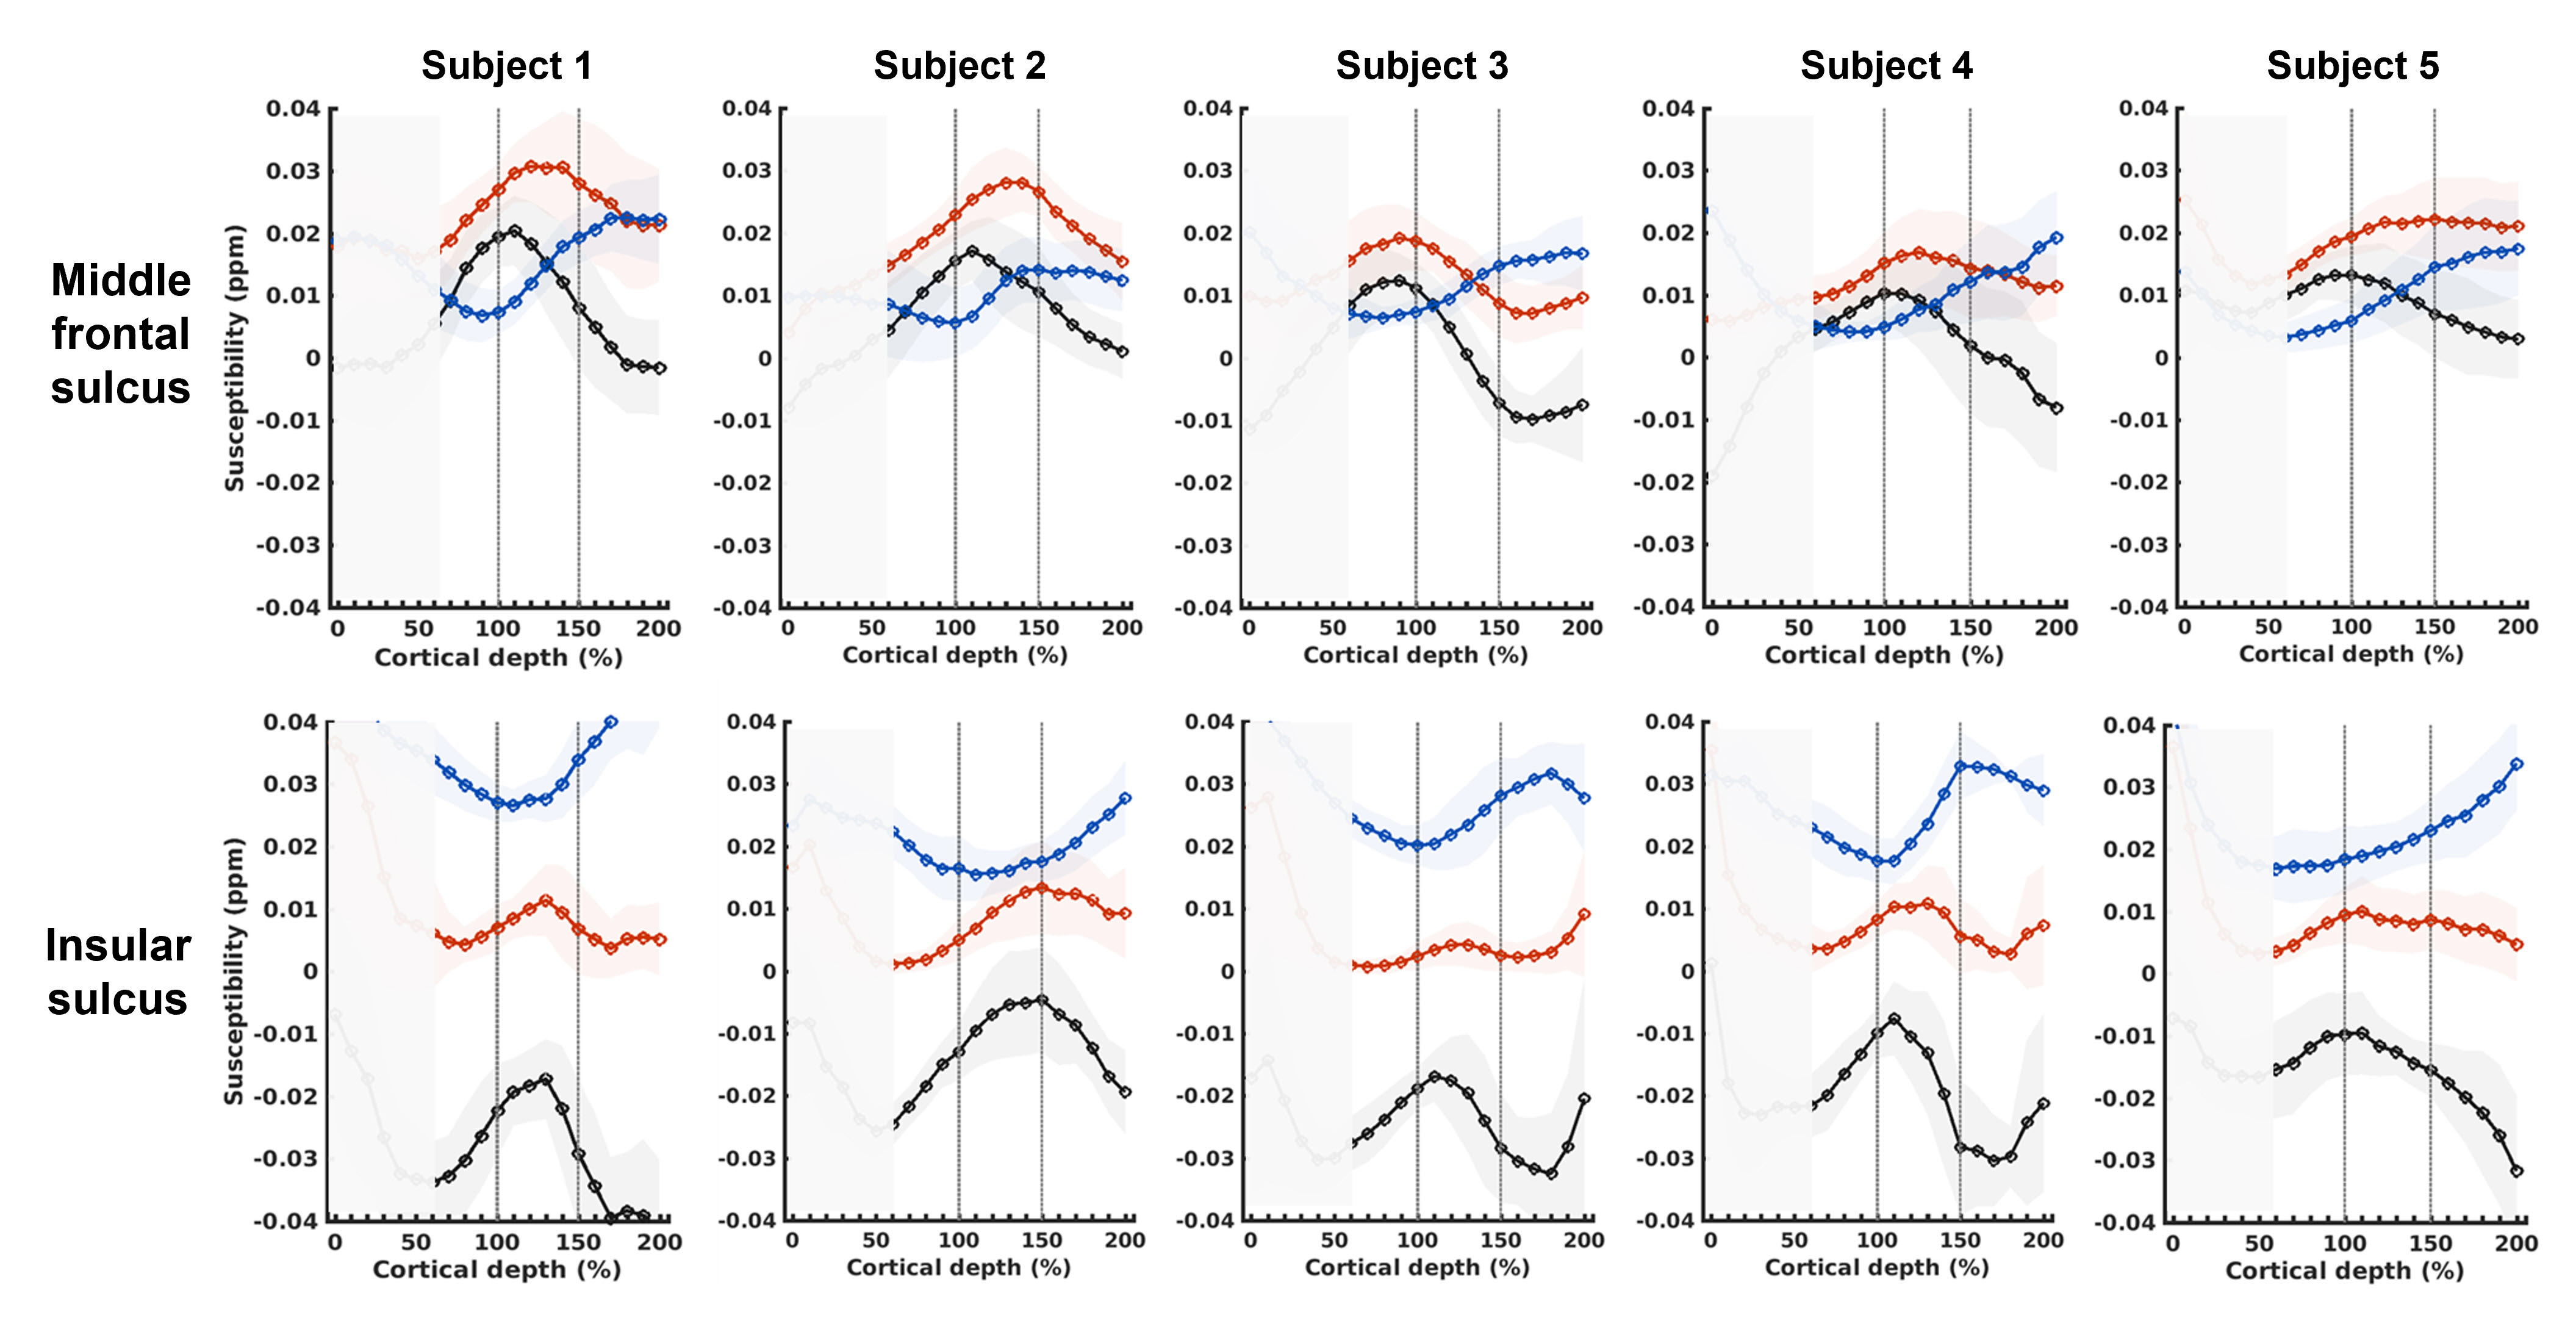
Fig 4. Individual subject laminar profiles. Overall pattern of intensity changes across the laminae (in which iron peaks in 100 to 150% cortical depth and myelin peaks after 150% cortical depth) are similar across subjects in both regions. Furthermore, levels of iron are much lower and those of myelin are much higher in insular sulcus when compared to those in middle frontal sulcus. This region-specific pattern is consistent across subjects. Peaks of QSM profiles are located at lower cortical depths than those of χpos profiles, suggesting the QSM profile may not properly reflect SWM.