0595
Investigating the relationship between cortical myelin and functional brain activity1School of Psychology, CUBRIC, Cardiff University, Cardiff, United Kingdom, 2Department of Neuroscience, Imaging and Clinical Sciences, University “G. d'Annunzio” of Chieti-Pescara, Chieti, Italy, 3Institute for Advanced Biomedical Technologies, University “G. d'Annunzio” of Chieti-Pescara, Chieti, Italy, 4MS Centre, Neurology Unit, “SS. Annunziata” University Hospital, Chieti, Italy, 5Division of Psychological Medicine and Clinical Neurosciences, School of Medicine, Cardiff University, Cardiff, United Kingdom, 6Helen Durham Centre for Neuroinflammation, University Hospital of Wales, Cardiff, United Kingdom
Synopsis
The role of cortical myelin for cortical function is still under debate. Here we investigate the relationship between cortical myelination (represented by R1) and functional activation (represented by BOLD-fMRI and arterial spin labelling CBF signals) during the execution of a motor task. We demonstrate associations between cortical myelination and functional activity in a subset of task-responding regions. We observe a decrease of the significance of these relationships in the deeper cortical layers.
Introduction
Myelin is a mixture of proteins and phospholipids forming an insulating sheath wrapped around axons to provide electrical insulation and metabolic support1. The functions of white matter myelin have been extensively studied, but less is known about the role of grey matter (GM) myelination. Myelination of GM axons is variable2. It may play a role in the synchronizing conduction velocities over a network3, suggesting that cortical myelination may tell us about the nature of communication in specific neural networks and its efficiency. MRI methods have been developed to investigate the myelin content4 in-vivo in individual cortical areas that principally exploit the sensitivity of the MR longitudinal relaxation time (T1) to myelin content5,6,7,8,9,10. Previous works have demonstrated a direct relationship between longitudinal relaxation rate (R1=1/T1) and myelin content11,12. There is good correspondence between histological data and distinct cortical myelin patterns observed with MRI13,14. Approaches to investigate myelination in the GM have been developed based on inversion recovery (e.g. MPRAGE) acquisition15, such as MP2RAGE16, to extract quantitative R1 maps from the ratio of two MPRAGE images acquired with different excitation flip angles and inversion times. R1 maps are usually corrected for the effects of variation in radio-frequency receive field B1 and R2*. The MP2RAGE technique has been widely used to detect variation in myelination across the cortex8,17.Recent animal work has demonstrated the connection between cortical myelination and electrical activity18,19, suggesting that the amount of cortical myelin in a region predicts the magnitude of electrophysiological responses. In humans, a positive relationship between GM myelination and electrophysiological networks assessed with MEG was reported 20, suggesting that myelin supports functional networks. Whether these relationships are also observable with functional MRI has not been explored yet. Here, we investigate the relationship between cortical myelination (represented by R1 from MP2RAGE) and functional activity during a motor task assessed with ASL-CBF and BOLD-fMRI.
Methods
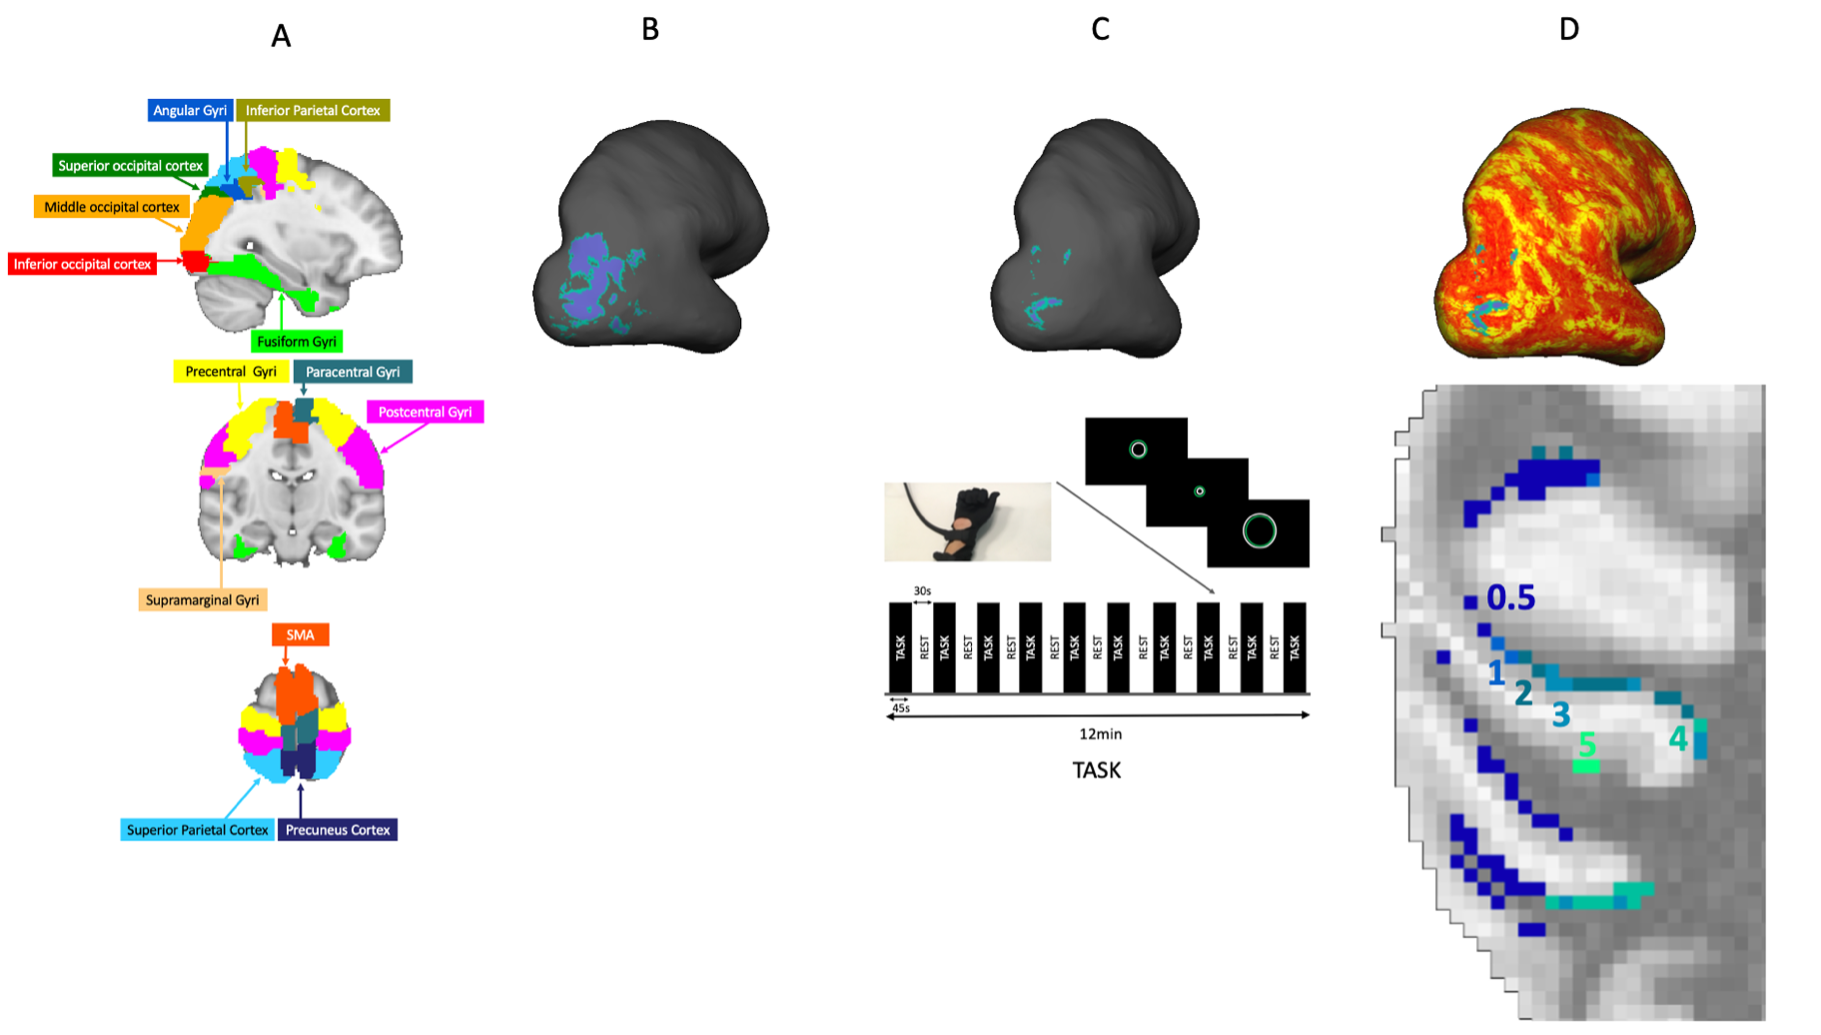
20 participants (27.5±3.8 years old; 11F/9M) underwent a 3T-MRI session (Siemens Prisma) during which a structural scan was acquired to obtain in-vivo whole brain quantitative T1 maps (MP2RAGE16 1mm isotropic resolution, TI1=700ms, TI2=1500ms, TR/TE=5000/3.24ms, scan time=7:55min). Perfusion images (dual-excitation pseudo-continuous arterial spin labelling acquisition; TE1=10ms, TR1=3600ms, TE2=30ms, TR2=800ms, labelling duration=1.5s, post-labelling delay=1.5s, slice thickness=7mm, GRAPPA acceleration factor=3, scan time=12min) were acquired during the execution of a motor task (Fig.1-C) to provide ASL-CBF and BOLD-fMRI measures. Participants used an MRI-compatible right-hand 5DT-DataGlove (https://5dt.com/5dt-data-glove-ultra/) with fibreoptic sensors to control the size of a green circle (participant controlled), which they had to match to the size of a white circle (target) by squeezing their hand into a fist. The white circle expanded and contracted in a fixed sequence. 26 regions-of-interests were chosen a priori (Fig.1-A) based on automated anatomical labelling atlas (AAL) and transformed to subject-native space (Fig.1-B). FEAT (https://fsl.fmrib.ox.ac.uk) was used to quantify functional responses (BOLD and CBF) to the motor task. The resulting images were then masked by each ROI and thresholded at 80th percentile to retain only the voxels positively responding to the task execution and then individually masked for GM (Fig.1-C). The resulted areas (intersection between functional peaks and ROIs) were then transformed to the space of the R1 brain (Fig.1-D). Mean R1 in these areas was extracted using FreeSurfer ‘mris_calc’ tool at different relative cortical depths (0.5, 1, 2, 3, 4 and 5). BOLD and CBF mean responses were extracted in each of the intersected areas. Pearson correlation tests (Rstudio) were carried out, across participants, separately for each ROI and for each cortical depth between R1 values (our indicator of cortical myelination) and CBF, and between R1 values and BOLD. Correlations were then transformed to z score and a linear regression (Rstudio) was used to investigate the variation of the functional activity-R1 correlations with the increase of cortical depth. Pearson correlation tests were carried out between cortical thickness and R1 for each ROI and for each cortical depth to investigates such associations as a possible confounder.Results
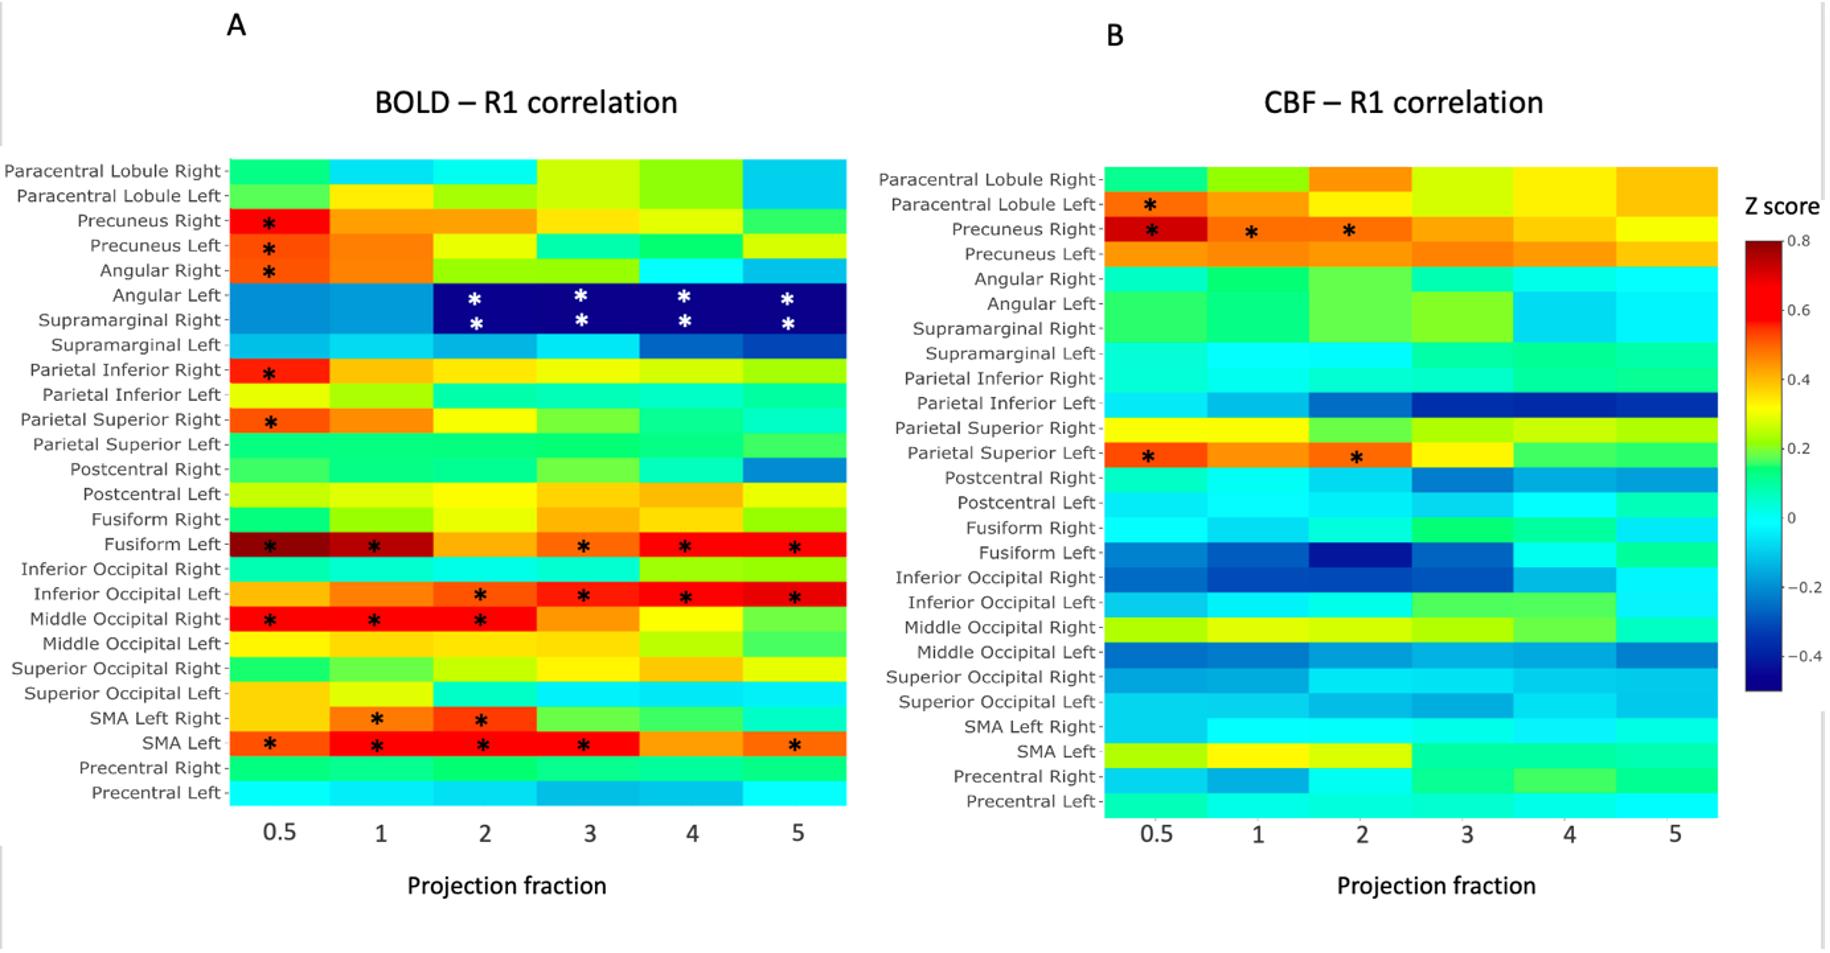
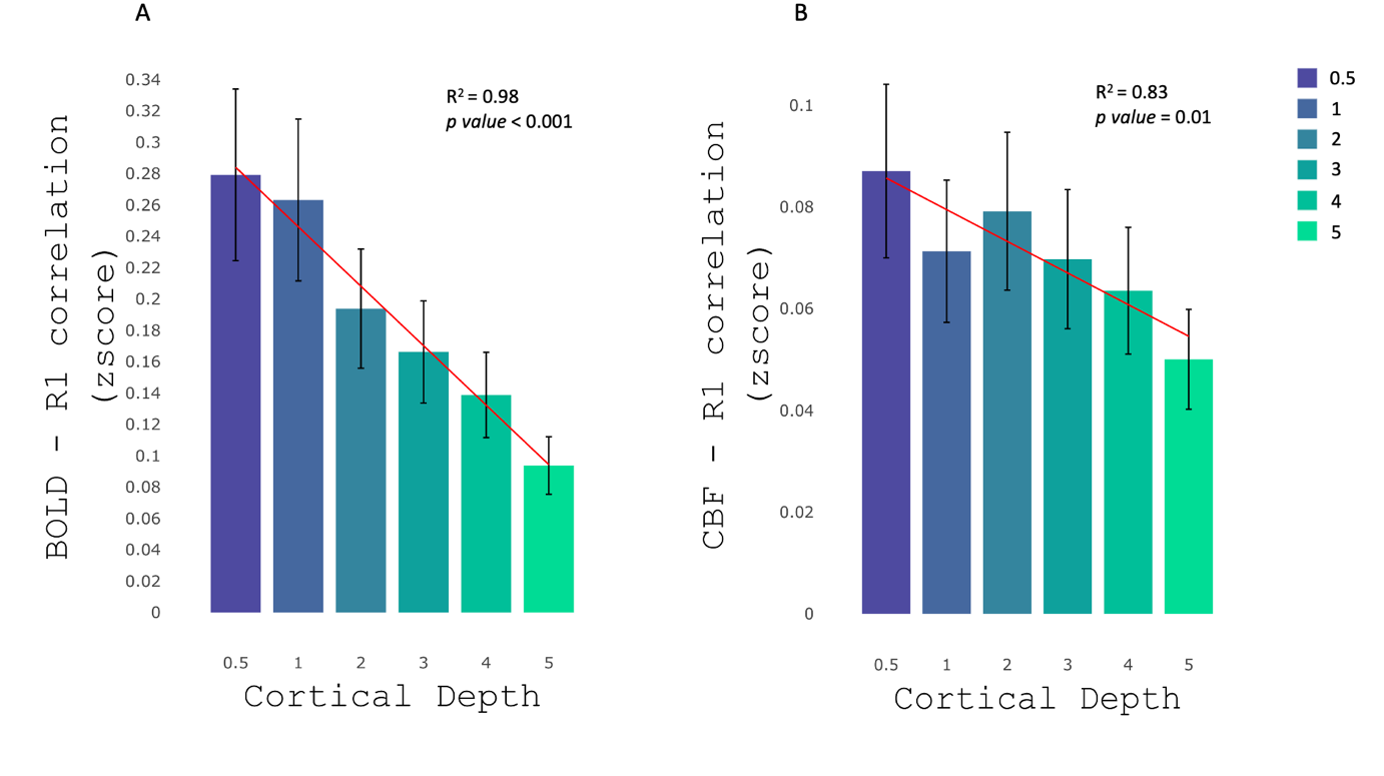
Where significant, we observed largely positive regional correlations between BOLD and CBF task-related activities and R1 values in some of the ROIs, as reported in Fig.2. On the other hand, few ROIs showed a significant negative R1-functional activities correlation (Fig.2). A linear decrease of functional activity-R1 correlation with increase of cortical depth was observed for both BOLD (R2=0.98; p<0.001) and CBF (R2=0.83; p=0.01) (Fig.3). Out of 26ROIs (different for BOLD and CBF) and 6 different cortical depths, only 9 correlations between cortical thickness and R1 values fell below the threshold level of p<0.05. None of these corresponded to the ROIs where we observed a significant R1-functional activities correlation; this suggests that cortical thickness does not drive the R1-functional activity correlations that we observed.Discussion/Conclusion
We demonstrated a largely positive relationship between R1 (as indicator of cortical myelin) and functional activity (BOLD and CBF) during the execution of a motor task in different ROIs, in the areas known to be heavily myelinated. Furthermore, we observed a decrease of this relationship as we go deeper in the brain, potentially due to less vascularization and therefore less neural activity in the deeper layers, leading to the hypothesis that GM myelination may have a role in functional network efficiency.Acknowledgements
The study was funded by the Wellcome Trust UK.References
1. Simons, M., & Nave, K. (2016). Oligodendrocytes : Myelination and Axonal. Cold Spring Harbor Perspectives in Biology, (a020479), 1–16.
2. Tomassy, G. S., Berger, D. R., Chen, H., Kasthuri, N., Hayworth, K. J., Vercelli, A., ... Arlotta, P. (2014). Distinct profiles of myelin distribution along single axons of pyramidal neurons in the neocortex. Science, 344(6181), 319–324.
3. Timmler, S., & Simons, M. (2019). Grey matter myelination. Glia, (January), 2063–2070. https://doi.org/10.1002/glia.23614
4. Shams, Z., Norris, D. G., & Marques, J. P. (2019). A comparison of in vivo MRI based cortical myelin mapping using T1w / T2w and R1 mapping at 3T. PLoS ONE, 1, 1–22.
5. Dick, F., Tierney, A. T., Lutti, A., Josephs, O., Sereno, M. I., & Weiskopf, N. (2012). In Vivo Functional and Myeloarchitectonic Mapping of Human Primary Auditory Areas, 32(46), 16095–16105.
6. Fischl, B., Salat, D. H., Kouwe, J. W. Van Der, Makris, N., Quinn, B. T., & Dale, A. M. (2004). Sequence-independent segmentation of magnetic resonance images. NeuroImage, 23, 69– 84.
7. Geyer, S., Weiss, M., Reimann, K., Lohmann, G., & Turner, R. (2011). Microstructural parcellation of the human cerebral cortex – from Brodmann ’ s post-mortem map to in vivo mapping with high-field magnetic resonance imaging, 5(February), 1–7.
8. Marques, P., & Gruetter, R. (2013). New Developments and Applications of the MP2RAGE Sequence - Focusing the Contrast and High Spatial Resolution R 1 Mapping. PLoS ONE, 8(7).
9. Sereno, M. I., Lutti, A., Weiskopf, N., & Dick, F. (2013). Mapping the Human Cortical Surface by Combining Quantitative T 1 with Retinotopy †. Cerebral Cortex, (September), 2261– 2268.
10. Stüber, C., Morawski, M., Schäfer, A., Labadie, C., Wähnert, M., Leuze, C., ... Turner, R. (2014). Myelin and iron concentration in the human brain : A quantitative study of MRI contrast. NeuroImage, 93, 95–106.
11. Mottershead, J. P., Schmierer, K., Clemence, M., Thornton, J. S., Scaravilli, F., Barker, G. J., ... Miller, D. H. (2003). High field MRI correlates of myelin content and axonal density in multiple sclerosis. Journal of Neurology, 250(11), 1293–1301.
12. Schmierer, K., Scaravilli, F., Altmann, D. R., Barker, G. J., & Miller, D. H. (2004). Magnetization transfer ratio and myelin in postmortem multiple sclerosis brain. Annals of Neurology, 56(3), 407–415.
13. Eickhoff, S., Walters, N. B., Schleicher, A., Kril, J., Egan, G. F., Zilles, K., ... Amunts, K. (2005). High-Resolution MRI Reflects Myeloarchitecture and Cytoarchitecture of Human Cerebral Cortex. Human Brain Mapping, 215(January 2004), 206–215.
14. Walters, N. B., Egan, G. F., Kril, J. J., Kean, M., Waley, P., Jenkinson, M., & Watson, J. D. G. (2003). In vivo identification of human cortical areas using high-resolution MRI: An approach to cerebral structure – function correlation. Pnas, 1(5), 193–196.
15. Mugler III, J. P., & Brookeman, J. R. (1990). Three-Dimensional Magnetization-Prepared Rapid Gradient-Echo Imaging ( 3D MP RAGE ). Magnetic Resonance in Medicine, 157, 152–157
16. Marques, J. P., Kober, T., Krueger, G., & Zwaag, W. Van Der. (2010). MP2RAGE, a self bias-field corrected sequence for improved segmentation and T1-mapping at high field. NeuroImage, 49(2), 1271–1281.
17. Waehnert, M. D., Dinse, J., Weiss, M., Streicher, M. N., Waehnert, P., Geyer, S., ... Bazin, P.L. (2014). Anatomically motivated modeling of cortical laminae. NeuroImage, 93, 210-220.
18. Fields, R. D. (2015). A new mechanism of nervous system plasticity: activity-dependent myelination. Nature Reviews Neuroscience, 16(12), 756–767.
19. Pajevic, S., Basser, P. J., & Fields, R. D. (2014). Role of myelin plasticity in oscillations and synchrony of neuronal activity. Neuroscience, 276, 135–147.
20. Hunt, B. A. E., Tewarie, P. K., Mougin, O. E., Geades, N., Jones, D. K., Singh, K. D., ... Brookes, M. J. (2016). Relationships between cortical myeloarchitecture and electrophysiological networks. Proceedings of the National Academy of Sciences of the United States of America, 113(47), 13510–13515.
Figures