0593
TWo Interleaved Steady-states for T2 And Rf Estimation (TWISTARE) - a fast 3D-GRE phase-based method of T2 and B1 mapping in 7T brain imaging
Dana Yacobi1, Amir Seginer2, and Rita Schmidt1
1Department of Brain Sciences, Weizmann Institute of Science, Rehovot, Israel, 2Siemens Healthcare Ltd, Rosh Ha’ayin, Israel
1Department of Brain Sciences, Weizmann Institute of Science, Rehovot, Israel, 2Siemens Healthcare Ltd, Rosh Ha’ayin, Israel
Synopsis
Quantitative T2 mapping is an important tool towards standardization of MRI in clinics and research, whose implementation in 7T MRI will gain SNR and resolution. In this work, we demonstrate a phase-based method with fast 3D spoiled GRE acquisition to estimate T2 and B1 maps in 7T brain imaging. We introduce a new approach employing a dual steady-state with interleaving flip angles - denoted as TWISTARE. This approach is suited to address the RF field inhomogeneity in 7T and can shorten the total scan duration. The new approach was examined using a 3D head-shaped phantom and in human imaging.
Introduction
Quantitative T2 mapping offers useful tissue characterization for a variety of clinical and basic research, including estimation of iron overload, stroke severity1, cartilage and demyelinating diseases among which is multiple sclerosis2-4. Implementing quantitative T2 mapping at ultra-high field (≥7T) MRI can offer increased sensitivity, however, still poses a great challenge. Common T2 techniques at 7T suffer from high SAR and from high RF field (B1) inhomogeneity, resulting in prolonged scan duration and reduced estimation quality. Recent work5 at 3T has demonstrated that T2 maps can be estimated from phase images of two (modified) 3D spoiled GRE scans with short TR. As a follow-up, we recently presented an estimation method of both T2 and B1– denoted as Steady-state T2 And RF Estimation (STARE)6. This method was based on four scans with two flip angle values and overcomes the 7T RF field inhomogeneity, offering a fast 3D T2 and B1 mapping for 7T brain imaging. In the current study, we propose to shorten the total scan duration by introducing a dual-steady-state with interleaved flip angles, which we denote as TWISTARE. In this approach, we can extract the T2 and RF maps from only two scans.Methods
The method is based on the well-known RF spoiling used with spoiled GRE which can be acquired with short TR (TR of 15 msec in this work). However, instead of a standard phase increment (φinc), that dephases all transverse magnetization, here a small phase increment (e.g., φinc=2°) introduces coherent transverse magnetization and provides a notable T2 contrast in the phase images. Bloch simulations show that the signal’s phase ($$$\angle$$$S) includes B0-dependent phase (θ0) along with a dependence on T2, flip angle (α), and φinc: $$$\angle$$$S=θ(T2,α,φinc)+θ0 . α here is the actual local flip angle, due to the requested αscan and the local B1 distribution. (A small T1 dependency also exists, however, it is negligible in the relevant range). In this study, a dual-steady-state is implemented by interleaving two flip angle values– odd excitations with αscan, even excitations with AR∙αscan (AR-amplitude ratio)– producing odd and even phase maps- $$$\angle$$$Sodd,$$$\angle$$$Seven– see the simplified pulse sequence in Fig.1. Such a dual-steady-state is useful for removing θ0 while keeping T2 and α dependency: ∆θ(T2,α,AR,φinc)=$$$\angle$$$Sodd-$$$\angle$$$Seven=θodd(T2,α,AR,φinc)-θeven(T2,α,AR,φinc). After repeating the scan with another set of (φinc,αscan,AR) two phase-difference maps -∆θ1,∆θ2 - are available and can be exploited for T2 and α estimation. The two sets of scans parameters –φinc1,αscan1,AR1 for scan 1 and φinc2,αscan2,AR2 for scan 2 – define the precision and accuracy of the method. We performed a set of Bloch simulations and an initial SNR analysis to optimize the sensitivity for relevant T2 and α distribution in 7T brain imaging. The current chosen set of parameters was αscan=21°,AR=1.5,φinc=1.5 for scan 1, and αscan=12°,AR=3,φinc=7.5 for scan 2. Using Bloch simulations we introduce a new 2D space (∆θ1,∆θ2) in which for each measured (∆θ1,∆θ2) we can estimate T2(∆θ1,∆θ2) and α(∆θ1,∆θ2) by interpolation. Fig.1 shows the flowchart of the method, while Fig.2 shows representative Bloch simulation results for a single-steady-state and a dual-steady-state phase dependence.Phantom and human imaging was performed on a 7T MAGNETOM Terra (Siemens Healthcare, Erlangen, Germany). The quality of the T2 and α estimation was assessed using a 3D head-shaped phantom7 with a similar-to-human RF field inhomogeneity and a uniform T2 value. Phantom scan parameters were: Sagittal plane, FOV 220x225x256 mm3, resolution 1.3x1.3x2 mm3, TR/TE 15/1.67 ms, single scan duration 5:47 min, total scan duration 11:34 minutes. In-vivo scan parameters were Sagittal plane, FOV 220x225x216 mm3, resolution 1.25x1.25x1.5 mm3, TR/TE 15/1.67 ms, elliptical sampling, single scan duration 5:06 min, total scan duration 10:12 minutes. We used the BART8 software to reconstruct the final images for in-vivo dataset.
Results
Fig.3 shows the simulated equi-T2 and equi-α lines in the (∆θ1,∆θ2) 2D space for the selected TWISTARE set of parameters. Excluding extremely low α values, the equi-T2 and equi-α lines are nearly orthogonal, which allows robust estimation for a given set of (∆θ1,∆θ2). Fig.4 shows the phantom imaging results– with good fit to the vendor RF field map. The T2 map shows uniform distribution inside the “brain” compartment, as expected. Since the T2 distribution in this phantom is uniform, the precision of the method was evaluated by calculating the STD of the T2 estimate over a large centered box (see Fig.4c), resulting in a STD of 2.17 msec. Fig.5 shows volunteer imaging results of both T2 and α maps. The α map is similar to the vendor RF map distribution (with some deviations near the ventricles).Conclusions
The TWISTARE method offers a fast 3D T2 and α mapping in 7T brain imaging. In this study, acceleration was only partially utilized using elliptical acquisition available in 3D-GRE and hence, additional acceleration can be easily incorporated to further shorten scan duration. The method fits the expected results and shows good precision in phantom imaging. Detailed examination of practical precision, accuracy and replicability with optimized set of parameters is required. Further study is required to compare the estimated T2 maps to the gold standard spin-echo method.Acknowledgements
No acknowledgement found.References
[1] Siemonsen S, Mouridsen K, Holst B, et al. Stroke. 2009; [2] Bruschi, N., Boffa, G. & Inglese, M. Eur Radio. 2020; [3] Henry, T. R. et al. Radiology 2011; [4] Massire, A. et al. Magn. Reson. Med. 2015; [5] Wang X. et.al. MRM 2019; [6] Schmidt R. et.al. Proc. Intl. Soc. Mag. Reson. Med. 29 (2021), 0551; [7] Jona et.al. NMR BioMed 2020; [8] https://mrirecon.github.io/bartFigures
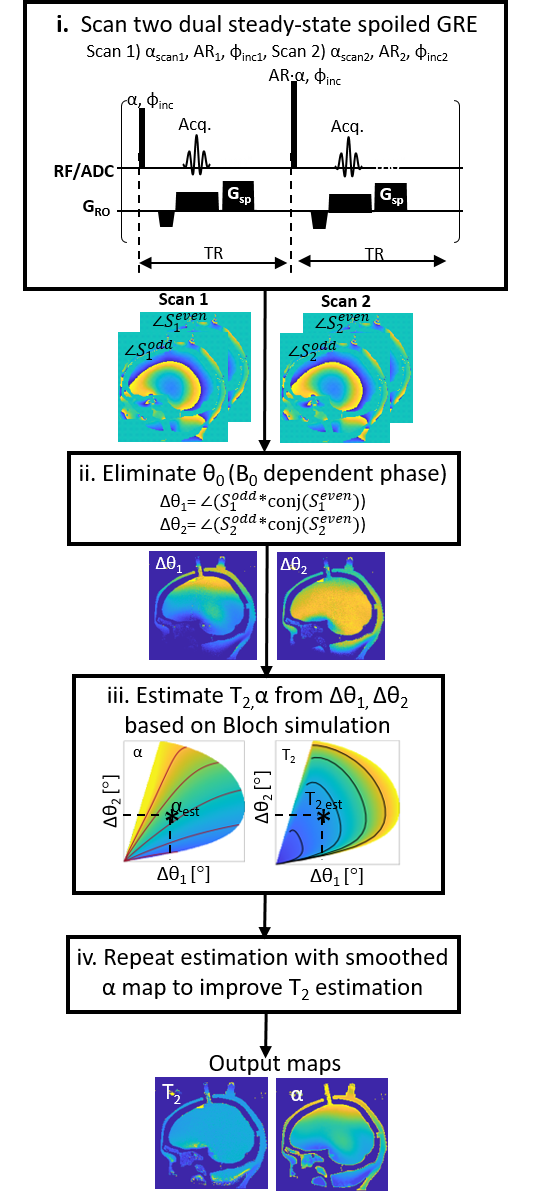
Figure 1: Schematics of the
proposed method. Using dual-steady state spoiled GRE, two phase
measurements ($$$\angle$$$Sodd, $$$\angle$$$Seven) are extracted from each scan. By
subtracting the measured phases, B0 contribution is cancelled
out (Δθ1, Δθ2).
The observed values (Δθ1, Δθ2) can then be mapped to
a corresponding T2 and α based on pre-prepared Bloch simulations dictionary.
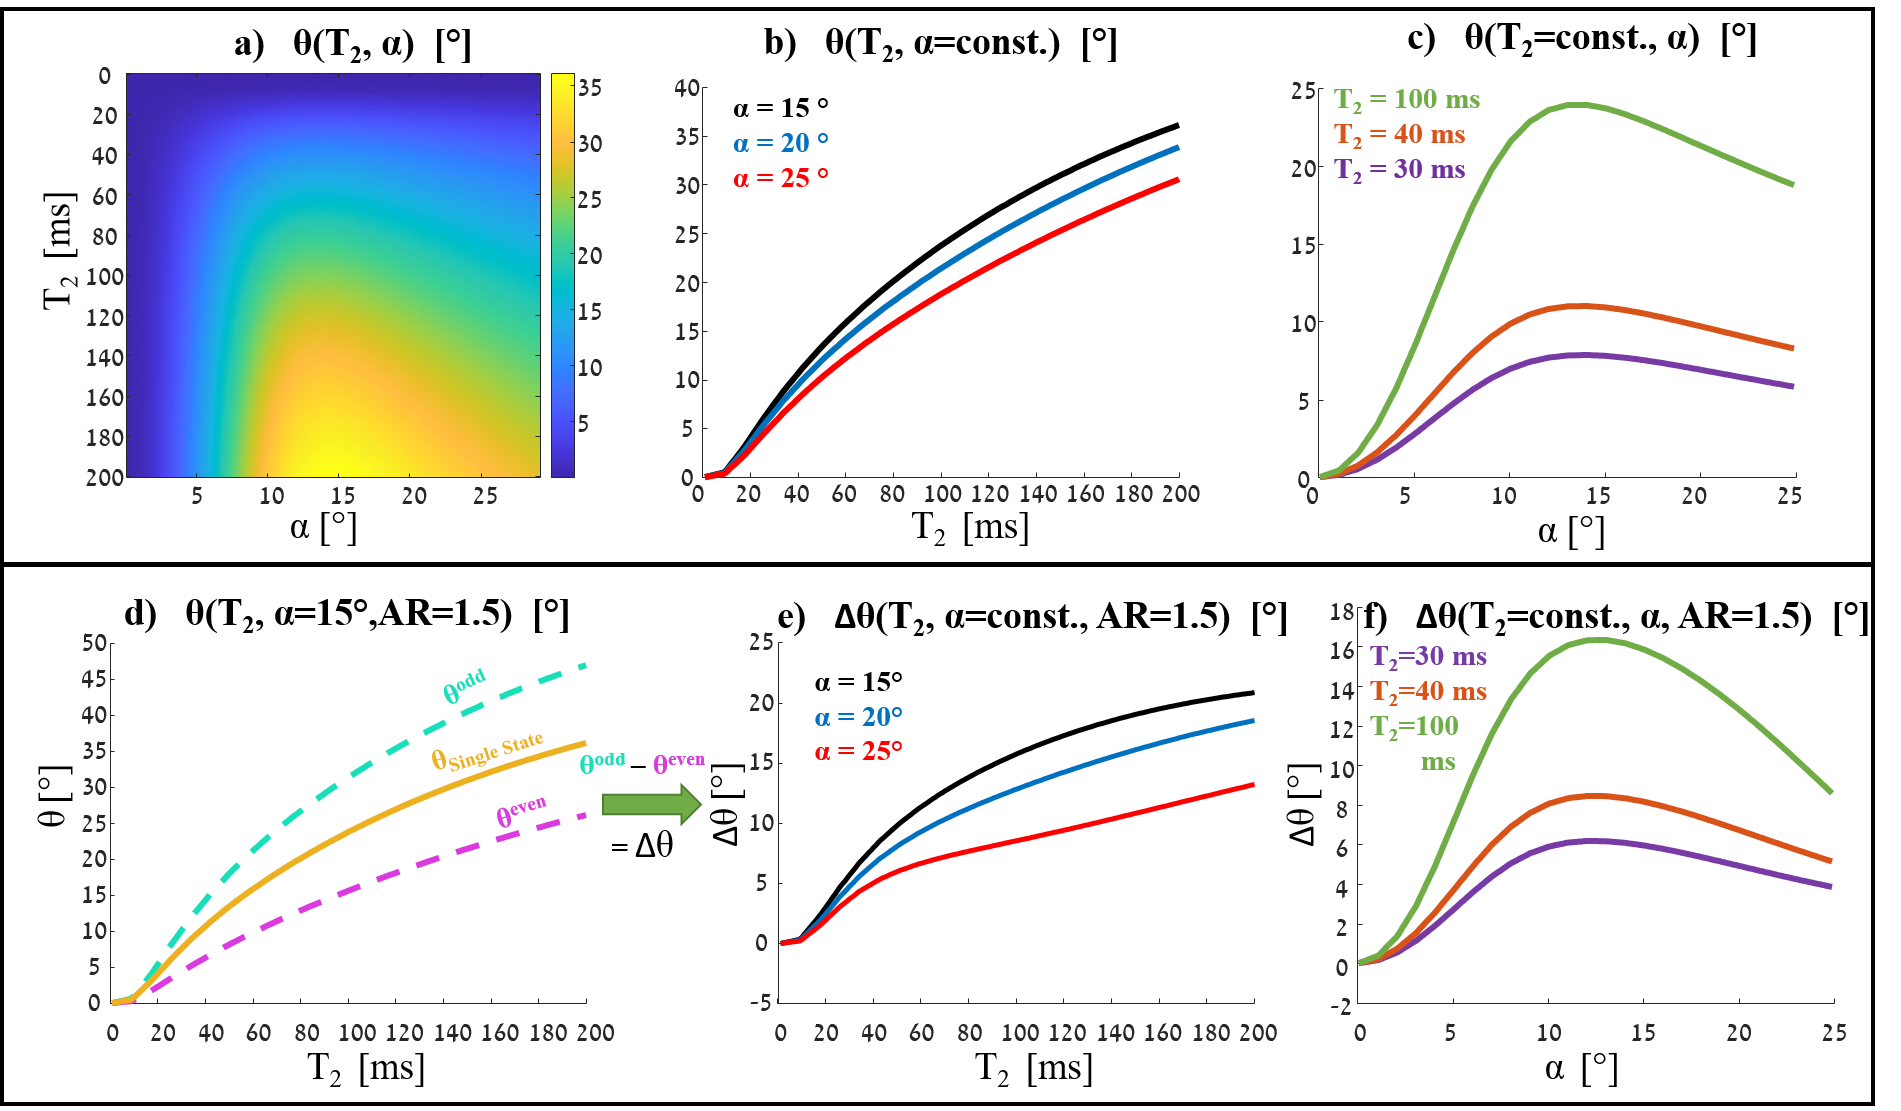
Figure 2: Simulated signal phase in single and dual steady-states (for φinc=1.5°, no B0 contribution in this simulation). (a-c) single-steady-state: a) 2D θ(T2, α) map b) θ(T2, α=const.) for α =15°, 20° and 25° c) θ(T2=const., α), for T2=30, 40 and 100 ms. (d-f) dual-steady-state: d) two states’ phase - θodd(T2), θeven(T2) for α =15°, AR=1.5 compared to θ of a single state, e) phase difference between states (∆θ) as a function of T2 - ∆θ(T2, α=const., AR=1.5), for α =15°, 20° and 25° f) phase difference between states (∆θ) as a function of α - ∆θ(T2=const., α, AR=1.5), for T2 =30, 40 and 100 ms.
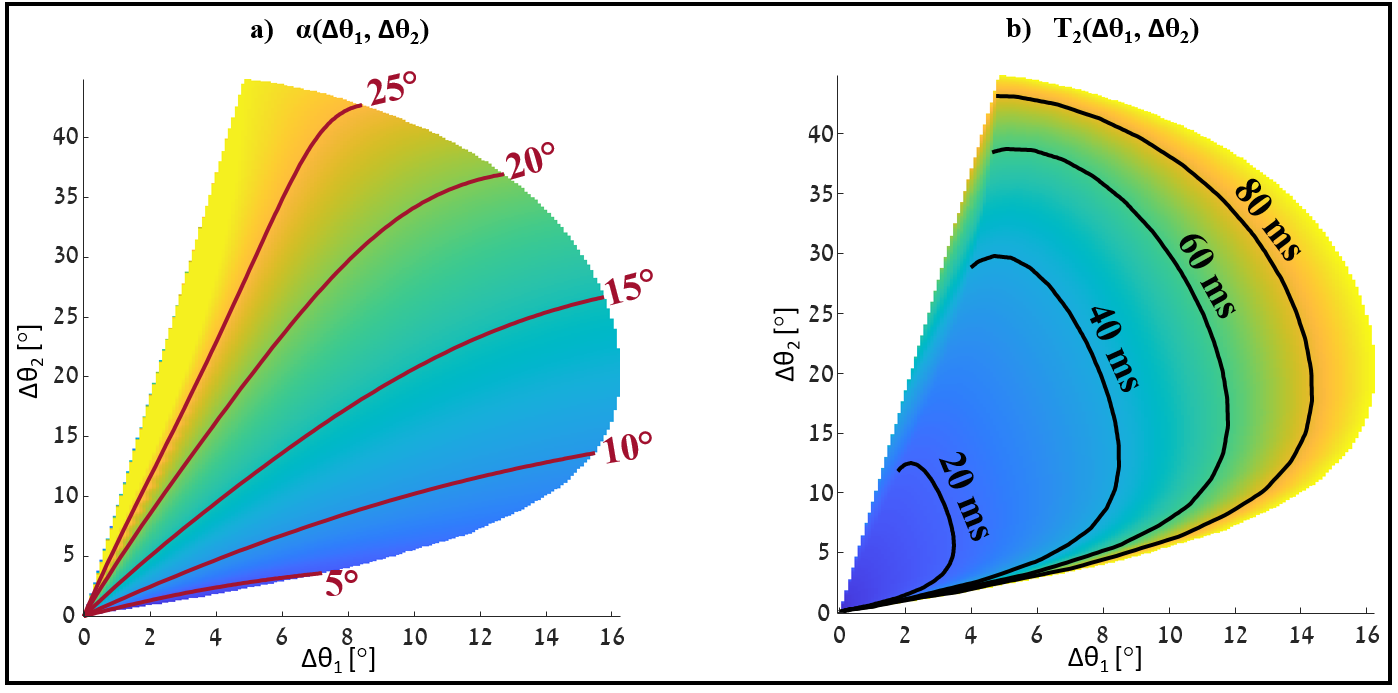
Figure 3: α (a) and
T2 (b) distributions in a 2D space of (∆θ1, ∆θ2).
a) Equi-α lines and their corresponding
values are indicated in red b) Equi- T2 lines and their
corresponding values are indicated in black.
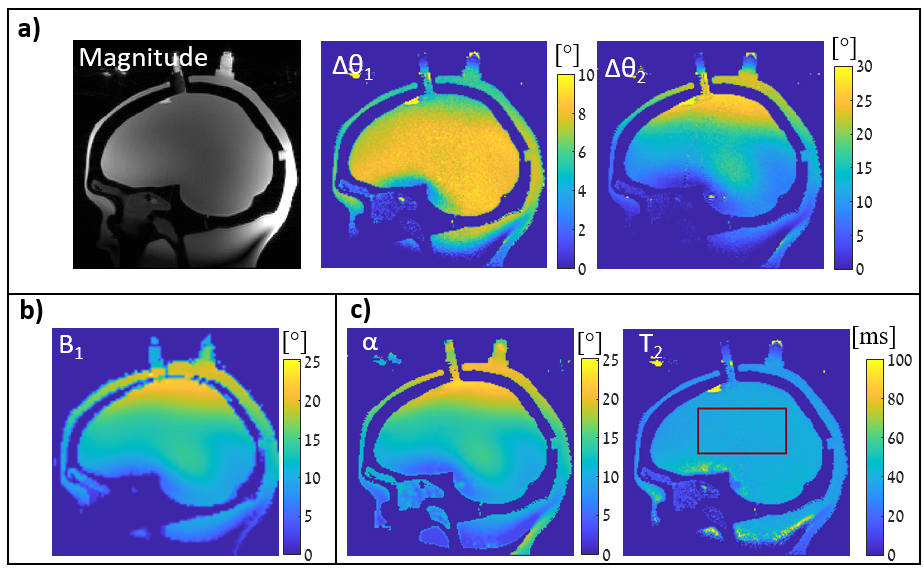
Figure 4: Head-shaped phantom 3D imaging
(“brain” compartment has uniform T2). a) Measured |Sodd|, ∆θ1 and ∆θ2,
b) Vendor B1 map normalized to corresponding flip angle, c) estimated
α and T2 maps. STD of T2
inside the red overlay is 2.17 ms. Scan resolution 1.3x1.3x2 mm3,
Total scan duration 11:34 min.
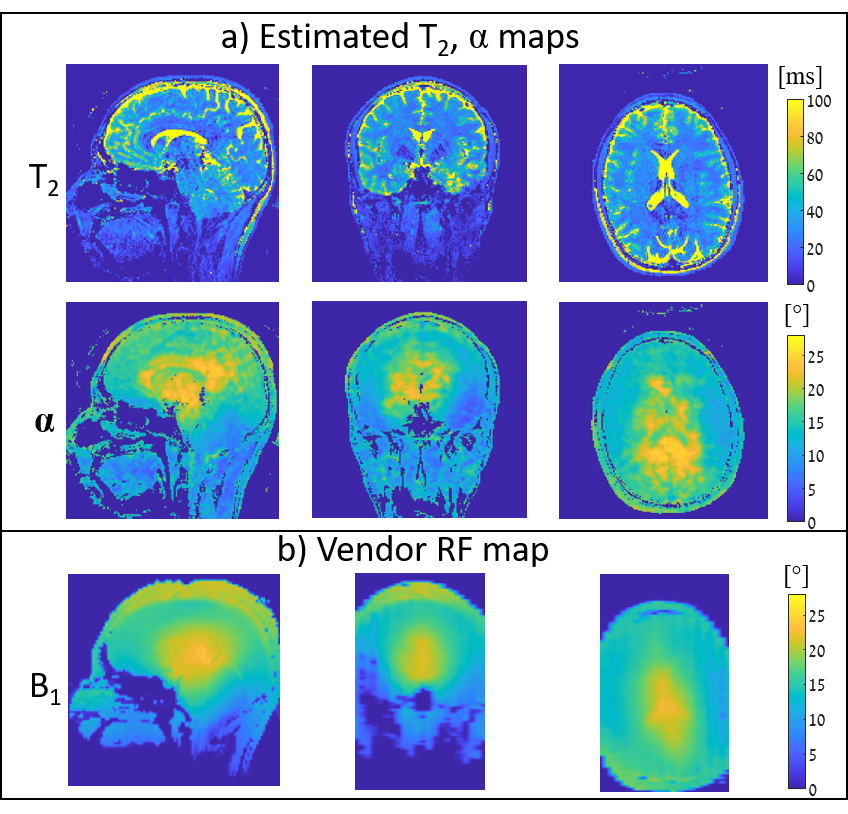
Figure 5: Human volunteer 3D imaging
–three main cross sections are shown. From
top to bottom – estimated T2 and α maps; and the vendor
B1 map (normalized to corresponding flip angle). Scan resolution 1.25x1.25x1.5
mm3, total scan duration 10:12 min.
DOI: https://doi.org/10.58530/2022/0593