0592
Ultra-high field motion-corrected MRI can visualize the mesoscale organization of the human cerebellum.1Spinoza Center for Neuroimaging, Amsterdam, Netherlands, 2Philips Healthcare, Copenhagen, Denmark, 3Lund University Bioimaging Center, Lund University, Lund, Sweden, 4Danish Research Centre for Magnetic Resonance, Centre for Functional and Diagnostic Imaging and Research, Copenhagen University Hospital Amager and Hvidovre, Copenhagen, Denmark
Synopsis
The cerebellum is an important but challenging to image part of the human brain, due to its thin and highly-folded cortex. Here we demonstrate that using motion-corrected high-resolution 7T-MRI data, we can derive segmentations and surfaces of the cerebellar cortex with unprecedented accuracy in vivo. We expect this technique to greatly facilitate cognitive and clinical neuroscience research in the cerebellum.
Introduction
The human cerebellum is a neuronally-dense area of the brain that is fundamental in human cognition and clinical neuroscience, from motor control to executive functions. Compared to the neocortex, however, the cerebellum is largely understudied, since its thin (0.4-1mm) and highly-foliated cortex is hard to image in-vivo, due to insufficient SNR and a comparative increase of participant-motion importance at high-resolution1. As a result, several techniques developed for the neocortex, like white-matter (WM) and gray-matter (GM) segmentations and surface reconstructions and projections, are not readily applicable in the cerebellum or their accuracy does not extend beyond large anatomical features, such as the largest lobules1, 2. This hinders in-vivo neuroscientific and clinical research in the cerebellum.In recent years, SNR and SNR-efficiency gains were made through higher B0 and multi-receive coil-arrays, thus facilitating increased spatial resolution3. Motion-correction techniques have also been developed to preserve this resolution gain in the presence of participant motion4.
In this study, we employed a high-resolution T1-mapping technique at 7T interleaved with a fat-navigator-based prospective-motion-correction scheme to image the human cerebellum, segment its structures and reconstruct its surface in unprecedented detail in-vivo.
Methods
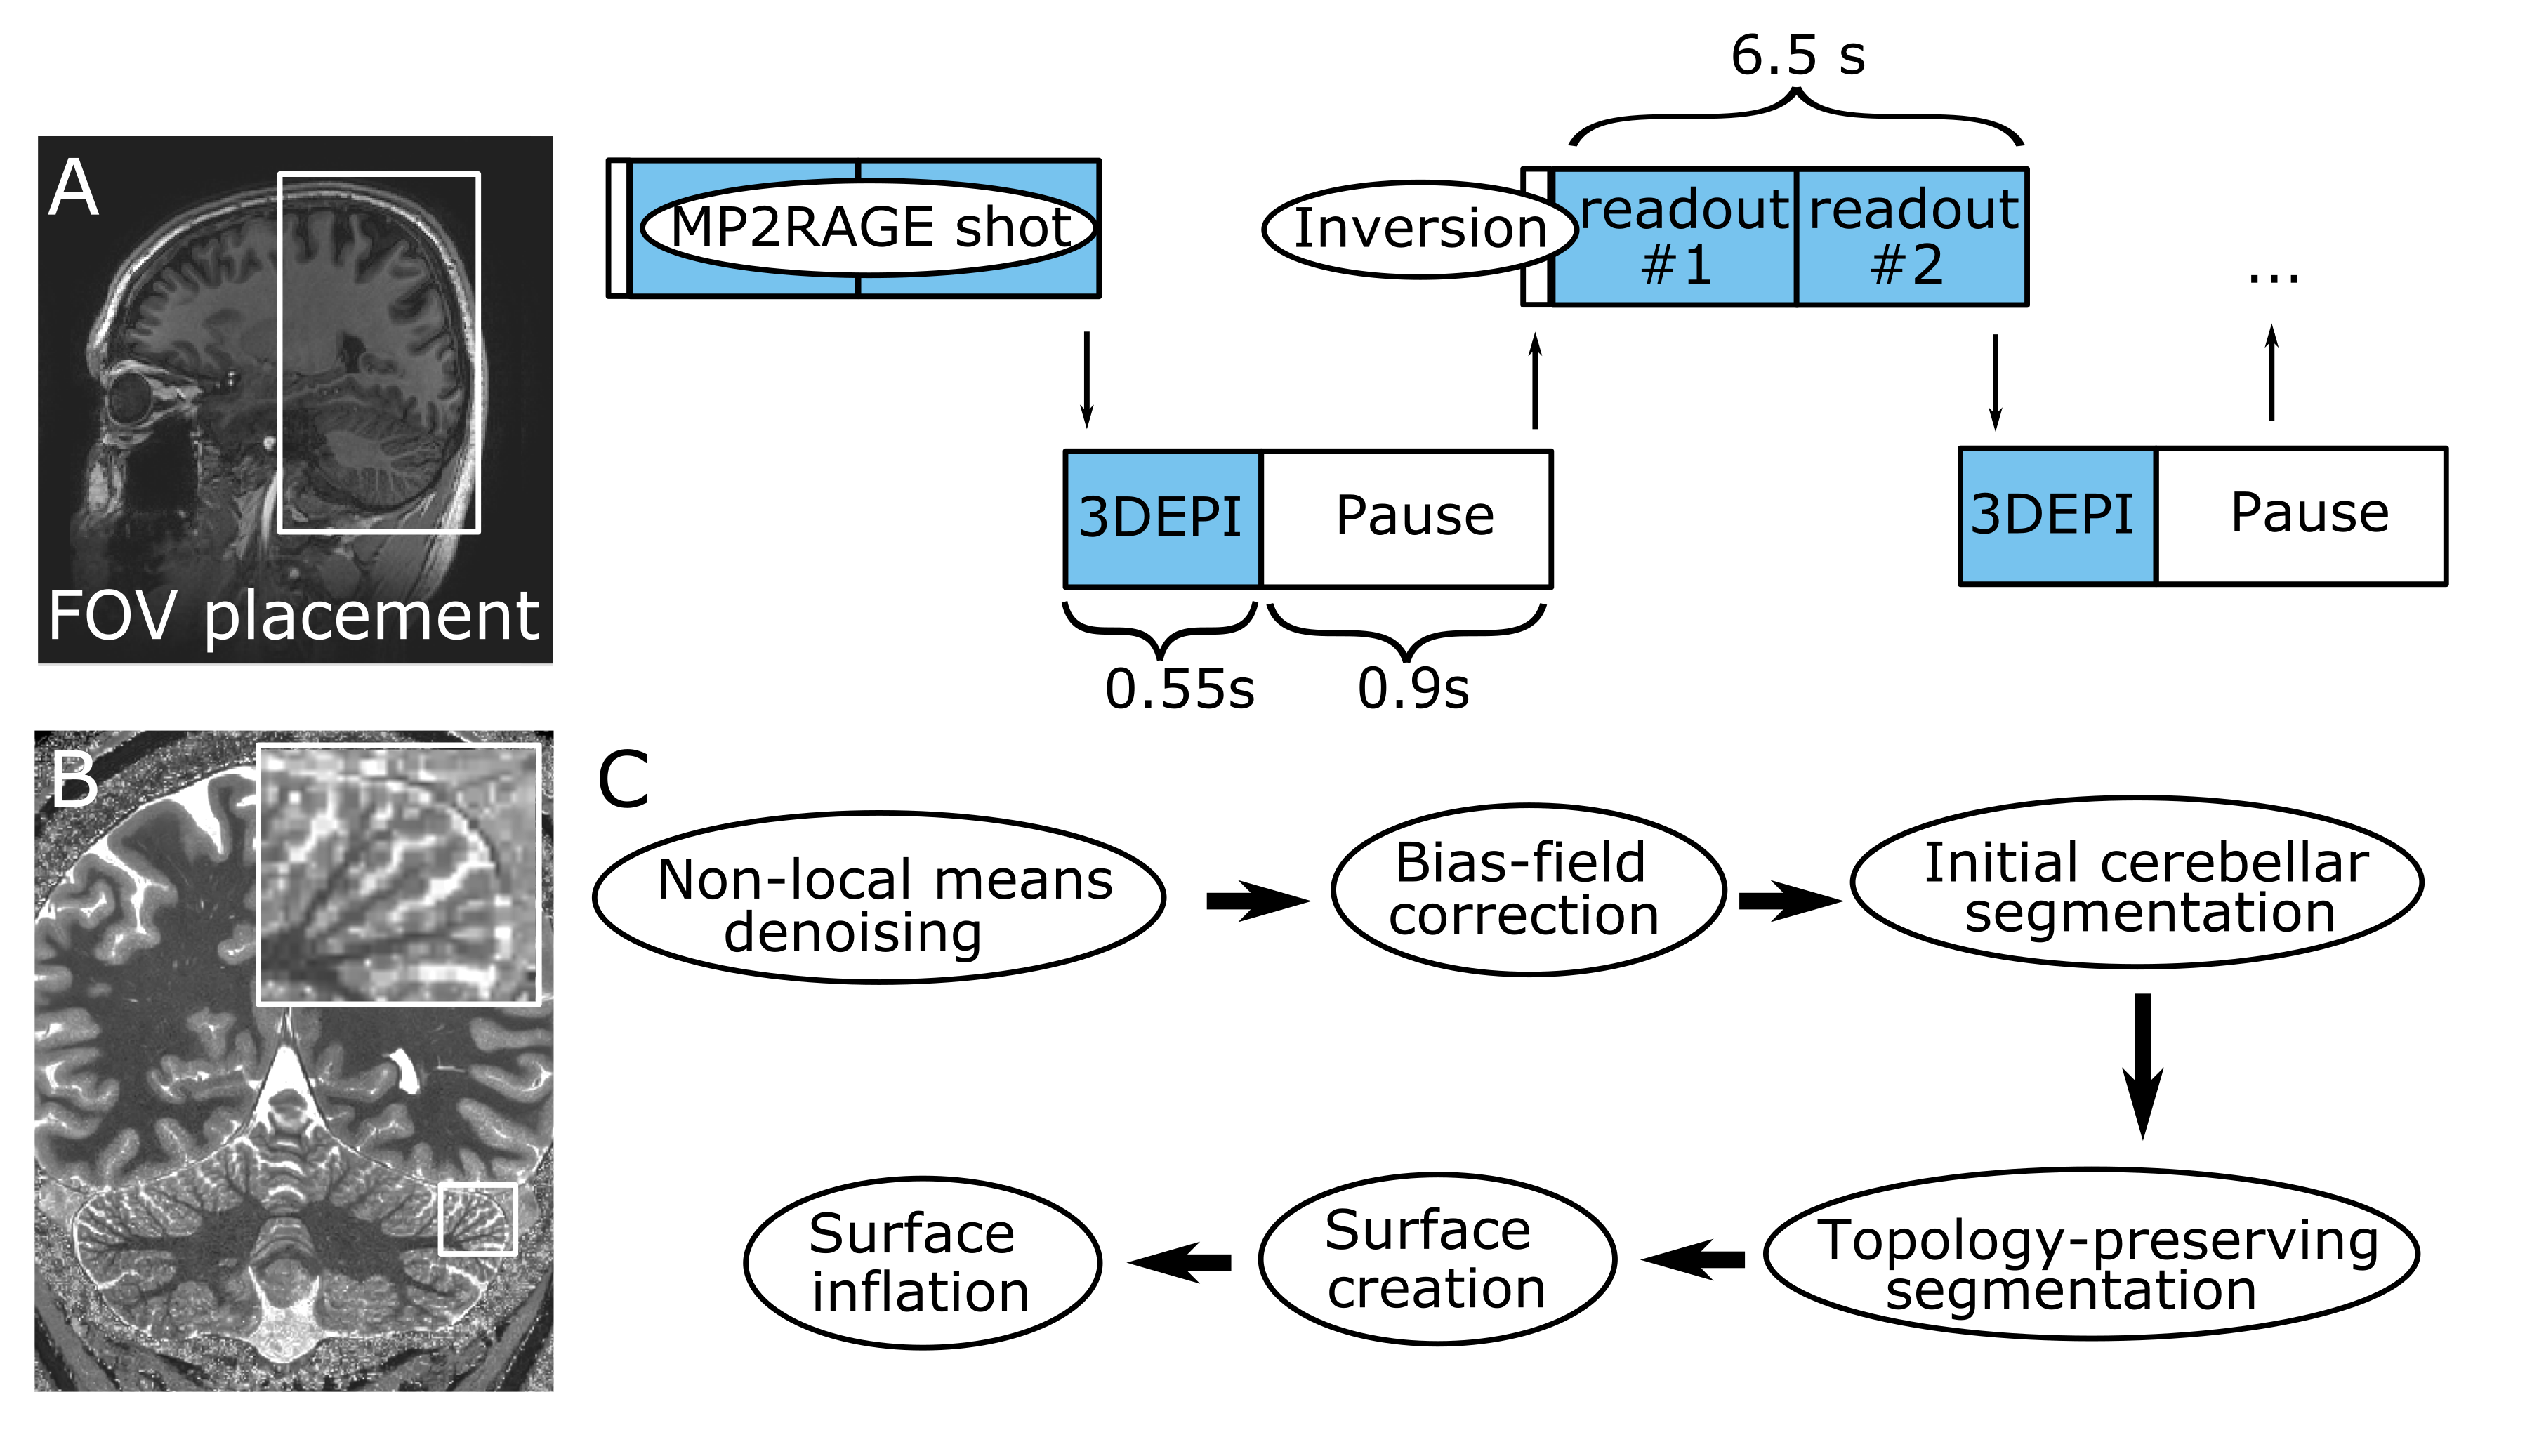
Six healthy volunteers were scanned in a Philips Achieva 7T with a 2Tx/32Rx whole-head coil (Nova-Medical). An MP2RAGE (FOV=210x120x60mm3, TE/TR=3.1/7ms, TI1/TI2/TRshot=1000/2900/6500ms, flip-angle=7/5o, nominal voxel-size=0.4mm isotropic, SENSEy/z=1.5/1, TAMP2RAGE=14.5min) was interleaved with fat-navigators (3D-EPIs with a fat-selective excitation pulse; FOV=240x240x160mm3, voxel-size=2mm isotropic, TE/TR/TAvolume=1.88/5.65/550ms, flip-angle=1o, SENSEy/z=4/2). A prospective-motion-correction algorithm realigned the fat navigators in real time and updated the FOV (wait time=0.9s, TAnavigator=4min, TAtotal=18.5min; Fig.1)4. For three participants, an additional motion-corrected turbo-FLASH was recorded (FOV=15x210x210mm3, TE/TR=20/37.12ms, flip-angle=13o, voxel-size=0.2x0.2x1mm3, SENSEy/z=1.5/1, TFL-shot=2s, TATFL=8min, TAtotal=14min) to visualize with higher in-plane resolution part of the cerebellar cortex.The T1-weighted image derived from the MP2RAGE was intensity-bias and noise-corrected (ANTs5). Downsampled images were created (0.75 and 1mm), to compare with the current standard resolutions at 7T and 3T. WM, GM and cerebrospinal fluid were segmented in a topology-preserving manner (Segmentator6; Nighres7. The output was densely-tesselated to a surface at mid-GM (~4.6M vertices; ~25 times the FreeSurfer neocortex reconstruction).
Results
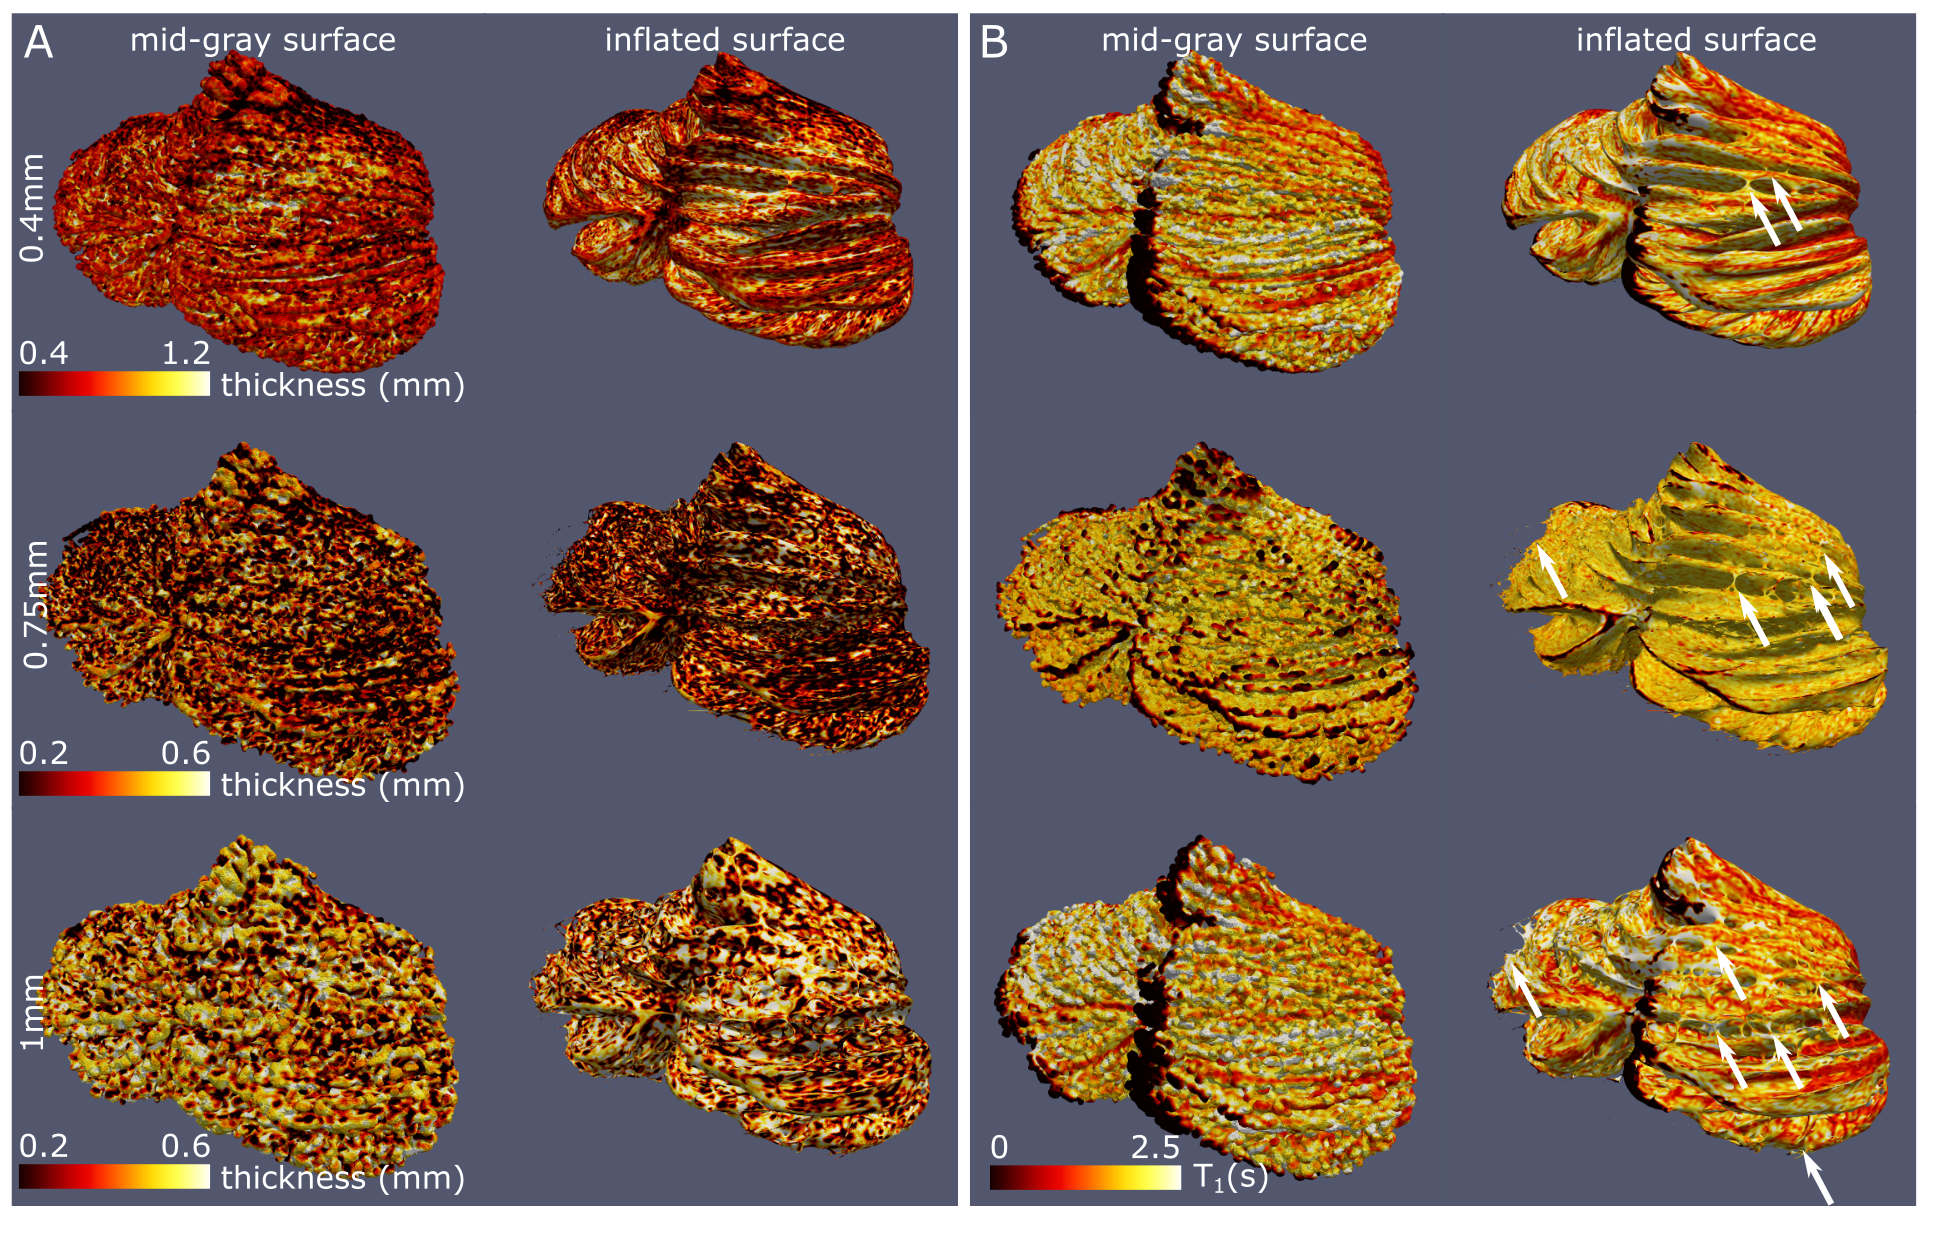
The whole-cerebellum T1-maps showed high contrast and good overall signal quality. At a nominal 0.4mm isotropic voxel-size, several individual folia could be resolved (Fig.2A; comparison with the partial-FOV, higher-resolution T2*-weighted scan). This was reflected in the WM and GM segmentations, where individual-folia detail was achieved for the 0.4mm acquisition (but not in the downsampled data; Figure 2B-C and D-J).The surfaces derived from the high-density tesselation resolved the characteristic transverse fissures of the cerebellum. These fissures were much reduced in the reconstructions from the downsampled data. At the original resolution, additional anatomical details of the cerebellar cortex, such as splitting fissures (Fig.3D,G; red arrows) and angulated lobular fissures could be observed (Fig.3D,G; green arrows). The mid-GM was successfully inflated, though not beyond the lobular level due to large geometric distortions and/or remaning bridges between folia. The projection of cerebellar cortical thickness estimates showed lower estimates and less homogeneous results when the downsampled data were used (Fig.4).
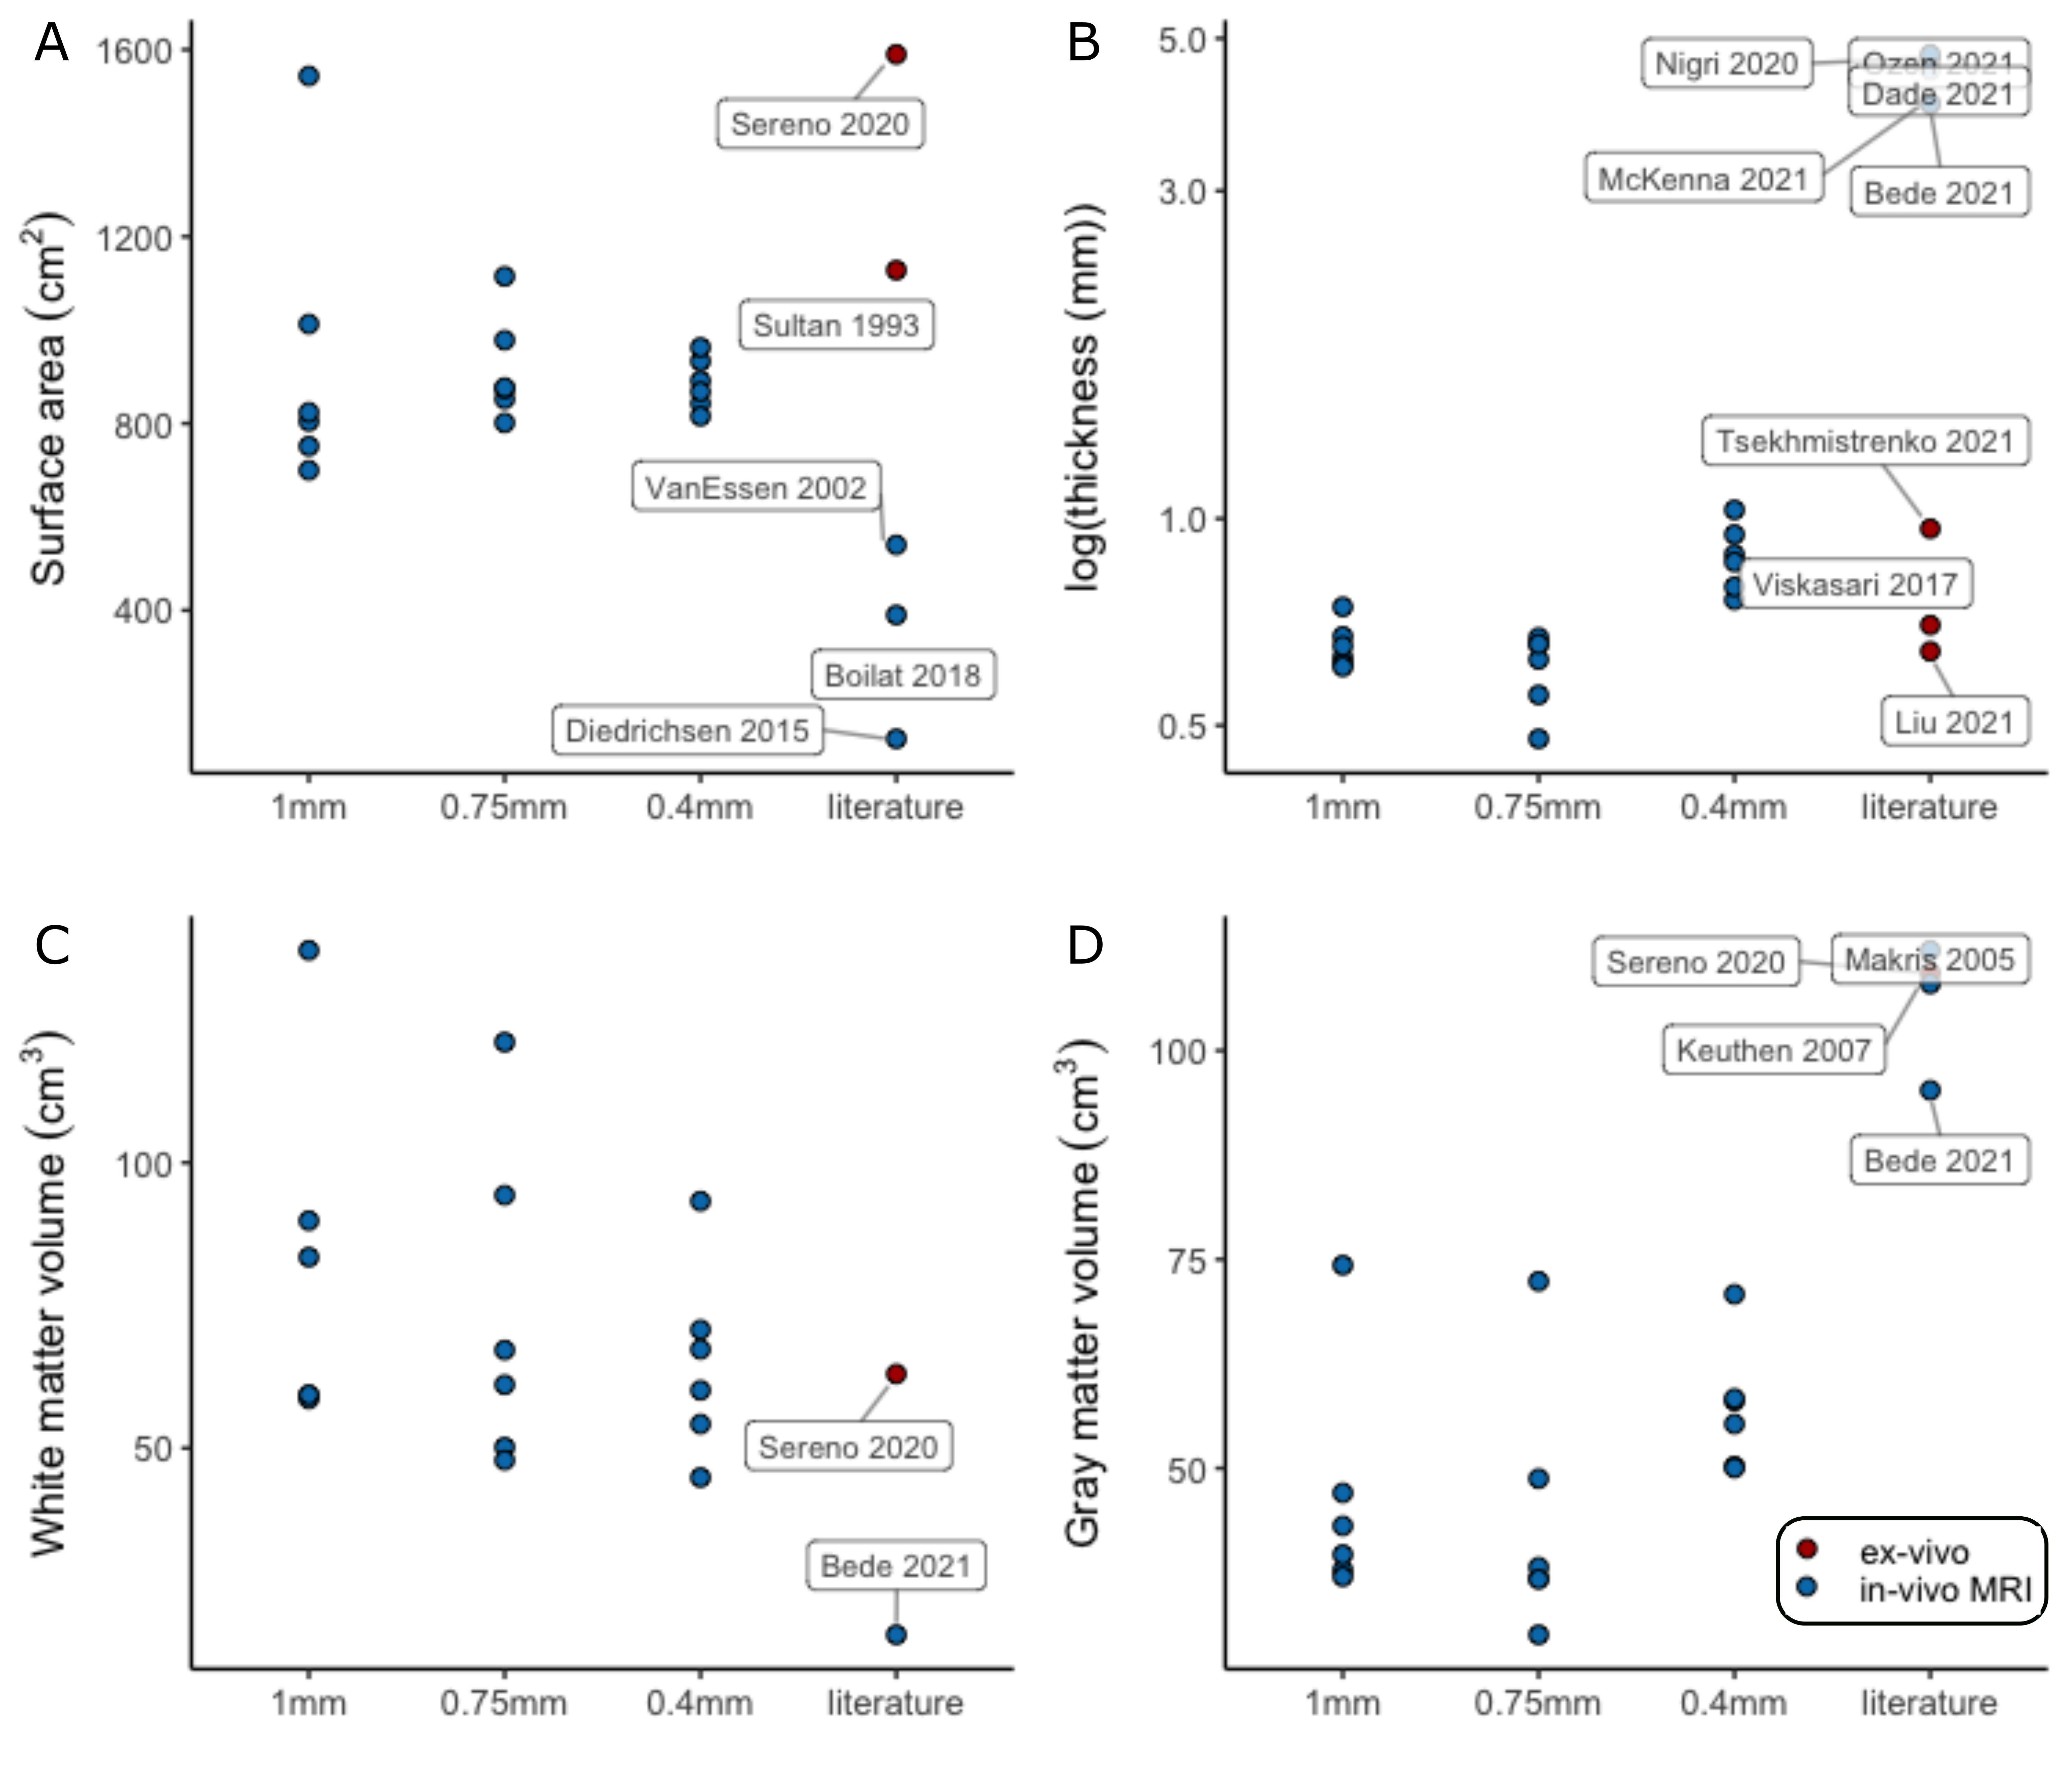
The median cerebellar cortical surface area was estimated at 880cm2 (IQR=849-923), approximately at 56%1 and 79%8 of the two previous ex-vivo estimates, but 63%-703% larger than previous in-vivo approaches. Similarly, the median cerebellar cortical thickness was estimated at 0.88mm (IQR=0.81-0.93, in agreement with anatomical reports9,10 and 4-5 times smaller than typical in-vivo estimates. The median cerebellar WM and GM volume were estimated at 64cm3 (IQR=56-70) and 57cm3 (IQR=52-58) respectively, implying a likely underestimation of total GM volume, due to unresolved folia. The estimates extracted from the downsampled data largely showed increased within-group variability(Fig.5).
Discussion
The convoluted nature of the cerebellar cortex prohibits its accurate segmentation and surface reconstruction in typical MRI data. Here we employed a motion-corrected technique at 7T to image the human cerebellar cortex in-vivo at high-resolution and in a clinically-acceptable acquisition time. This allowed WM and GM segmentations that could resolve several (though not all) individual folia and the subsequent high-fidelity reconstruction of the cerebellar cortical surface, and its inflated projection at lobular level.The cerebellar surface has not been previously reconstructed accurately in-vivo. Estimates of its surface have been derived through dissection8 and, recently, through ultra-high-resolution ex-vivo MRI1. Our own estimates of the cerebellar cortical surface area and thickness were much closer to these ex-vivo reference studies than previous in-vivo approaches. The derivation of segmentations and surfaces from artificially downsampled data showed that the initial 0.4mm resolution is a necessary condition to retain the known anatomical features of the cerebellar cortex.
The construction of accurate surface models of the neocortex has been transformative for in-vivo cognitive and clinical neuroscience, with applications such as quantitative and functional MRI visualization and group analysis, cortical measures extraction, laminar fMRI and EEG/MEG source localization11. Here we show that, by modifying a commonly-used T1-mapping approach, we can construct detailed segmentations and surface models of the cerebellar cortex, an area of high neuroscientific interest that has approximately 80% of the neocortex surface area in a very compact volume12. We expect this technique to greatly facilitate cognitive and clinical neuroscience research in the cerebellum.
Acknowledgements
This study was supported by an NWO TTW VIDI grant (VI.Vidi.198.016)References
1. Sereno, M.I., et al., The human cerebellum has almost 80% of the surface area of the neocortex. Proceedings of the National Academy of Sciences, 2020: p. 202002896.
2. Boillat, Y., et al., Surface-based characteristics of the cerebellar cortex visualized with ultra-high field MRI. Neuroimage, 2018. 172: p. 1-8.
3. de Zwart, J.A., et al., Design of a SENSE-optimized high-sensitivity MRI receive coil for brain imaging. Magn Reson Med, 2002. 47(6): p. 1218-27.
4. Andersen, M., et al., Improvement in diagnostic quality of structural and angiographic MRI of the brain using motion correction with interleaved, volumetric navigators. PLoS One, 2019. 14(5): p. e0217145.
5. Tustison, N.J., et al., N4ITK: improved N3 bias correction. IEEE Trans Med Imaging, 2010. 29(6): p. 1310-20.6. Gulban, O.F., et al., A scalable method to improve gray matter segmentation at ultra high field MRI. PLoS One, 2018. 13(6): p. e0198335.
7. Huntenburg, J.M., C.J. Steele, and P.L. Bazin, Nighres: processing tools for high-resolution neuroimaging. Gigascience, 2018. 7(7).
8. Sultan, F. and V. Braitenberg, Shapes and sizes of different mammalian cerebella. A study in quantitative comparative neuroanatomy. J Hirnforsch, 1993. 34(1): p. 79-92.
9. Kalanjati Viskasari, D.A., Santoso Wirono, Quantitative Study on Human Cerebellar Cortex from Anatomy Cadaver Preparations. International Journal of Mortphology, 2017. 35(1): p. 167-171.
10. Liu, C.J., et al., Quantification of volumetric morphometry and optical property in the cortex of human cerebellum at micrometer resolution. Neuroimage, 2021. 244: p. 118627.
11. Fischl, B., FreeSurfer. Neuroimage, 2012. 62(2): p. 774-81.
12. Barton, R.A. and C. Venditti, Rapid Evolution of the Cerebellum in Humans and Other Great Apes. Curr Biol, 2017. 27(8): p. 1249-1250.
Figures