0591
Imaging Neuronal Activity at Fast Timescales in Humans using MR Elastography1Radiology, Brigham & Women's Hospital, Boston, MA, United States, 2Harvard Medical School, Boston, MA, United States, 3Athinoula A. Martinos Center for Biomedical Imaging, Charlestown, MA, United States, 4Radiology, Massachusetts General Hospital, Boston, MA, United States, 5Neurosurgery, Brigham & Women's Hospital, Boston, MA, United States, 6Laboratory for Vascular Translational Science (LVTS), Institut National de la Santé et de la Recherche Médicale (INSERM), Paris, France
Synopsis
A stimulus-interleaved magnetic resonance elastography (MRE) sequence was utilized to demonstrate fast functionally mediated localized changes in shear wavelength during a motor task. Four healthy adult subjects underwent a visual-cue mediated right-hand finger-tapping task, switching between tapping and no-tapping blocks every 2 seconds. Areas of greatest significance between the stimulus states were localized to the left primary motor cortex. A decreased stiffness of ~30% was observed during task performance compared to rest. Compared to traditional BOLD fMRI with a 20-second block, functional MRE areas of greatest statistical difference demonstrated greater percentage change and greater spatial localization.
INTRODUCTION
Recent studies have demonstrated functional magnetic resonance elastography (fMRE) as a novel approach to map neural responses to functional stimulation1,2. Previous work in anesthetized mice demonstrated 10% changes in the shear modulus with decreased stiffness during the “on” state with stimulus block times as fast as 100ms1. Human studies using visual stimulation much longer than the hemodynamic response function (HRF) showed 6-11% increases in stiffness during visual presentation (“on” state)2, the opposite sign change of stiffness compared to fast time scales in mice. We hypothesize that at least two different physiologic mechanisms affect viscoelastic properties, and operate at two different time scales. To determine/confirm that the fast biomechanical response stiffness change in humans is similar in sign to the mouse model, we present initial results of a motor task with a 2-second stimulus switching time.METHODS
Procedure:We utilized a custom-made rotating eccentric mass transducer3 coupled to the subject’s head to induce 50 Hz mechanical waves. We modified a multi-slice Ristretto MRE sequence4,5 in a Siemens 3T PRISMA scanner allowing for interleaved acquisition of two stimulus states. Sequence details include: FLASH readout, FA = 25 degrees, TE = 9.84ms, TR = 125ms, MEG amplitude of 37mT/m, 9 slices, 8 wave-phases, GRAPPA factor = 2, 4 Hadamard6 MEG encoding directions, acquisition matrix 128 x 128 to achieve an isotropic spatial resolution of 1.5 mm. The slices were centered around the central sulcus. The subject performed a right-hand finger tapping task switching between tapping (on) and no-tapping (off) every 2 seconds with visual cue guidance. Four scans, each with acquisition time of 8:57, were acquired and averaged. Displacement modulated MR phase data for the 4-run average were pixel-wise Fourier transformed and the 50Hz spectral component was used to compose the complex displacement vector U. Each component of U was 3D Gaussian filtered (sigma = 1px, support = 3x3x3 pixels) prior to the calculation of q = curl U. Finally, the 3D Helmholtz wave-equation for q was solved for an isotropic wavelength via minimum χ2. Final maps of the wavelength were spike-filtered and smoothed using a Blackman-Harris filter and generated for each paradigm, with paradigm 1 and 2 representing the “on” and “off” states, respectively. A 3D T1 MPRAGE image was acquired for anatomical reference. An EPI BOLD fMRI scan was obtained with the identical task with a blocked design of a 20-second duration of both task and test blocks (total 5:20).
Data Analysis:
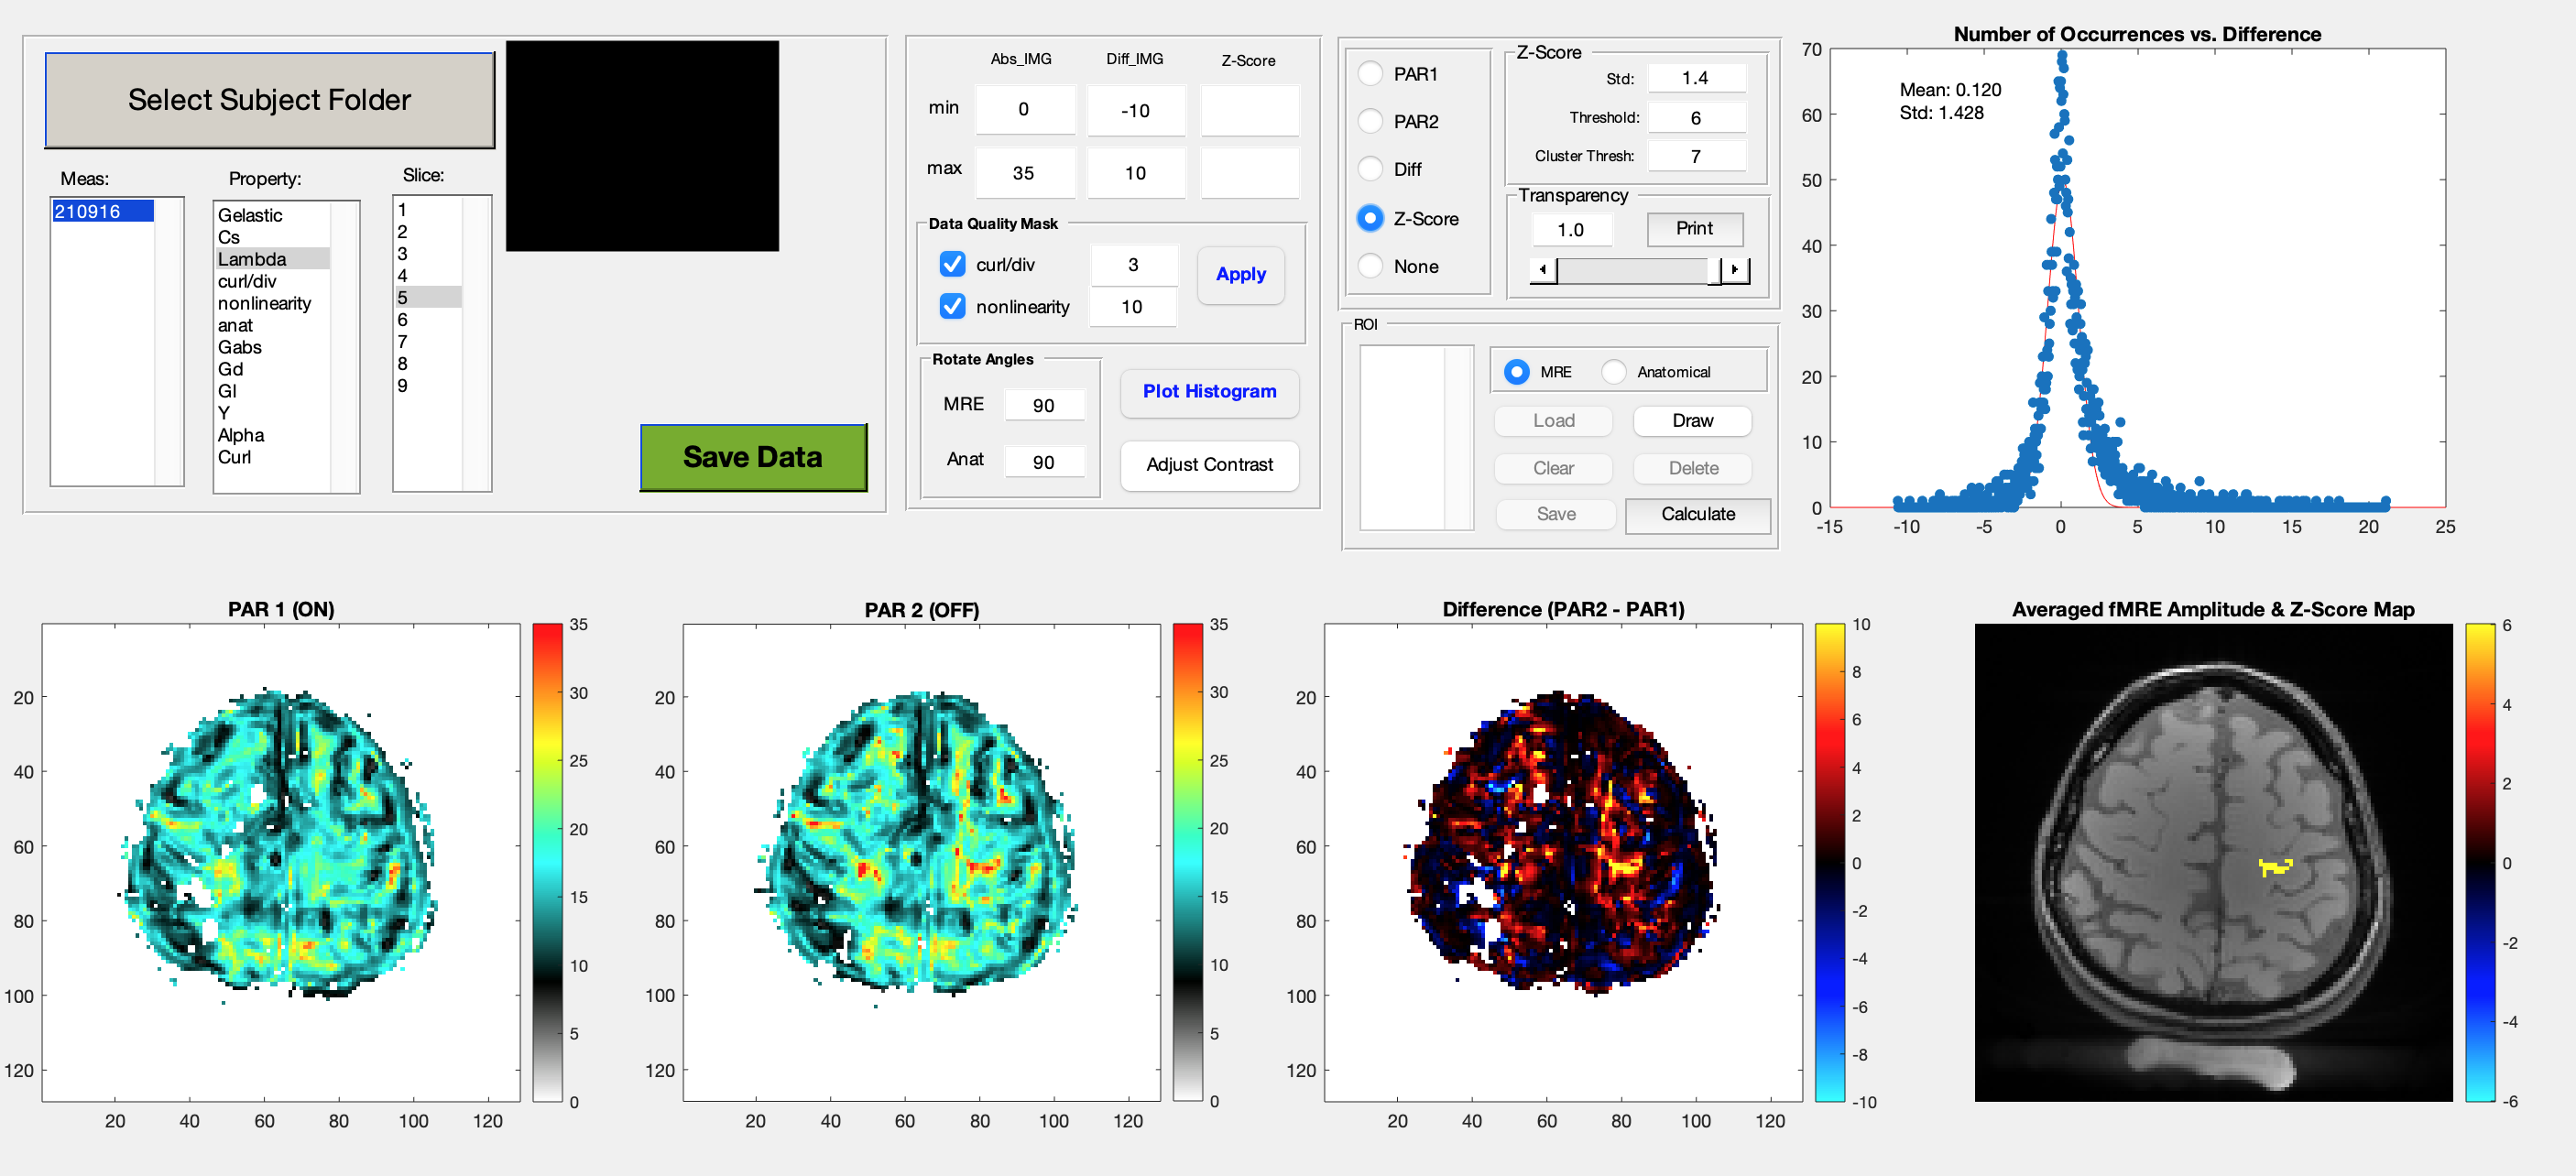
Custom software was created in Matlab for fMRE analysis. Figure 1 shows this analysis tool. The bottom row, left to right, shows wavelength maps for each paradigm (PAR), their difference, and on the far right, voxels with a statistically significant z-score. Filters for curl/divergence ratio>3 and nonlinearity<10 were used to ensure only high-quality voxels were included. A histogram of the wavelength difference maps from the high-quality voxels is shown top right. A Gaussian fit to the histogram provides a standard deviation used to compute z-scores for each voxel difference. The bottom right panel depicts “activated” voxels meeting a user entered z-score and cluster thresholds. fMRI data was analyzed using a general linear model to derive statistical t-maps. Minimum t-score threshold of activated voxels was computed based on uncorrected p-value < 0.00017.
RESULTS
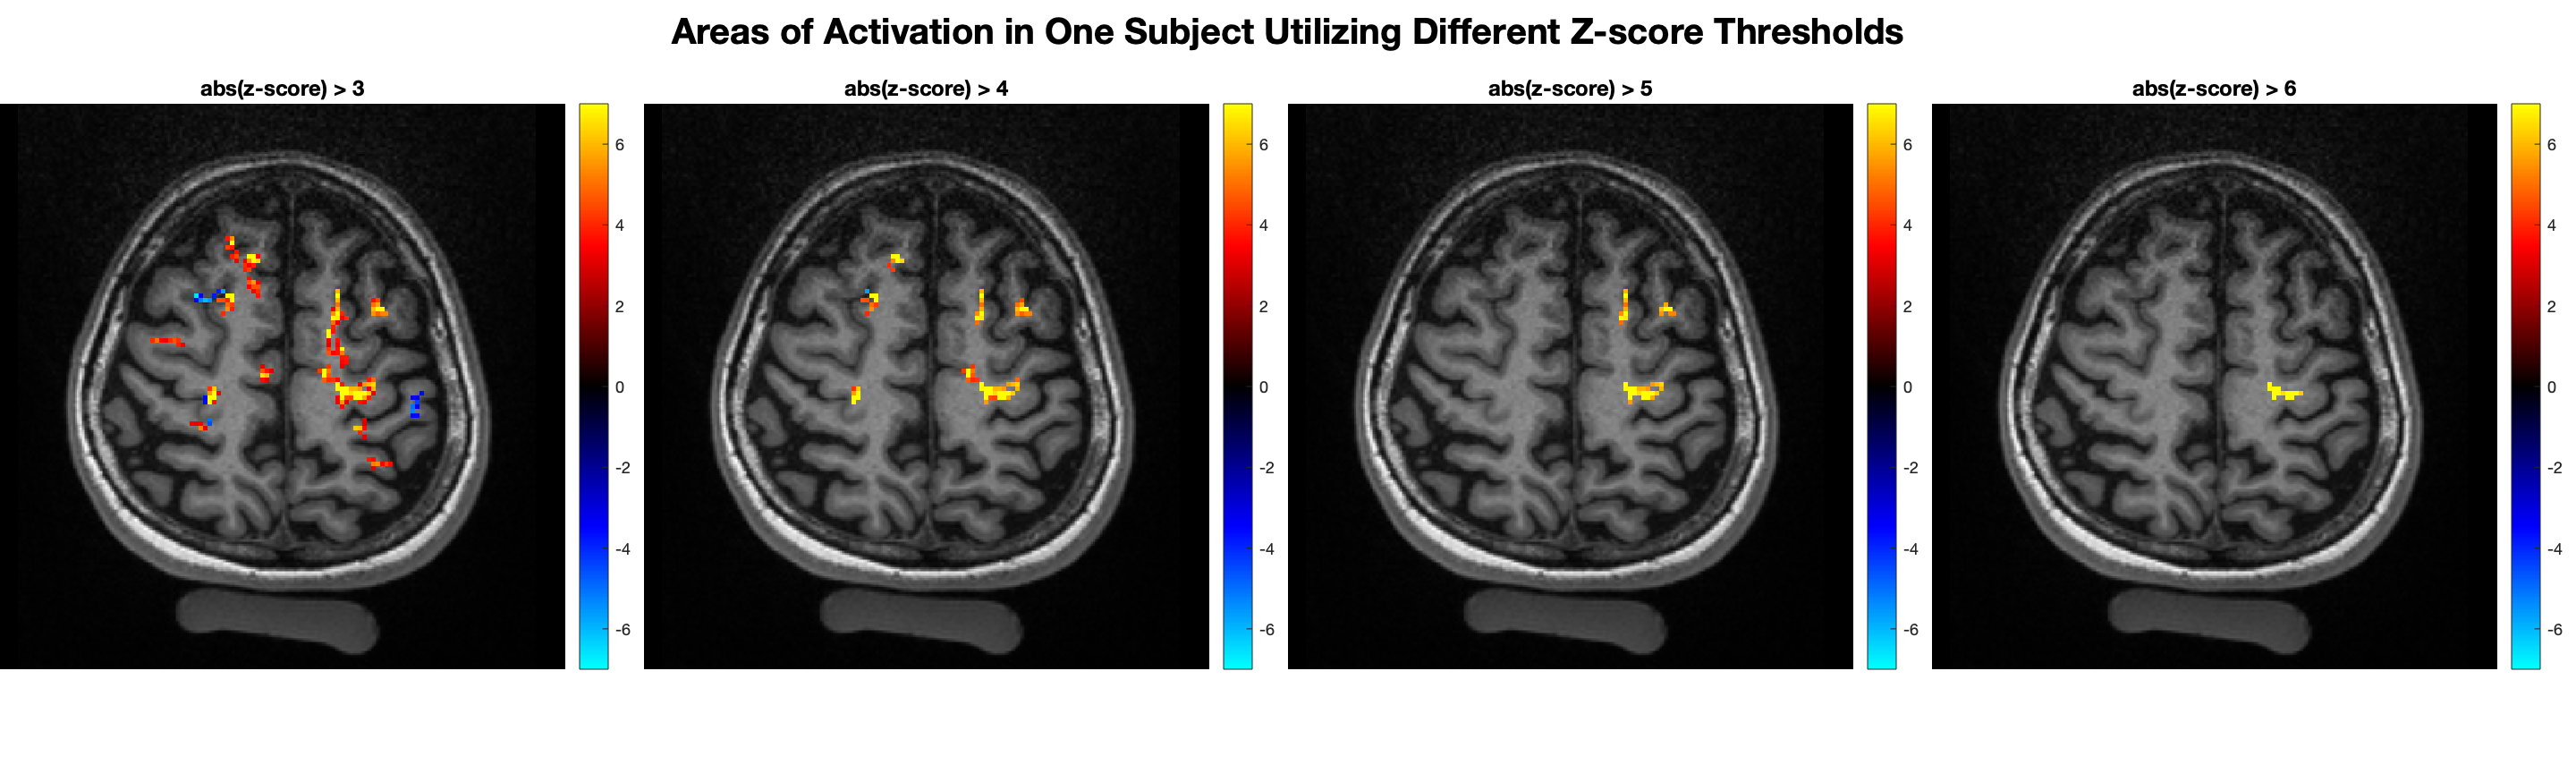
Figure 2, left column, demonstrates “activated” voxels in the central fMRE slice overlaid on an MPRAGE or 2D T1w image for 4 healthy adult subjects in radiologic convention. The z-score thresholds depicted are z>6, z>2.5, z>6, and z>5 respectively. Areas of activation are centered within the left primary motor cortex for each subject and correlate with the area of BOLD response, shown in the right-hand panels. The percentage differences in computed wavelength between PAR1 and PAR2 within a region of interest defined by the activated voxels were 32%, 24%, 34%, and 29% respectively with higher wavelength and associated stiffness in the “off” state in comparison to “on”.Figure 3 demonstrates activated voxels for one example subject using progressively higher z-score thresholds from 3 to 6. At the lowest z-score threshold, areas of activation are seen in the expected location of the left primary motor cortex, premotor area, somatosensory cortex as well as smaller clustered areas of activation in the contralateral right primary motor and somatosensory cortices. Utilization of higher z-score thresholds demonstrates that the most significant voxels localize to the left primary motor cortex.
DISCUSSION & CONCLUSION
These preliminary results show that for switching stimulus time scales faster than that of the human HRF, local biomechanical changes related to functional activation with a motor task result in a decrease in computed wavelength by 30% compared to the off state. Decrease in stiffness with activation is the opposite sign change from what has previously been reported in humans at long timescales. The sign change of stiffness is the same as observed previously in mice for fast stimulus switching and confirms that the fast biomechanical response is likely not vascular-related. These initial results suggest that fMRE may provide a more spatially localized area of neuronal response compared to BOLD and at faster timescales, independent of the vascular effect.Acknowledgements
This project is supported by NIH grants R01EB028664, K01EB027726, R21NS114917, the Department of Radiology at Brigham and Women’s Hospital, and the Radiologic Society of North America Resident Grant.
References
Figures