0588
Ultra-high field normative quantitative susceptibility mapping (QSM) in children and cortical pathology in drug-resistant focal epilepsy
Chiara Casella1,2, Katy Vecchiato1,2,3, Ayse Sila Dokumaci2,4, Philippa Bridgen2,4, Shaihan Malik2,4, Joseph V Hajnal2,4, Sharon Giles2,4, Jan Sedlacik1,2,4,5, Karin Shmueli2,6, Tom Wilkinson2,4, Raphael Tomi-Tricot2,4,7, David W Carmichael2,4, and Jonathan O'Muircheartaigh1,2,3,8
1Centre for the Developing Brain, School of Biomedical Engineering and Imaging Sciences, King's College London, London, United Kingdom, 2London Collaborative Ultra high field System (LoCUS), London, United Kingdom, 3Department for Forensic and Neurodevelopmental Sciences, Institute of Psychiatry, Psychology and Neuroscience, King's College London, London, United Kingdom, 4School of Biomedical Engineering and Imaging Sciences, King's College London, London, United Kingdom, 5Radiology Department, Great Ormond Street Hospital for Children, London, United Kingdom, 6Department of Medical Physics and Biomedical Engineering, University College London, London, United Kingdom, 7MR Research Collaborations, Siemens Healthcare Limited, Frimley, United Kingdom, 8MRC Centre for Neurodevelopmental Disorders, London, United Kingdom
1Centre for the Developing Brain, School of Biomedical Engineering and Imaging Sciences, King's College London, London, United Kingdom, 2London Collaborative Ultra high field System (LoCUS), London, United Kingdom, 3Department for Forensic and Neurodevelopmental Sciences, Institute of Psychiatry, Psychology and Neuroscience, King's College London, London, United Kingdom, 4School of Biomedical Engineering and Imaging Sciences, King's College London, London, United Kingdom, 5Radiology Department, Great Ormond Street Hospital for Children, London, United Kingdom, 6Department of Medical Physics and Biomedical Engineering, University College London, London, United Kingdom, 7MR Research Collaborations, Siemens Healthcare Limited, Frimley, United Kingdom, 8MRC Centre for Neurodevelopmental Disorders, London, United Kingdom
Synopsis
We developed an analysis pipeline to explore normative QSM values in children and adolescents at 7T, and assessed the feasibility of this approach for detecting tissue-alterations in paediatric drug-resistant epilepsy. Normative values consistent with previous QSM studies were reported for deep brain regions, and normative cortical susceptibility values were described for the first time in children and adolescents at 7T. Finally, sensitivity to susceptibility changes in epileptogenic lesions was demonstrated using the analysis pipeline.
Introduction
Quantitative susceptibility mapping (QSM) provides local magnetic susceptibility (χ) estimates using MRI-signal phase1–5 and has previously found promise in the assessment of cortical abnormalities in paediatric epilepsy at 3T6. Importantly, phase-based measurements benefit from increased contrast and resolution at 7T but QSM at ultra-high field has mainly been used to assess deep brain-structures. Cortical normative susceptibility values in children are not well-known, limiting the research or clinical utility of the method. Here we develop a pipeline for assessing childhood normative values of cortical QSM at 7T using surface-mapping based on the Human Connectome Pipeline (HCP)7. We investigate the sensitivity of this normative dataset for detecting tissue-differences associated with focal cortical dysplasia (FCD) in children with drug-resistant epilepsy.Methods
Data acquisition:9 healthy controls (mean age: 11.6 years, range: 8-14 years; 7 males) and 9 pediatric patients with drug-resistant focal epilepsy (mean age: 12.4 years, range: 8-17 years; 6 males) were imaged at 7T (MAGNETOM Terra, Siemens Healthineers, Ethics Ref:18.LO.1766) with a 3D MP2RAGE (0.65mm isotropic, TE/TR=3.15/4000ms,TIs=650/2280ms), 3D FLAIR (0.8mm isotropic, TE/TR=240/9000ms,TI=2600ms) and a 3D T2*-weighted gradient-echo sequence for QSM (0.7mm isotropic, TR=29ms, flip angle= 15.5°, 6 equidistant TEs between 2.68 and 26.13ms).
Data analysis:
QSM reconstruction: Single-channel data was combined for each TE by the sum of the square of all single-channel magnitude images. The combined phase was calculated for each TE by the sum of conjugate complex multiplication between the previous and current TE8. The combined phase image of the first TE was set to zero.
$$Φ_{TE_{1}}=0$$
$$Φ_{TE_{n}}=arg(\sum z_{TE_{n-1}}
⋅\bar{z}_{TE_{n}})\hspace{3mm}∀n>1\hspace{1mm} [1]$$
A brain-mask was computed on the first magnitude image9. The frequency-shift was calculated by a non-linear fit of the complex data over TEs10. The local frequency-shift was calculated using the Projection onto Dipole Fields (PDF) method11 with a brain-mask eroded to 85% to minimise non-local phase contributions. QSM maps were calculated from the local frequency shift using Iterative Tikhonov regularization12.
Image co-registration and analysis: FLAIR and T1w images were analysed with the HCP7 to perform volumetric segmentation and reconstruct white/grey matter and pial surfaces. Bias-corrected magnitude images were rigidly co-registered to their corresponding MP2RAGE volume13, and QSM spatial normalisation was achieved through the composition of the above transformations. A study-specific template was created with the MP2RAGE volumes13, to which each QSM map was warped.
Lesion masking: Two patients with suspected FCD diagnosis based on radiological and electro-clinical reports were selected for this feasibility study. After surgical resection, the FCD was confirmed at histology for Patient 2 (see Table 1 for clinical information). 3D FLAIR images were used to segment the brain lesion and create 3D binary masks.
Computation of a control distribution: The remaining patients and healthy participants were combined to build a heterogeneous pseudo-control distribution (making the assumption that lesions did not overlap in any two patients), against which individual QSM changes in the two patients were tested. Masks of globus pallidus, putamen, caudate and cortical ribbon were used to calculate normative average and standard deviation values.
Deviation maps of FCDs: Maps of susceptibility deviation within lesions were obtained by computing the voxel-wise z-score. Values beyond the interval [−2, 2] were considered as representing significant differences in patients compared to the control distribution14.
Surface mapping and FCD profiling: QSM was sampled along surfaces extracted at different depths from the pial surface down to 6mm in 0.5mm steps. The QSM surfaces were smoothed using a 10mm vertex-wise FWHM Gaussian kernel6. The smoothed QSM surfaces and the lesion masks were mapped to a standard surface (fsaverage). Average χ values at different cortical depths within the lesion area were extracted, and z-score QSM profiles were computed.
Results
An example susceptibility map is shown in Figure 1. Caudate, putamen and globus pallidus are clearly visible, consistent with previous findings15–18. Normative susceptibility values for these structures (Figure 2) are roughly consistent with previous paediatric studies at 3T19–21, and marginally lower than previous adult studies17,22,23, in line with the positive correlation previously reported between age and χ24–26. Figure 2 also reports mean and standard deviation of cortical χ values. Results of the voxel-wise MRI lesion-profiling and depth-dependent QSM sampling are shown in Figures 3 & 4. Depth-dependent signal sampling showed the highest sensitivity to changes, revealing increasingly negative z-scores at ~5mm from the pial surface in Patient 1, and increasingly positive z-scores at ~4mm depth in Patient 2.Discussion
We evaluated the feasibility of 7T QSM to investigate epileptogenic lesions in pediatric focal epilepsy. The obtained QSM normative values were consistent with previous studies19–21 and the analysis approaches utilised were sensitive to susceptibility changes in epileptogenic lesions. The finding of decreased susceptibility across cortical depths within Patient 1’s FCD is in line with previous evidence6, suggested to represent colocalized reductions in iron and myelin. Susceptibility increases observed in Patient 2’s FCD may represent increased iron accumulation owing to tissue-inflammation, abnormal cells and oedema, thus suggesting the presence of an FCD type IIb 27–29, consistent with the pathology report (Table 1).Conclusion
These first results indicate the feasibility of ultra-high field QSM for the in-vivo characterisation of FCDs in paediatric epilepsy, however replication in a larger sample is needed.Acknowledgements
This work was supported by a Sir Henry Dale Fellowship jointly funded by the Wellcome Trust and the Royal Society [206675/Z/17/Z], GOSHCC Sparks Grant [V4419], King's Health Partners and by core funding from the Wellcome/EPSRC Centre for Medical Engineering [WT203148/Z/16/Z], as well as by the National Institute for Health Research (NIHR) Biomedical Research Centre based at Guy’s and St Thomas’ NHS Foundation Trust and King’s College London and/or the NIHR Clinical Research Facility. The views expressed are those of the author(s) and not necessarily those of the NHS, the NIHR or the Department of Health and Social Care. We are also thankful to the families who contributed their time to this research, and to our colleagues from the Evelina London Children Hospital, St Thomas’ Hospital and Centre for the Developing Brain.References
1. de Rochefort L, Liu T, Kressler B, et al. Quantitative susceptibility map reconstruction from MR phase data using bayesian regularization: validation and application to brain imaging. Magnetic Resonance in Medicine. 2010;63(1):194-206.2. Deistung A, Schweser F, Reichenbach JR. Overview of quantitative susceptibility mapping. NMR in Biomedicine. 2017;30(4):e3569.
3. Haacke EM, Liu S, Buch S, Zheng W, Wu D, Ye Y. Quantitative susceptibility mapping: current status and future directions. Magnetic resonance imaging. 2015;33(1):1-25.
4. Liu C, Wei H, Gong NJ, Cronin M, Dibb R, Decker K. Quantitative Susceptibility Mapping: Contrast Mechanisms and Clinical Applications. Tomography. 2015;1(1):3-17. doi:10.18383/j.tom.2015.00136
5. Shmueli K, Zwart JA de, Gelderen P van, Li TQ, Dodd SJ, Duyn JH. Magnetic susceptibility mapping of brain tissue in vivo using MRI phase data. Magnetic Resonance in Medicine. 2009;62(6):1510-1522. doi:10.1002/mrm.22135
6. Lorio S, Sedlacik J, So PW, et al. Quantitative MRI susceptibility mapping reveals cortical signatures of changes in iron, calcium and zinc in malformations of cortical development in children with drug-resistant epilepsy. NeuroImage. 2021;238:118102. doi:10.1016/j.neuroimage.2021.118102
7. Glasser MF, Sotiropoulos SN, Wilson JA, et al. The minimal preprocessing pipelines for the Human Connectome Project. Neuroimage. 2013;80:105-124. doi:10.1016/j.neuroimage.2013.04.127
8. Robinson SD, Bredies K, Khabipova D, Dymerska B, Marques JP, Schweser F. An illustrated comparison of processing methods for MR phase imaging and QSM: combining array coil signals and phase unwrapping. NMR Biomed. 2017;30(4). doi:10.1002/nbm.3601
9. Jenkinson M, Pechaud M, Smith S. BET2: MR-based estimation of brain, skull and scalp surfaces. In: Vol 17. Toronto.; 2005:167.
10. Liu T, Wisnieff C, Lou M, Chen W, Spincemaille P, Wang Y. Nonlinear formulation of the magnetic field to source relationship for robust quantitative susceptibility mapping. Magnetic resonance in medicine. 2013;69(2):467-476.
11. Liu T, Khalidov I, de Rochefort L, et al. A novel background field removal method for MRI using projection onto dipole fields. NMR in Biomedicine. 2011;24(9):1129-1136.
12. Karsa A, Punwani S, Shmueli K. An optimized and highly repeatable MRI acquisition and processing pipeline for quantitative susceptibility mapping in the head‐and‐neck region. Magnetic Resonance in Medicine. 2020;84(6):3206-3222.
13. Avants BB, Tustison NJ, Song G, Cook PA, Klein A, Gee JC. A reproducible evaluation of ANTs similarity metric performance in brain image registration. Neuroimage. 2011;54(3):2033-2044. doi:10.1016/j.neuroimage.2010.09.025
14. Bonnier G, Roche A, Romascano D, et al. Multicontrast MRI Quantification of Focal Inflammation and Degeneration in Multiple Sclerosis. Biomed Res Int. 2015;2015:569123. doi:10.1155/2015/569123
15. Langkammer C, Krebs N, Goessler W, et al. Quantitative MR imaging of brain iron: a postmortem validation study. Radiology. 2010;257(2):455-462.
16. Wang Y, Liu T. Quantitative susceptibility mapping (QSM): Decoding MRI data for a tissue magnetic biomarker. Magn Reson Med. 2015;73(1):82-101. doi:10.1002/mrm.25358
17. Betts MJ, Acosta-Cabronero J, Cardenas-Blanco A, Nestor PJ, Düzel E. High-resolution characterisation of the aging brain using simultaneous quantitative susceptibility mapping (QSM) and R2* measurements at 7 T. Neuroimage. 2016;138:43-63.
18. Acosta-Cabronero J, Betts MJ, Cardenas-Blanco A, Yang S, Nestor PJ. In vivo MRI mapping of brain iron deposition across the adult lifespan. Journal of Neuroscience. 2016;36(2):364-374.
19. Treit S, Naji N, Seres P, et al. R2* and quantitative susceptibility mapping in deep gray matter of 498 healthy controls from 5 to 90 years. Hum Brain Mapp. 2021;42(14):4597-4610. doi:10.1002/hbm.25569
20. Peterson ET, Kwon D, Luna B, et al. Distribution of brain iron accrual in adolescence: Evidence from cross-sectional and longitudinal analysis. Human Brain Mapping. 2019;40(5):1480-1495. doi:10.1002/hbm.24461
21. Li W, Wu B, Batrachenko A, et al. Differential developmental trajectories of magnetic susceptibility in human brain gray and white matter over the lifespan. Hum Brain Mapp. 2013;35(6):2698-2713. doi:10.1002/hbm.22360
22. Rua C, Clarke WT, Driver ID, et al. Multi-centre, multi-vendor reproducibility of 7T QSM and R2* in the human brain: Results from the UK7T study. NeuroImage. 2020;223:117358. doi:10.1016/j.neuroimage.2020.117358
23. Deistung A, Schäfer A, Schweser F, et al. High-resolution MR imaging of the human brainstem in vivo at 7 Tesla. Frontiers in human neuroscience. 2013;7:710.
24. Bilgic B, Pfefferbaum A, Rohlfing T, Sullivan EV, Adalsteinsson E. MRI estimates of brain iron concentration in normal aging using quantitative susceptibility mapping. Neuroimage. 2012;59(3):2625-2635.
25. Keuken MC, Bazin PL, Backhouse K, et al. Effects of aging on T₁, T₂*, and QSM MRI values in the subcortex. Brain Struct Funct. 2017;222(6):2487-2505. doi:10.1007/s00429-016-1352-4
26. Burgetova R, Dusek P, Burgetova A, et al. Age-related magnetic susceptibility changes in deep grey matter and cerebral cortex of normal young and middle-aged adults depicted by whole brain analysis. Quant Imaging Med Surg. 2021;11(9):3906-3919. doi:10.21037/qims-21-87
27. Garbelli R, Zucca I, Milesi G, et al. Combined 7-T MRI and histopathologic study of normal and dysplastic samples from patients with TLE. Neurology. 2011;76(13):1177-1185.
28. Zucca I, Milesi G, Medici V, et al. Type II focal cortical dysplasia: Ex vivo 7 T magnetic resonance imaging abnormalities and histopathological comparisons. Annals of neurology. 2016;79(1):42-58.
29. Mühlebner A, Coras R, Kobow K, et al. Neuropathologic measurements in focal cortical dysplasias: validation of the ILAE 2011 classification system and diagnostic implications for MRI. Acta neuropathologica. 2012;123(2):259-272.
Figures
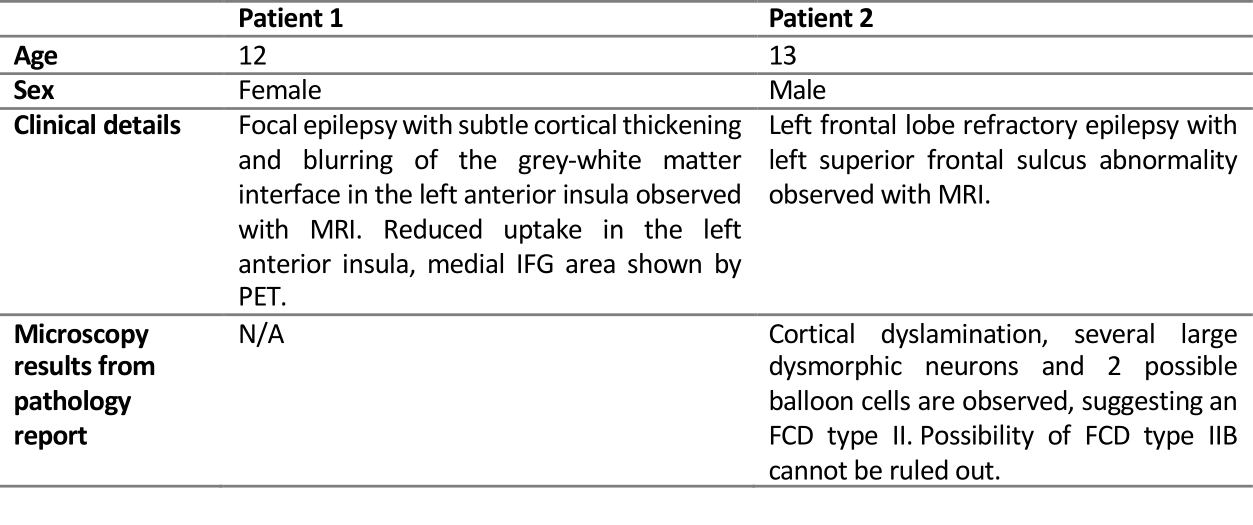
Table 1. Patients’ demographics, clinical characteristics and description of microscopy results (Patient 2).
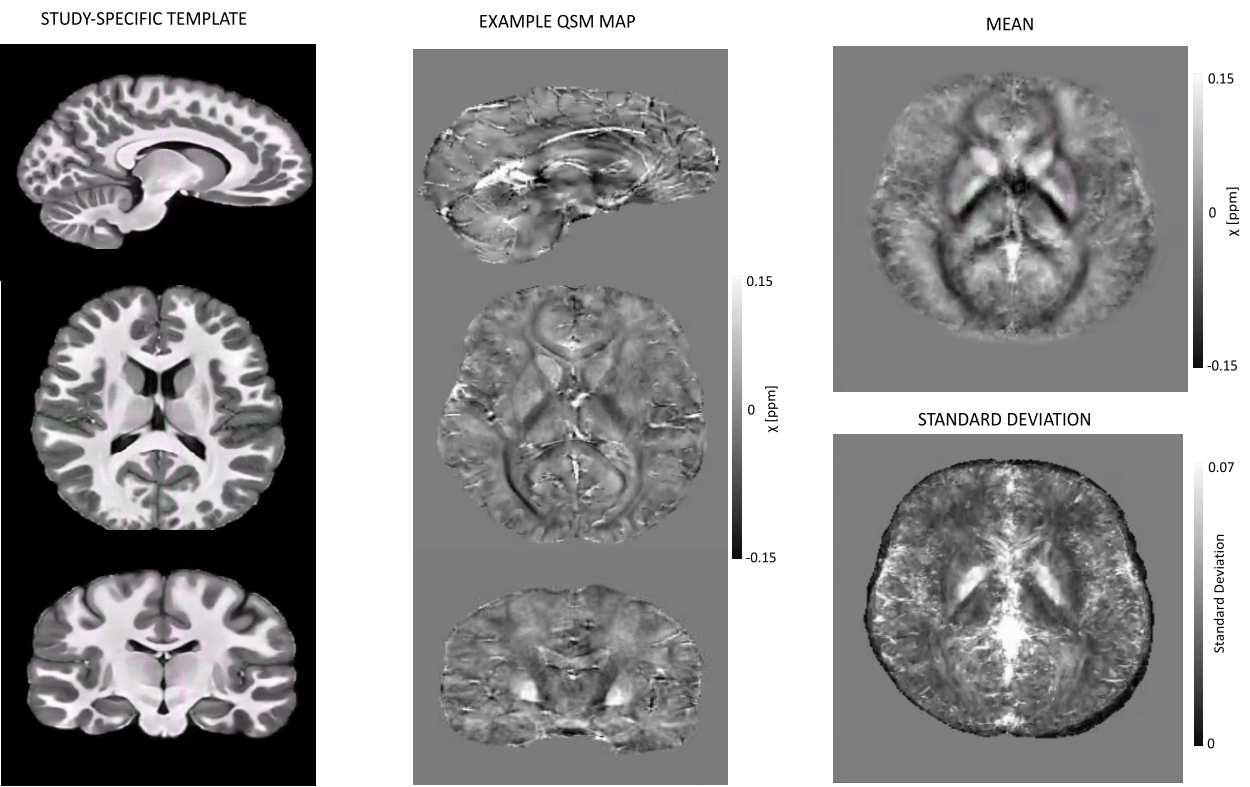
Figure 1. Sagittal, axial and coronal views of the MP2RAGE template and a QSM map from a representative control subject. On the right, mean and standard deviation maps of the normative QSM data are displayed. On the bottom right image cortical superficial loss can be observed, due to the brain-mask erosion carried out to minimize non-local phase contributions. However, this should not be critical for the study of focal epilepsy, where visualization of the gray/white matter border is of interest.
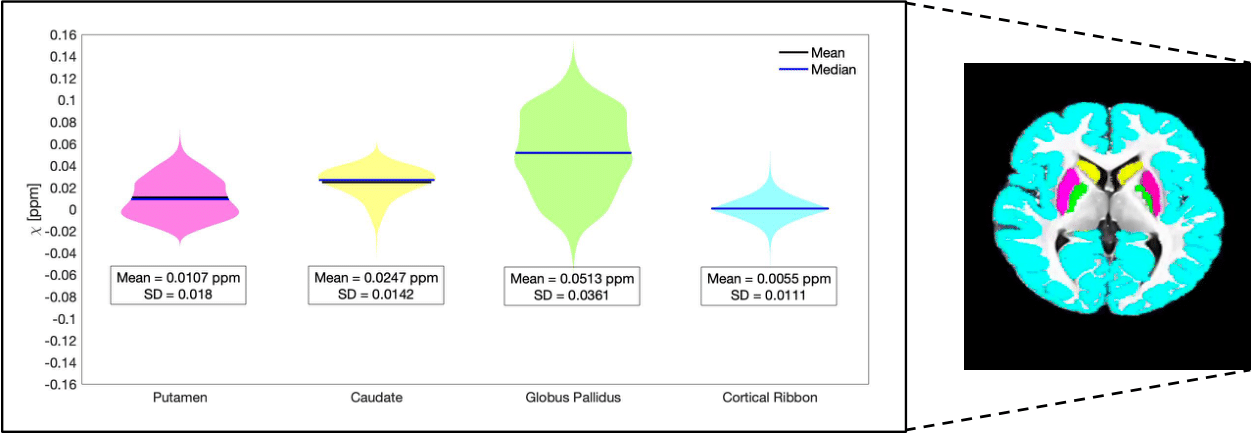
Figure 2. Putamen, caudate, globus pallidus and cortical ribbon ROIs are shown superimposed on the study-specific template (right). The violin plot displays the mean and standard deviation of χ for each ROI.
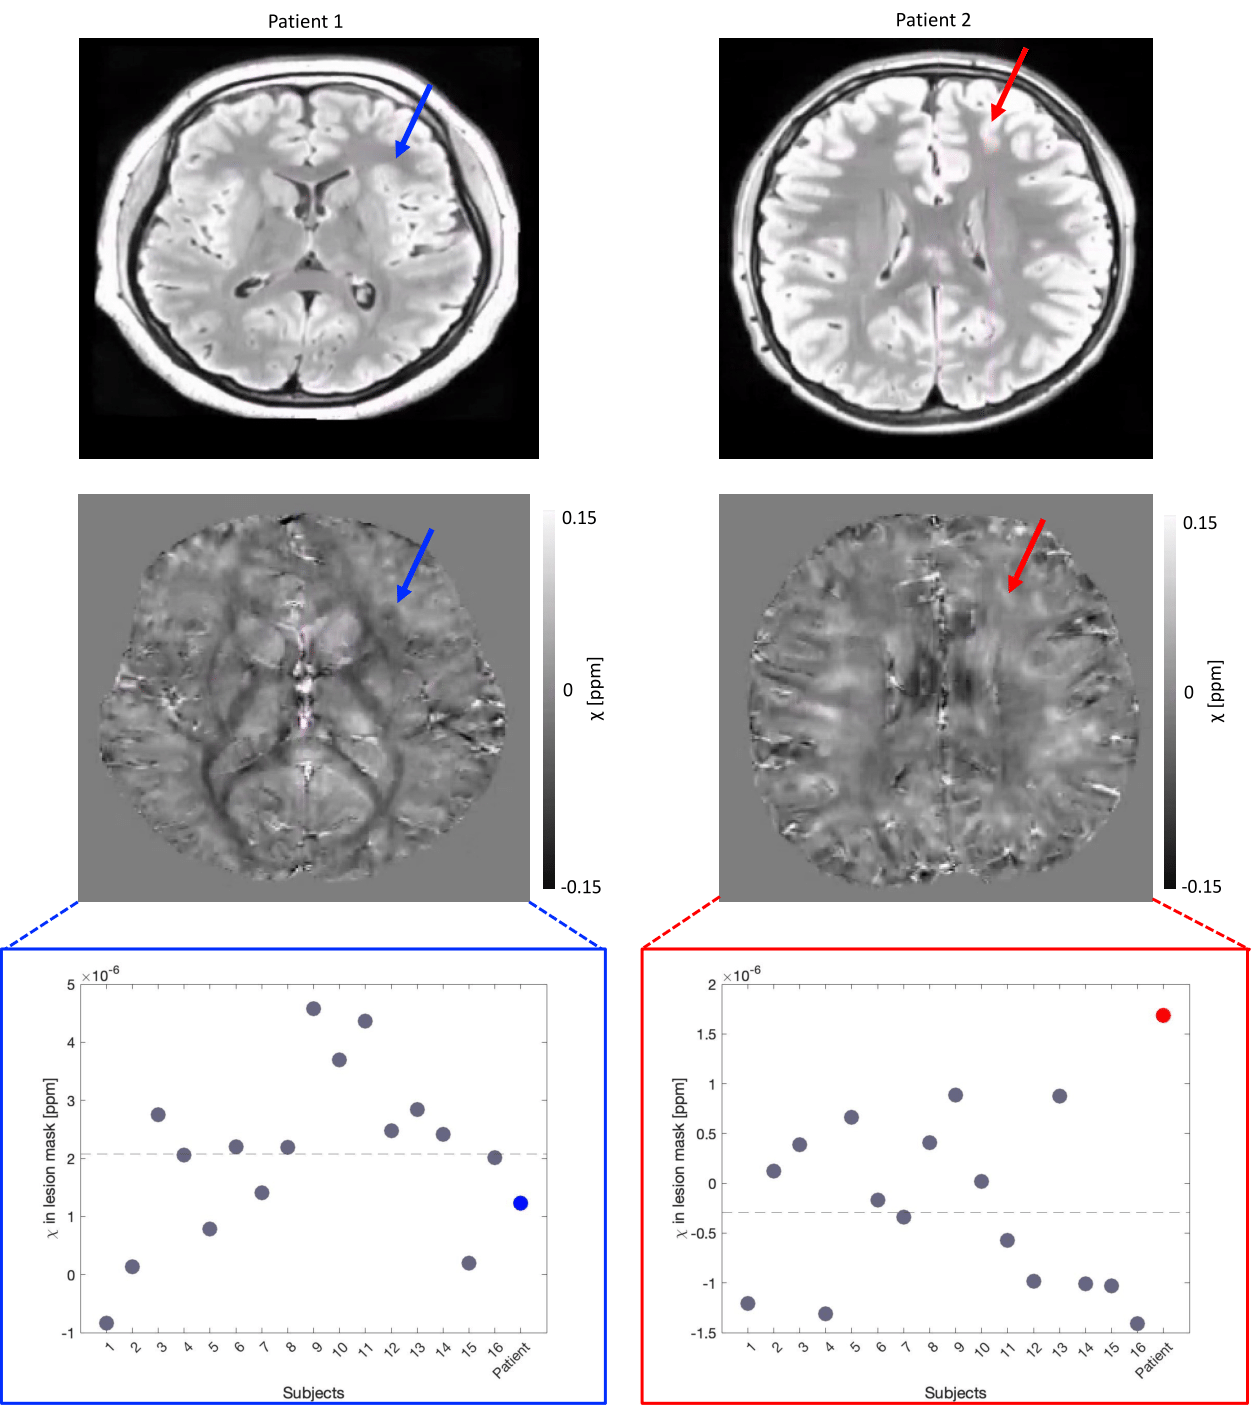
Figure 3. FLAIR images (top) and QSM maps (middle) for each patient; the arrows point towards the FCD. Bottom: Lesion mask mean χ values for each participant; grey dots represent subjects from the control distribution, ordered by age, while Patient 1 and Patient 2 are highlighted in blue and red, respectively. The grey dashed lines represent the overall mean χ in the lesion mask for the control distribution. Mean χ was consistent with the normal range in Patient 1 but increased in Patient 2.
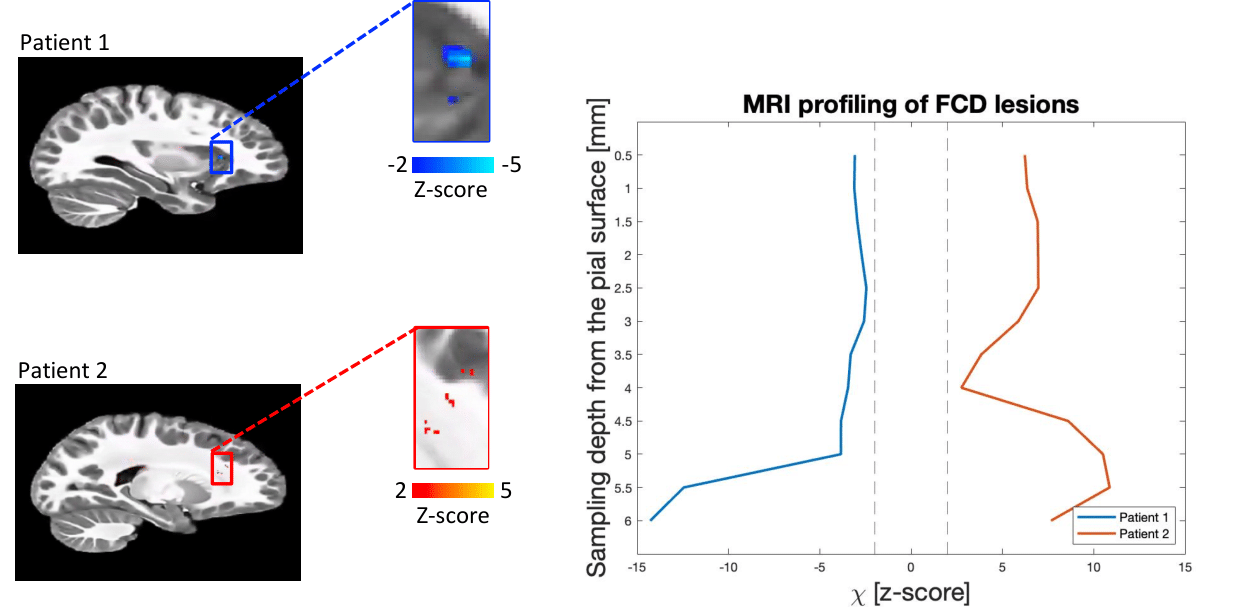
Figure 4. Voxel-wise FCD deviation maps and depth-dependent FCD profiling. On the left, voxels with a z-score <>2 within the FCD are displayed on the template. The plot on the right shows depth-dependent QSM z-score profiling obtained in the FCD of each patient, as compared to the control distribution. The sampling-depth is reported as a distance from the pial surface. The vertical dashed lines identify z-scores == +-2. Depth-dependent QSM sampling showed higher sensitivity to changes compared to voxel-wise assessment, with the largest changes seen at > 4mm from the cortical surface.
DOI: https://doi.org/10.58530/2022/0588