0587
Automated lesion prediction and characterisation of focal cortical abnormalities: a MELD study1Wellcome Centre for Human Neuroimaging, UCL, London, United Kingdom, 2Great Ormond Street Institute for Child Health, UCL, London, United Kingdom, 3UCL, London, United Kingdom, 4Institute of Computational Biology, Helmholtz Zentrum München, Munich, Germany
Synopsis
Identification of subtle epilepsy-causing focal cortical dysplasias (FCD) on MRI remains an outstanding challenge during presurgical assessment of patients. The Multi-centre Epilepsy Lesion Detection (MELD) project created an MRI lesion detection algorithm using a large, heterogenous cohort. The algorithm had a sensitivity of 67%, performing well on unseen test sites. Analysis of MRI lesions revealed distinct subgroups, with differing histopathological subtypes, imaging features and detection rates. Individual patient reports highlight a predicted lesion’s location, imaging features and their relative saliency to the classifier. This tool has the potential to improve presurgical lesion identification on MRI from patients with epileptogenic FCD.
Purpose
Drug-resistant focal epilepsy may be caused by focal cortical dysplasias (FCDs), a malformation of cortical development. FCDs are amenable to neurosurgical resection but can be difficult to visualise on MRI. As post-surgical seizure freedom is affected by whether the FCD can be identified on preoperative structural MRI[1] there has been considerable effort placed in improving the detection of these lesions. We aimed to develop an open-source, interpretable, surface-based machine-learning algorithm to automatically identify FCDs on heterogeneous structural MRI data from epilepsy surgery centres worldwide.Methods
The Multi-centre Epilepsy Lesion Detection (MELD) Project collated a retrospective cohort of 1015 participants, 618 patients with drug-resistant FCD and 397 controls, from 22 epilepsy centres worldwide. We created an artificial neural network for FCD detection based on 33 surface-based features, extracted from T1-weighted and FLAIR images, and pre-processed to reduced scanner, sites, age and cortical region-based bias. The network, composed of 2 hidden layers, was trained and cross-validated on 50% of the total cohort (278 patients, 180 controls) and tested on the remaining 50% (260 patients, 193 controls) as well as on 2 independent test sites (IS1: 17 patients / 18 controls; IS2: 16 patients). Classifier predictions were made for each individual in the test cohort. Classifier sensitivity was defined as the proportion of patients with a predicted cluster overlapping with an expanded manual lesion mask, and specificity as the proportion of controls with zero predicted clusters. The average number of predicted clusters in patients and controls was also quantified. To interrogate MRI characteristics of lesions, multidimensional feature analysis was carried out using UMAP embedding and subsequent clustering[2]. To understand how features contributed to classifier predictions, we computed saliencies through integrated gradients[3].Results
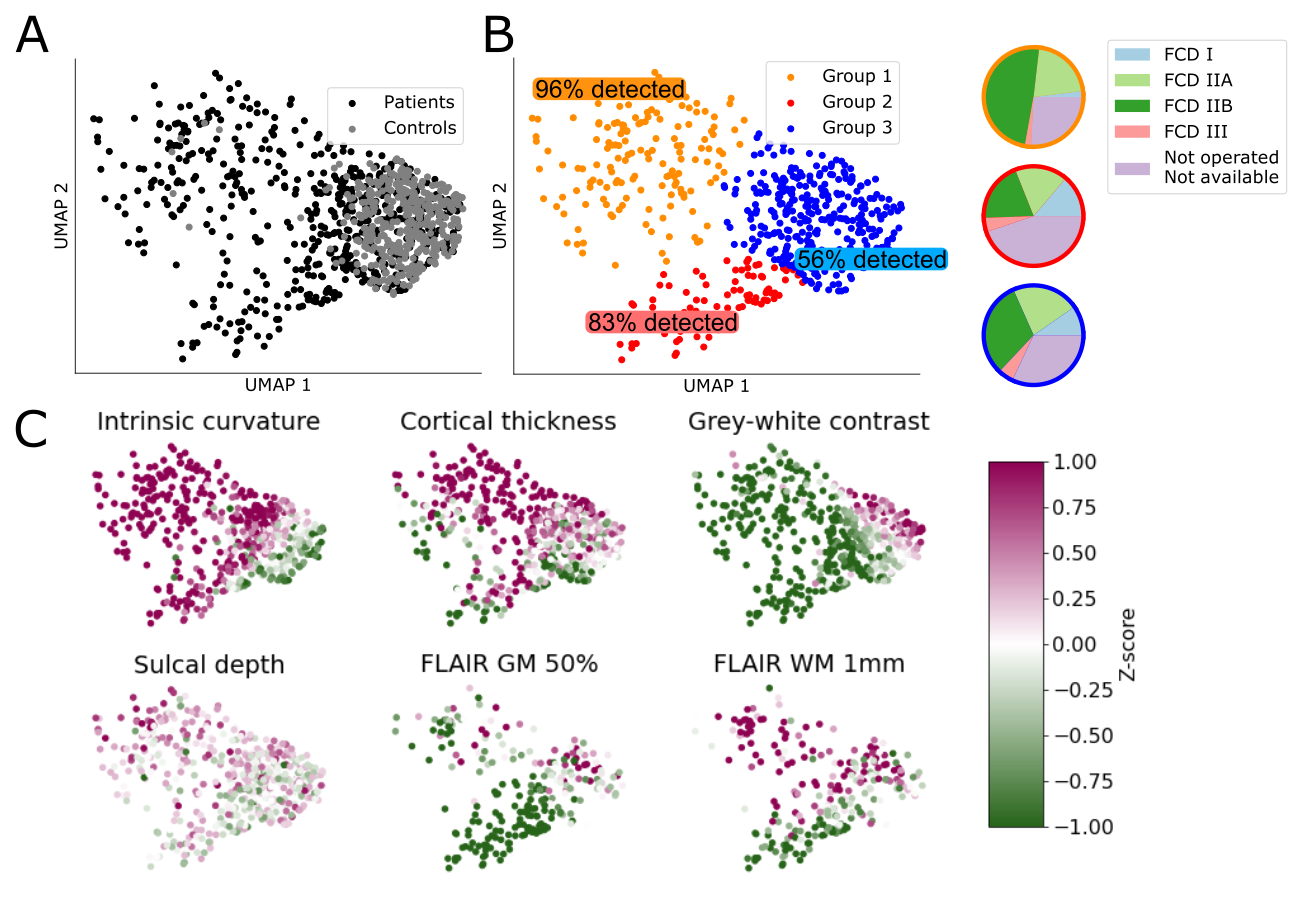
The classifier performance is summarised in Table 1. On the test cohort, sensitivity was 67% and specificity was 54%, with similar sensitivities achieved on the independent test sites. UMAP embedding of lesional features exhibited 3 distinct groups of patients, characterised by different MRI features, FCD histopathological subtypes and classifier detection rates (Figure 1). For patients, individualised reports present the predicted lesion on 3D cortical surface reconstructions and projected back into their native T1-weighted MRI scan (Figure 2A). Imaging feature summaries characterise lesional features and their relative saliency (Figure 2B).Discussion
We present a fully automated pipeline for surface-based detection of focal cortical dysplasias, which has been validated on a large withheld test cohort, incorporating data from 20 sites, and two independent sites. The sensitivity to detect lesions in the test cohort was 67%, with sensitivities of 94% and 62% in the independent sites. Multidimensional analysis of lesional cortex revealed groups of lesions characterised by different MRI features, histopathlogies and detection rates, indicating the classifier is capable of detecting lesions characterised by a variety of abnormal features. Individual patient reports provide a map of the predicted lesion locations alongside the quantified lesional features and how salient they were considered by the classifier.Conclusion
This multi-centre, multinational MELD study with open-access protocols and code has developed a robust and interpretable machine-learning algorithm for automated detection of focal cortical dysplasias. This tool has the potential to augment the presurgical evaluation of patients by identifying subtle FCDs.Acknowledgements
The MELD project is funded by the Rosetrees Trust. A full list of collaborators can be found at https://meldproject.github.io//docs/collaborator_list.pdfReferences
1. Téllez-Zenteno, J. F., Ronquillo, L. H., Moien-Afshari, F. & Wiebe, S. Surgical outcomes in lesional and non-lesional epilepsy: A systematic review and meta-analysis. Epilepsy Res. 89, 310–318 (2010).
2. McInnes, L., Healy, J. & Melville, J. UMAP: Uniform Manifold Approximation and Projection for Dimension Reduction. arXiv [stat.ML] (2018).
3. Sundararajan, M., Taly, A. & Yan, Q. Axiomatic attribution for deep networks. arXiv [cs.LG] (2017).
Figures