0586
Detecting tract-specific abnormalities in individual patients with epilepsy using fixel-based analysis1Florey Institute of Neuroscience and Mental Health, Melbourne, VIC, Australia, 2Department of Psychology and Neuroscience, Auckland University of Technology, Auckland, New Zealand, 3Florey Department of Neuroscience and Mental Health, University of Melbourne, Melbourne, VIC, Australia, 4Melbourne Medical School, University of Melbourne, Melbourne, VIC, Australia, 5Department of Neurology, Austin Health, Melbourne, VIC, Australia
Synopsis
Fibre tract-specific abnormalities have been identified in various neurological disorders and conditions using fixel-based analysis. However, for this technique to be useful in clinical practice, such abnormalities should be detectable in individual patients. In this work, we apply the fixel-based analysis framework to detect fibre density and cross-sectional changes in individual patients with varying epilepsy diagnoses. Abnormalities could be detected in individual epilepsy patients, both at the tract level, and at the fixel-level, with different patterns of tract-based abnormality observed across the different epilepsy syndromes. This information could be clinically valuable when examining individual patients.
Introduction
Both focal and generalised epilepsies are known to be characterised by disruption to structural brain networks, made up of white matter tracts. These structural network disruptions have been identified in group studies comparing patient and control cohorts in varying types of epilepsy syndromes1–4. However, for this information to be useful in clinical practice, these abnormalities should be able to be detected in individual patients. Correspondingly, the detection of white matter tract abnormalities in individuals has become a recent topic of interest, with individual deviations being explored in various neurological disorders, including schizophrenia5, traumatic brain injury6, and epilepsy7. Such studies have examined individual deviations in DTI-based metrics, which are limited in their specificity to fibre populations, particularly in the presence of crossing-fibre structures.In this study, we apply the fixel-based analysis (FBA) framework8 to investigate whether tract-specific abnormalities can be detected in individuals with varying epilepsy diagnoses. We examine whether individual abnormalities can be observed at the tract level, as well as at the fixel level (specific fibre population within a voxel).
Methods
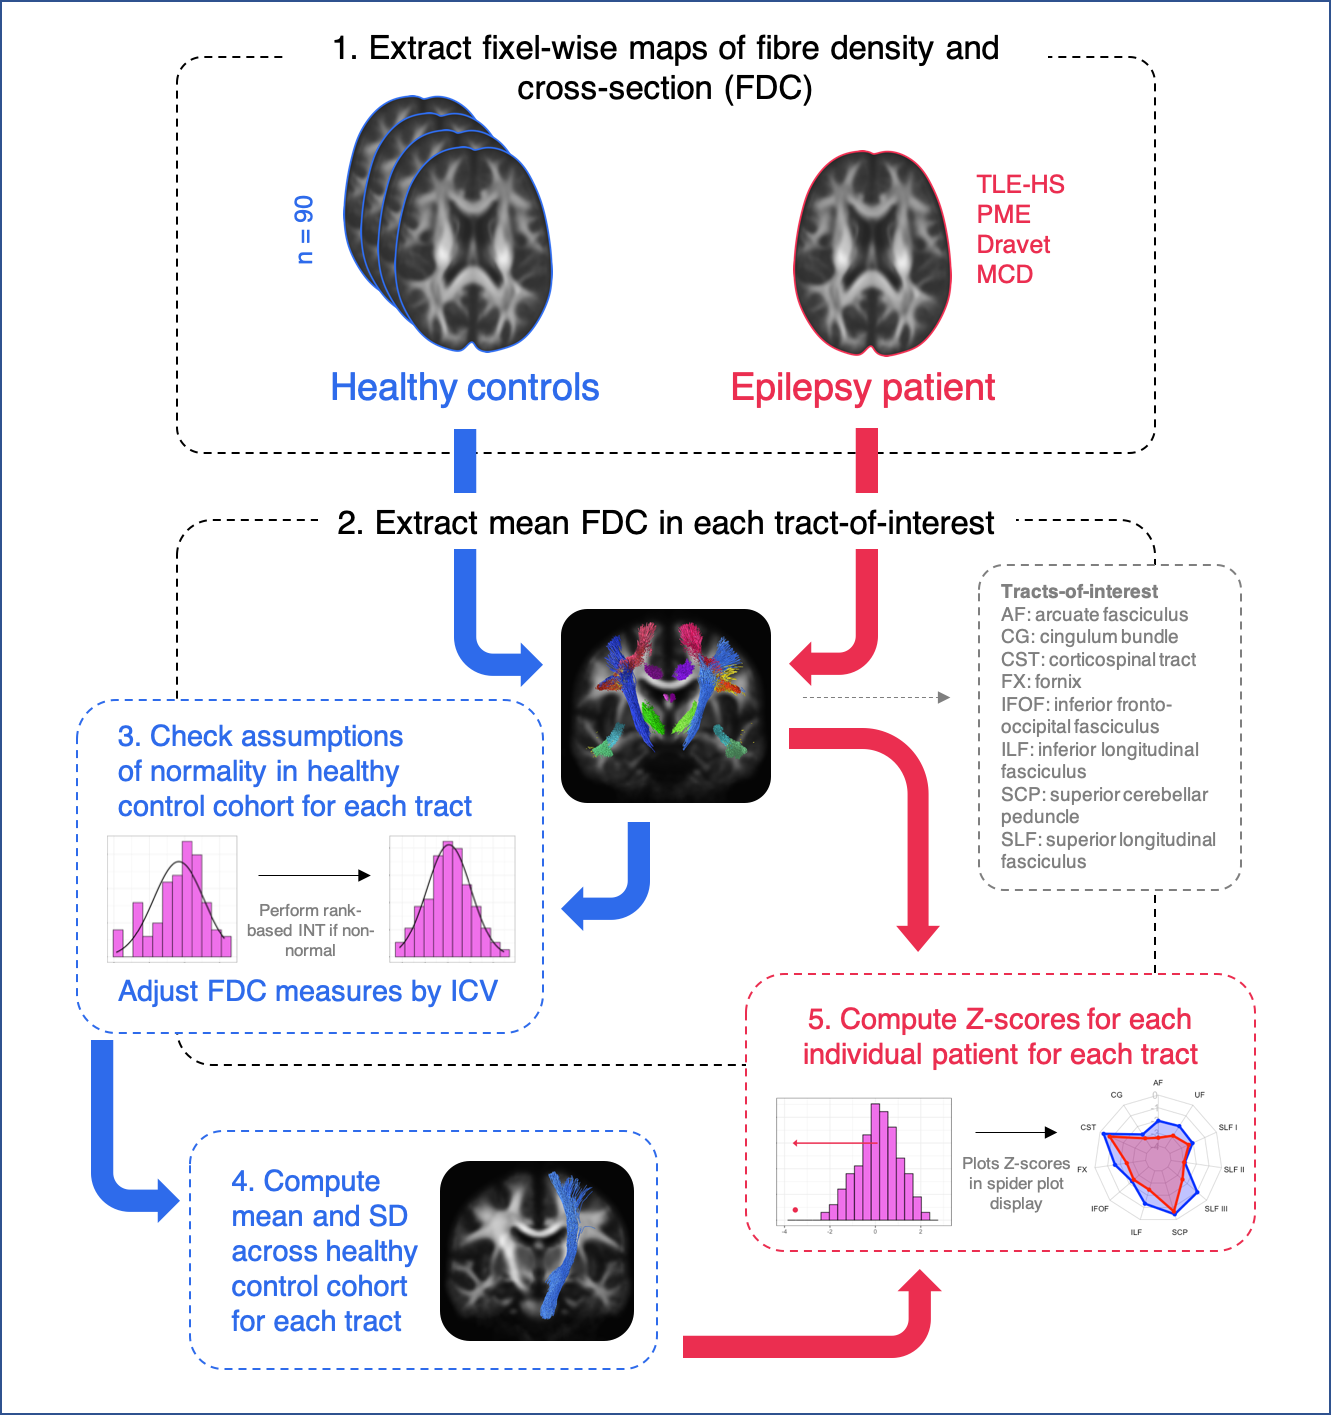
Diffusion-weighted imaging (DWI) data from 90 neurologically healthy adults (mean age = 36 ± 13) were used to construct a reference data set against whom we could compare individual patients with epilepsy. Patients with varying types of focal and generalised epilepsy syndromes were included for individual analysis. This included patients with temporal lobe epilepsy with hippocampal sclerosis (TLE-HS), epilepsies with a known genetic basis (Progressive Myoclonus Epilepsy and Dravet Syndrome), and malformations of cortical development.DWI data were acquired on a 3T Siemens Trio or Skyra (2.3mm3 isotropic voxels, 60+ directions at b=3000s/mm2, 8 b=0 images), and preprocessed using MRtrix39. FODs were computed with single-shell 3-tissue constrained spherical deconvolution10,11, and spatial correspondence was achieved by creating a healthy control population template image using FOD images from 40 randomly selected individuals12. A measure of fibre density and cross-section (FDC)8 was obtained at each white matter fixel for each participant in template space, and connectivity-based smoothing performed on FDC measures13. Data harmonisation of FDC measures across the two scanner types was performed using ComBat14.
Major fibre tracts of interest were extracted from the template tractogram using TractSeg15, and for each participant, mean FDC values extracted across fixels within each tract. Assumptions of normality were tested for each tract across the control cohort, and rank-based inverse normal transformations (INTs)16 performed where normality was not met. Given that significant linear associations were observed between tract FDC and intracranial volume (ICV), normalised tract-based FDC values were subsequently adjusted by ICV.
The mean and standard deviation (SD) across the healthy control cohort was then computed for each white matter tract. Following this, Z-scores were computed for individual patients with epilepsy when compared to the healthy control cohort. Spider plots were used to display tract Z-scores for an individual patient.
The pipeline for individual tract-based analysis is shown in Figure 1.
We also explored individual abnormalities at each white matter fixel, using a whole-brain approach. Here, we followed a similar pipeline to the tract-based approach, whereby the healthy population mean FDC value and standard deviation were computed at each white matter fixel. For individual patients, a Z-score could then be computed at each fixel.
Results
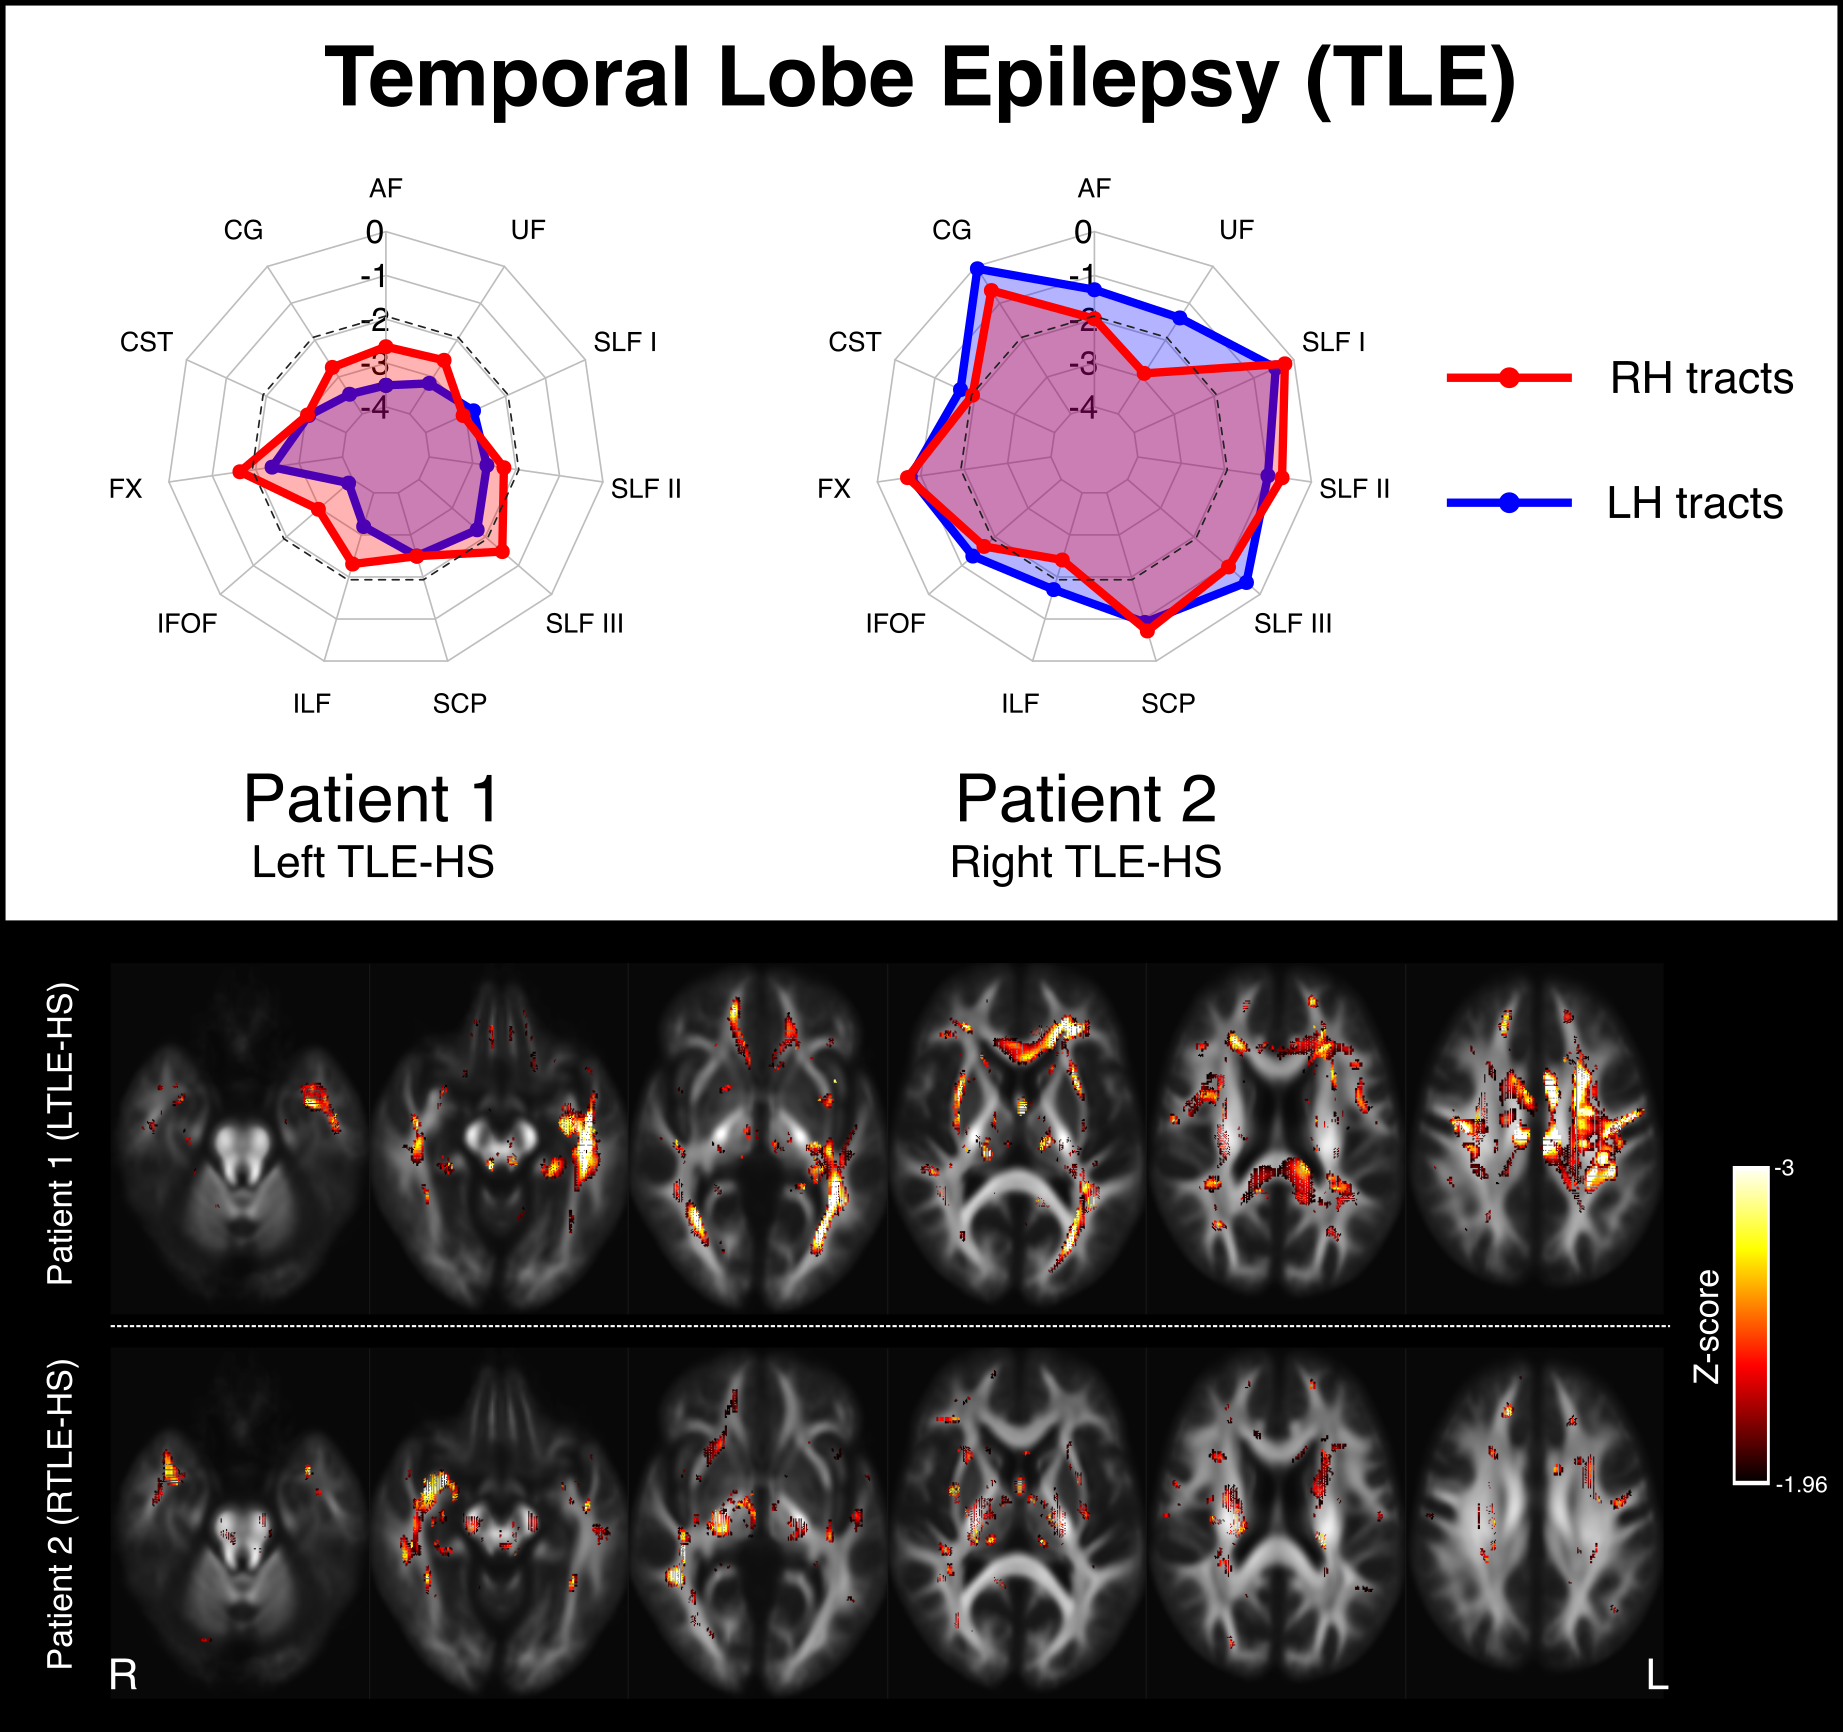
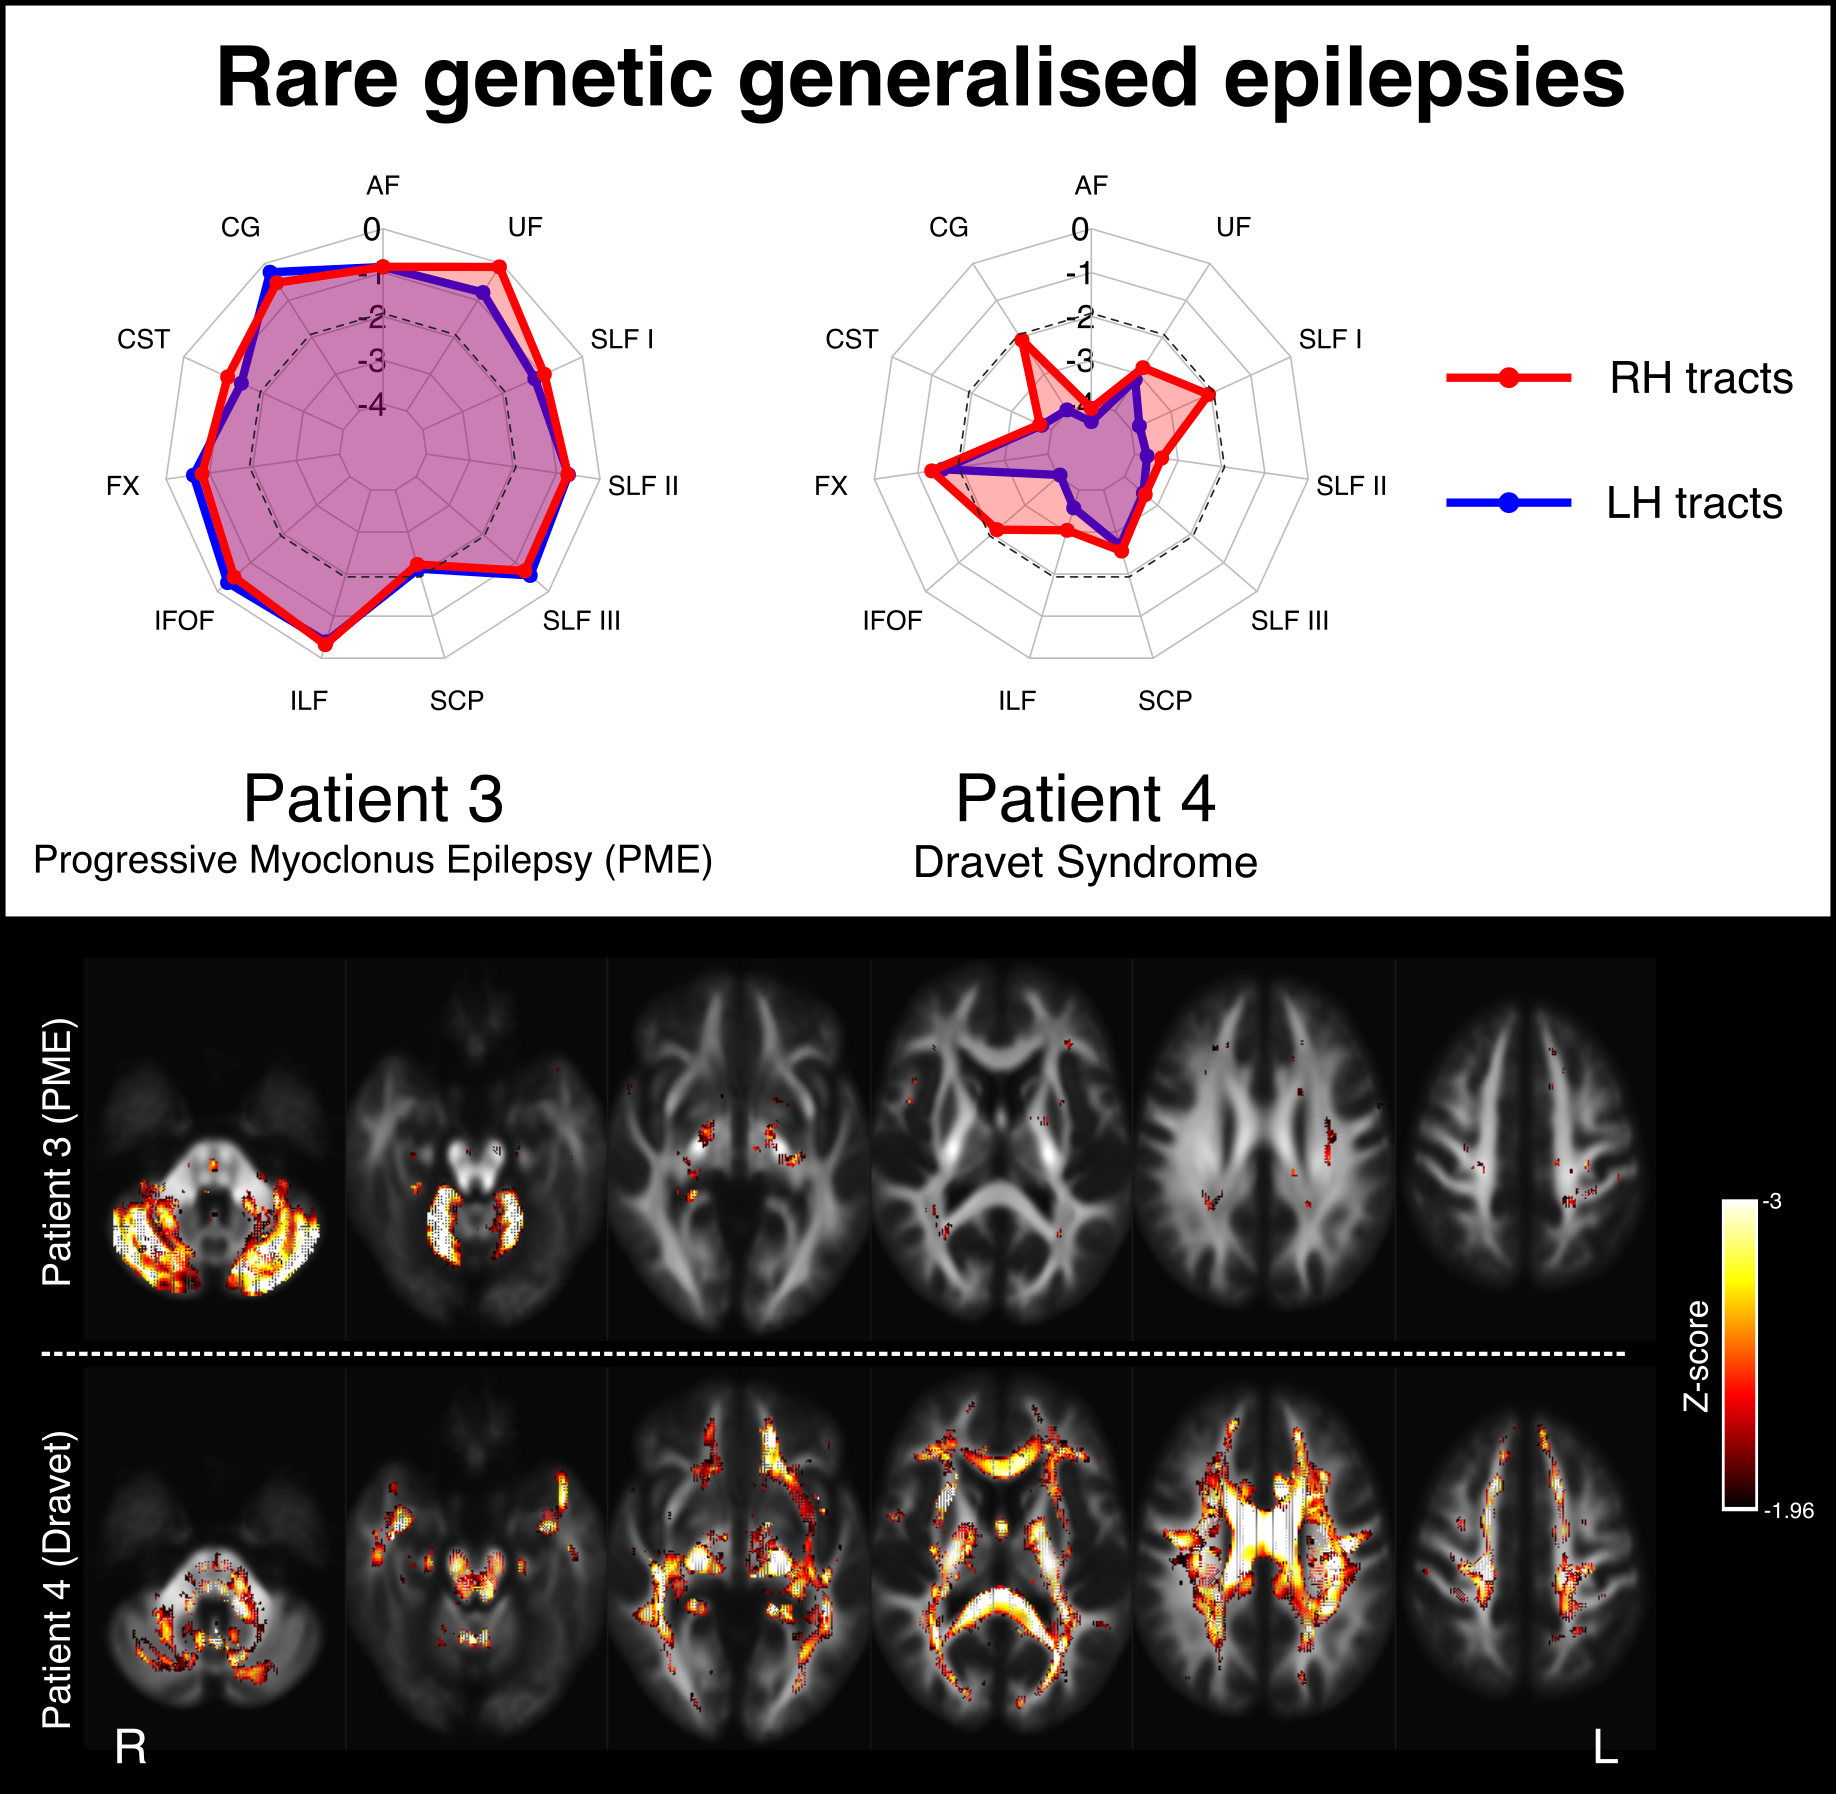
Figure 2 shows two examples of patients with temporal lobe epilepsy (TLE) with hippocampal sclerosis (HS). Patient 1 is a 28yo individual with severe left HS and recurrent focal impaired awareness seizures, who shows marked bilateral reductions in tract FDC, with greater left than right abnormality. This pattern of white matter abnormality can also be observed on whole-brain fixel maps (bottom panel). Patient 2 is a 42yo individual with right HS and focal impaired awareness seizures, who exhibits greater right than left tract abnormality, predominantly in fibre tracts connecting into the medial temporal lobe.Figure 3 shows two examples of patients with genetic generalised epilepsies. Patient 3 is a 30yo individual with progressive myoclonus epilepsy (PME) and relatively preserved cognitive function. This individual shows focal abnormality within the cerebellar white matter, with the superior cerebellar peduncles (SCPs) exhibiting abnormalities bilaterally. Patient 4 is a 27yo individual with Dravet syndrome and intellectual disability, and exhibits widespread abnormality across most white matter tracts.
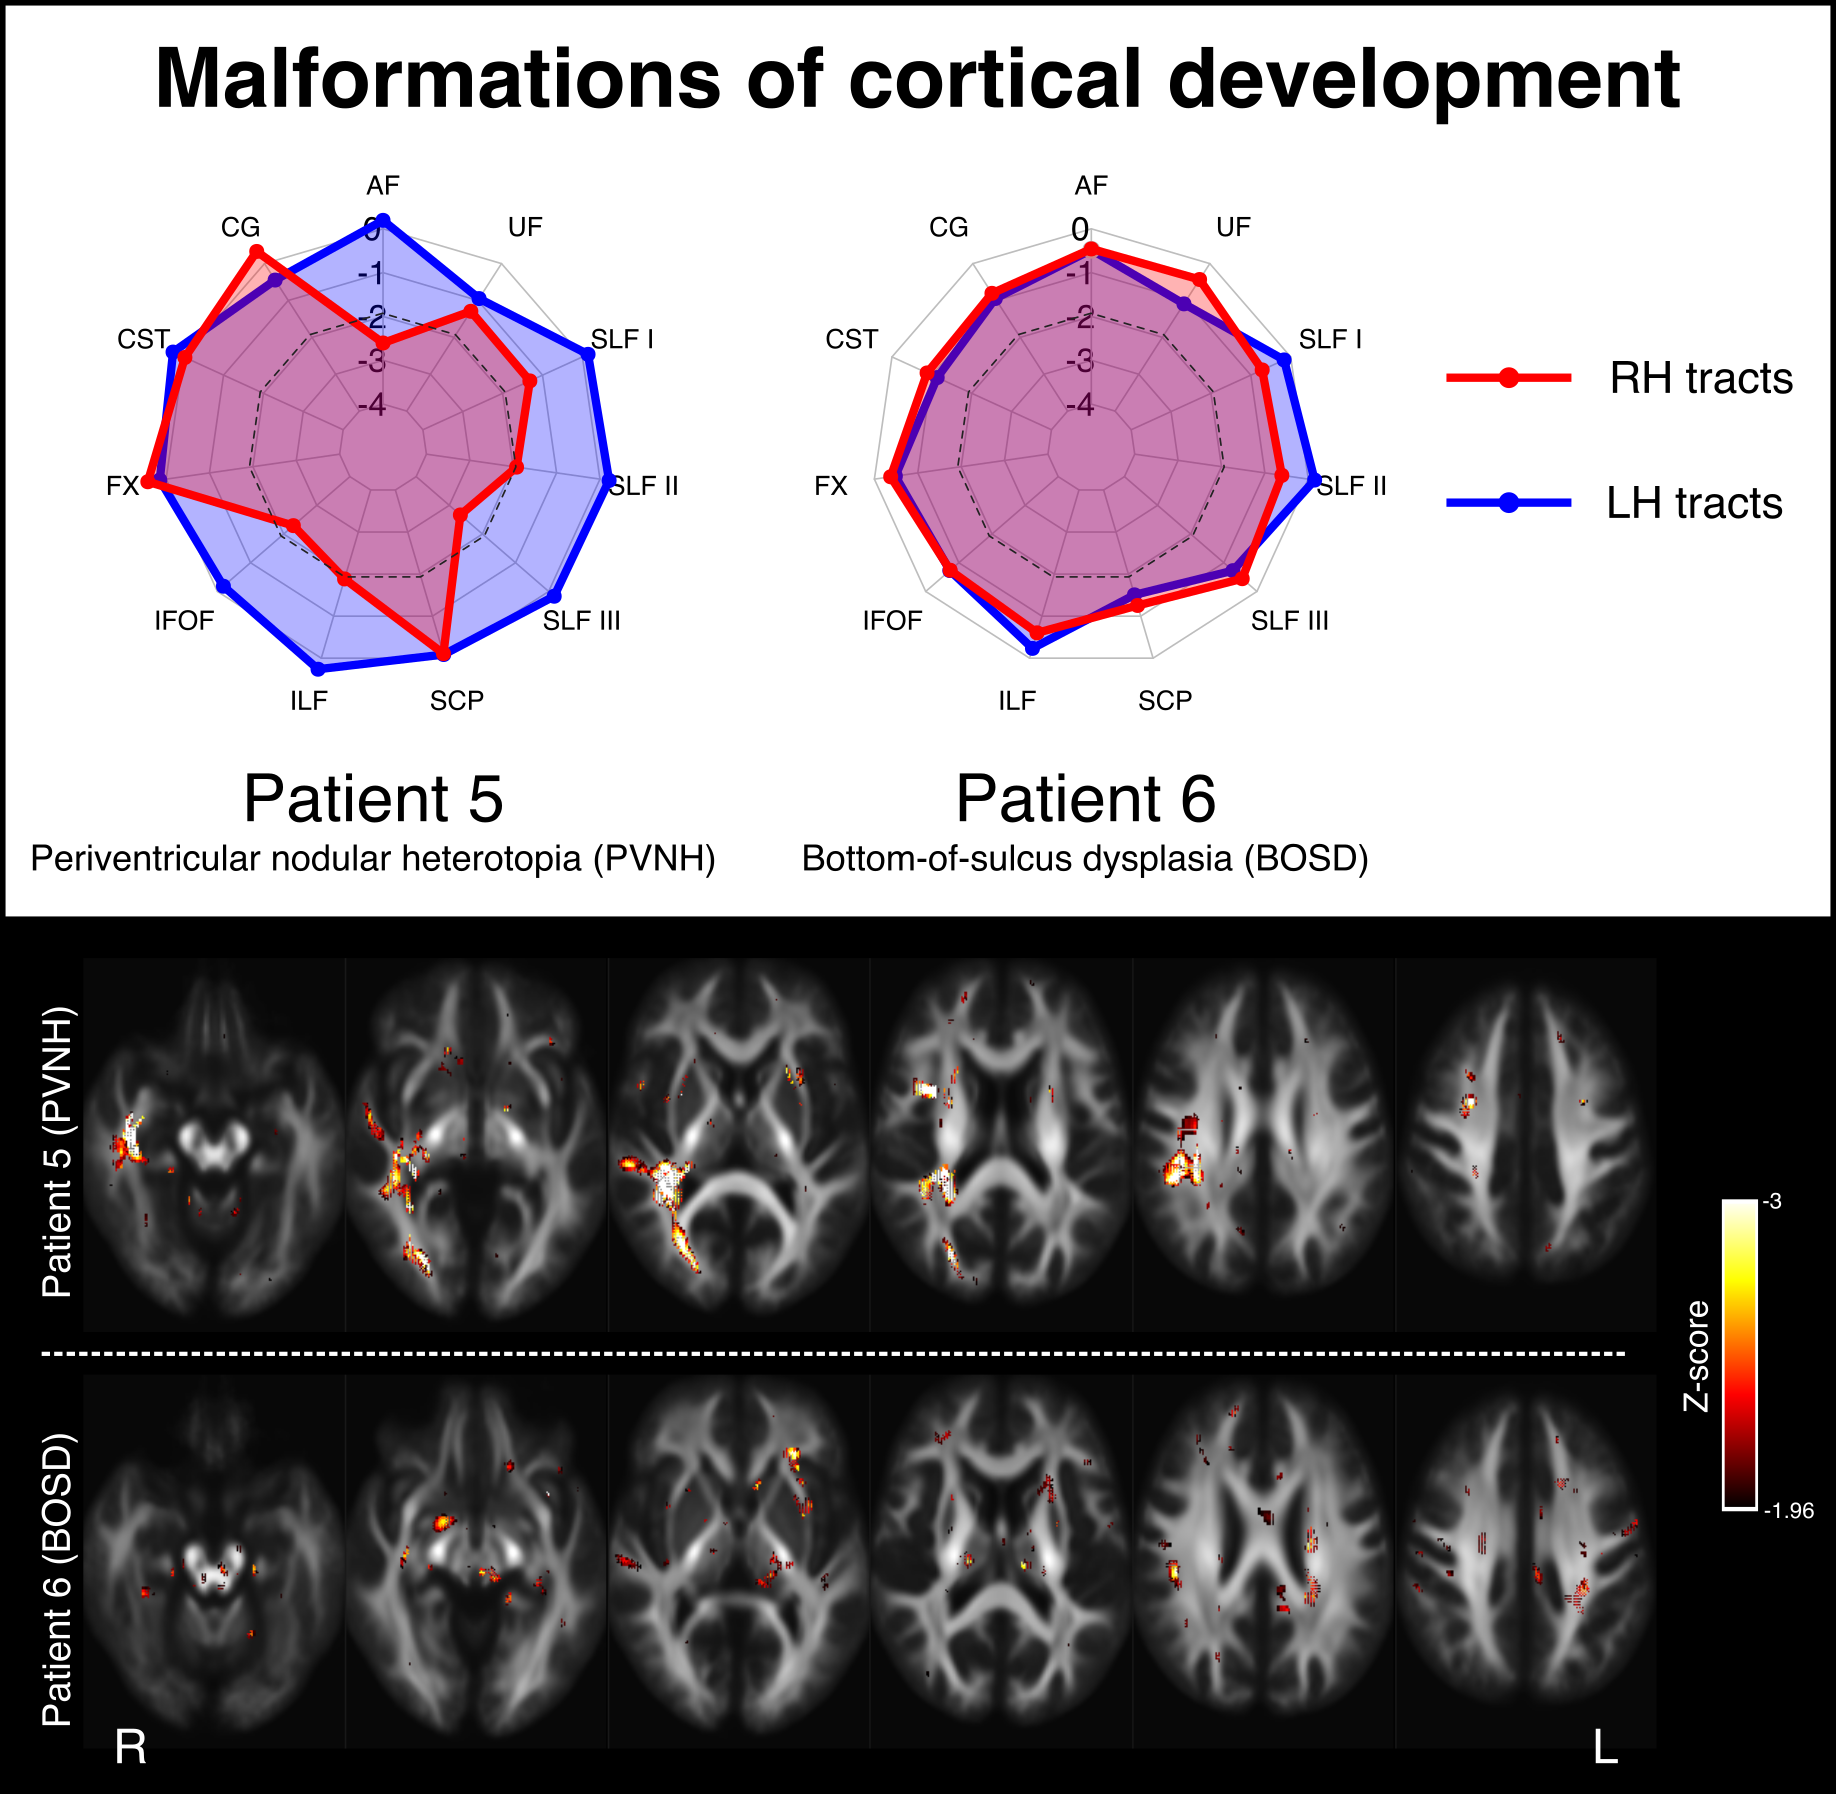
Figure 4 shows two examples of patients with malformations of cortical development. Patient 5 Is a 23yo individual with focal epilepsy due to periventricular nodular heterotopia (PVNH) and polymicrogyria within the right temporal region. This individual has normal intellect but exhibits non-verbal memory deficits. They show little abnormality in their left hemisphere tracts, but notable right temporal white matter abnormality. Patient 5 is a 24yo individual with a subtle right frontal bottom-of-sulcus dysplasia (BOSD), who is cognitively normal and exhibits no obvious white matter tract abnormalities.
Discussion
In this work, we show that tract-specific abnormalities can be detected in individual patients with varying types of epilepsy syndromes. We apply the fixel-based analysis framework to explore specific fibre tracts-of-interest, and subsequently explore fixel-wise Z-score maps to examine specific white matter regions that may be abnormal in individual patients. This information could be clinically valuable when examining individual epilepsy patients, and could take us closer to translating advanced diffusion MRI techniques to clinical practice.Acknowledgements
M.P is supported by an Emerging Grant Fellowship from the Health Research Council, New Zealand. R.S. is supported by fellowship funding from the National Imaging Facility (NIF), an Australian Government National Collaborative Research Infrastructure Strategy (NCRIS) capability.References
1. Vaughan DN, Raffelt D, Curwood E, et al. Tract‐specific atrophy in focal epilepsy: Disease, genetics, or seizures? Ann Neurol. 2017;81(2):240-250.
2. Hatton SN, Huynh KH, Bonilha L, et al. White matter abnormalities across different epilepsy syndromes in adults: an ENIGMA-Epilepsy study. Brain. 2020;143(8):2454-2473.
3. Mito R, Vaughan DN, Semmelroch M, Connelly A, Jackson GD. Bilateral Structural Network Abnormalities in Epilepsy Associated With Bottom-of-Sulcus Dysplasia. Neurology. 2021.
4. Smith R, Parker D, Schneider A, et al. Absence of White Matter Maturation in Dravet Syndrome. In: Organisation for Human Brain Mapping (OHBM); 2019.
5. Lv J, Di Biase M, Cash RFH, et al. Individual deviations from normative models of brain structure in a large cross-sectional schizophrenia cohort. Mol Psychiatry. 2021;26(7):3512-3523.
6. Jolly AE, Bălăeţ M, Azor A, et al. Detecting axonal injury in individual patients after traumatic brain injury. Brain. 2020.
7. Cantor-Rivera D, Baxter JSH, de Ribaupierrre S, et al. Individual feature maps: a patient-specific analysis tool with applications in temporal lobe epilepsy. Int J Comput Assist Radiol Surg. 2016;11(1):53-71.
8. Raffelt DA, Tournier J-D, Smith RE, et al. Investigating white matter fibre density and morphology using fixel-based analysis. NeuroImage. 2017;144:58-73.
9. Tournier J-D, Smith RE, Raffelt DA, et al. MRtrix3: A fast, flexible and open software framework for medical image processing and visualisation. NeuroImage. 2019:551739. doi:10.1101/551739
10. Dhollander T, Connelly A. A novel iterative approach to reap the benefits of multi-tissue CSD from just single-shell (+ b= 0) diffusion MRI data. 24th Int Soc Magn Reson Med. 2016;24:3010.
11. Dhollander T, Raffelt D, Connelly A. Unsupervised 3-tissue response function estimation from single-shell or multi-shell diffusion MR data without a co-registered T1 image. In: ISMRM Workshop on Breaking the Barriers of Diffusion MRI. Vol 5. ISMRM; 2016.
12. Raffelt D, Tournier J-D, Fripp J, Crozier S, Connelly A, Salvado O. Symmetric diffeomorphic registration of fibre orientation distributions. NeuroImage. 2011;56(3):1171-1180.
13. Raffelt DA, Smith RE, Ridgway GR, et al. Connectivity-based fixel enhancement: Whole-brain statistical analysis of diffusion MRI measures in the presence of crossing fibres. NeuroImage. 2015;117:40-55.
14. Fortin J-P, Parker D, Tunç B, et al. Harmonization of multi-site diffusion tensor imaging data. NeuroImage. 2017;161:149-170.
15. Wasserthal J, Neher P, Maier-Hein KH. TractSeg-Fast and accurate white matter tract segmentation. NeuroImage. 2018;183:239-253.
16. Blom G. Statistical estimates and transformed beta-variables. 1958.
Figures