0585
Automatic detection of spatio-temporal patterns of interictal epileptic activity with fMRI
Cristina Tobías1, Eneko Uruñuela1, Vicente Ferrer-Gallardo1, Hannah Goldberg2, Christine Engelman2, Mark Lowe2, Stephen E. Jones2, and César Caballero-Gaudes1
1Signal Processing in Neuroimaging, Basque Center on Cognition Brain and Language, San Sebastián, Spain, 2Imaging Institute, Cleveland Clinic, OH, USA., Cleveland, OH, United States
1Signal Processing in Neuroimaging, Basque Center on Cognition Brain and Language, San Sebastián, Spain, 2Imaging Institute, Cleveland Clinic, OH, USA., Cleveland, OH, United States
Synopsis
We propose a novel methodology to identify spatio-temporal patterns of interictal epileptic activity in refractory epileptic patients using only BOLD functional MRI. It is based on clustering the activity-inducing signal deconvolved from the fMRI data with the Infomap algorithm. The proposed approach was validated on data acquired during a finger tapping task, and evaluated in four epileptic patients scanned at 7T. This method obtained activation maps that were concordant with the results obtained with EEG-informed GLM and MEG-based dipole source localization in 3 out of 4 patients, demonstrating its potential for mapping epileptic activity based only on fMRI data.
Introduction
Simultaneous EEG-fMRI can be used during presurgical examination in drug-resistant epileptic patients to locate the epileptogenic zone area, where conventional EEG-informed fMRI data analyses combine the temporal resolution provided by EEG, used to annotate the timings of such bursts, with the spatial resolution of fMRI1-3. Nonetheless, the detection of epileptic activity from subcortical regions is challenging since it might not propagate through the skull and be recorded on the scalp EEG4-5. Furthermore, the identification of relevant epileptic events on the EEG data often relies on the clinician's manual annotation. Hence, automatic detection of the spatio-temporal patterns of epileptic spikes without using EEG data, i.e., informed by fMRI only6-8, could provide a complementary data-driven manner to identify the epileptogenic focus in refractory epileptic patients. This work proposes a novel framework based on the combination of fMRI deconvolution algorithms, which do not require knowledge of the burst timings, and data-driven clustering to blindly identify spatio-temporal patterns of epileptic activity.Methods
The proposed framework (Fig1) was validated on 2 BOLD fMRI datasets with a finger-tapping paradigm, and then evaluated on 4 drug-resistant epileptic patients scanned on a Siemens-7T MRI scanner using a 32-channel receive transmit coil under a Cleveland Clinic Institutional Review Board approved protocol. Finger-tapping datasets: Two healthy subjects were scanned with a simultaneous multislice EPI sequence (TE=21ms, FOV=192x192mm2, 3x3x3mm3, FA=70º, duration=600s) at TR=500ms and TR=300ms. Paradigm: Ten trials of auditory-cued right index to thumb finger-tapping every 45 s (first 6 trials with a single tap, and then 4 trials involving tapping 10 times quickly) (Fig2). Epileptic datasets: Four drug-resistant epileptic patients were scanned with simultaneous EEG-fMRI (same fMRI parameters as finger-tapping data with TR=500ms). Interictal spikes were marked by a trained epileptologist.FMRI preprocessing: Motion correction with SLOMOCO29, temporal detrending up to 6th-order Legendre polynomials, spatial smoothing (FWHM 5mm), voxelwise normalization to signal percentage change (SPC) with AFNI10. FMRI analysis: Preprocessed data was analyzed with Paradigm Free Mapping (PFM) using stability-selection11, which deconvolves the activity-inducing signal underlying BOLD signal changes. We then computed the spatial Pearson’s correlation among the spatial maps of the positive activity-inducing signal estimated by PFM (considering a temporal window of 5 scans), and binarized the correlation matrix (5% highest positive correlations). Finally, the binary matrix was input to the InfoMap12 algorithm with the two-level option. Evaluation: Results were compared with the activity maps obtained with a conventional General Linear Model (GLM, 3dDeconvolve using the canonical HRF) using the onsets and durations of the finger-tapping events or the annotated epileptic spikes (i.e. EEG-informed fMRI). For the epileptic patients, MEG source localization was done using the standard single equivalent current dipole (SECD) technique in Neuromag XFIT software (Elekta, Stockholm, Sweden).
Results
This approach was able to blindly reveal clusters of activation associated with the finger-tapping events. In figure 2, the results for the finger-tapping dataset with TR=300ms. Among the 23 clusters, the timings of cluster 4 were concordant with the timings of the finger-tapping trials, and the associated map depicts activations in sensorimotor and auditory (Heschl’s gyrus) regions as expected. Some of the other clusters’ maps resemble functional brain networks (e.g. default mode network, visual, dorsal attention), or depict clear random or scattered patterns that can be neglected. These results on the finger-tapping datasets gave us confidence to assess this framework on epileptic datasets.For patient 1 (Fig3), Infomap identified one cluster (#2) showing an activation pattern in occipital and ventral occipito-temporal regions (fusiform gyrus) that overlaps with both EEG-informed GLM and MEG results. In addition, it revealed another cluster (#11) showing activations surrounding the left fusiform, as shown on the MEG-based dipole localization map, which might be related to the propagation of epileptic activity.
The focus for patient 2 was uncertain (Fig4). Infomap found activation patterns resembling the default mode network in the three sessions available for this patient. These clusters are concordant with the results of the EEG-informed GLM, and partially matches the MEG source localization in bilateral parietal regions.
The results for patients 3 and 4 (Fig5) were not so conclusive. In Patient 3, the MEG localized epileptic sources in the anterior temporal lobe, the temporo-perisylvian and the basal temporo-occipital junction (all in the right hemisphere), whereas the EEG-informed GLM also revealed activity in occipital areas. Infomap identified two clusters (#1 in session 1 and #5 in session 2) that also showed activity in perisylvian regions. In Patient 4, the MEG localized the source of the focus in the left frontal lobe. The Infomap detected a cluster with strong involvement of the left frontal lobe, but also involving other regions that were also observed in the EEG-informed GLM.
Conclusion
Our proposed framework for blind, automatic detection of spatio-temporal patterns of epileptic activity using only fMRI data obtained concordant results with EEG-informed GLM and MEG in 3 out of 4 patients. Future work will evaluate the temporal and spatial relevance of additional clusters detected by the Infomap algorithm by means of a re-evaluation of the EEG traces in order to assess their potential relevance in the identification of alternative epileptogenic areas and propagation of epileptic activity.Acknowledgements
The Spanish Ministry of Economy and Competitiveness (Ramon y Cajal Fellowship, RYC-2017- 21845), the Basque Government (BERC 2018-2021 and PIBA_2019_104), the Spanish Ministry of Science, Innovation and Universities (MICINN; PID2019-105520GB-100).References
1. Hamandi, K., Salek-Haddadi, A., Laufs, H., Liston, A., Friston, K., Fish, D. R., ... & Lemieux, L. (2006). EEG–fMRI of idiopathic and secondarily generalized epilepsies. Neuroimage, 31(4), 1700-1710.2. GOTMAN, Jean. Epileptic networks studied with EEG‐fMRI. Epilepsia, 2008, vol. 49, p. 42-51.
3. Caballero-Gaudes, C., Van de Ville, D., Grouiller, F., Thornton, R., Lemieux, L., Seeck, M., ... & Vulliemoz, S. (2013). Mapping interictal epileptic discharges using mutual information between concurrent EEG and fMRI. Neuroimage, 68, 248-262.
4. Ramantani, G., Maillard, L., & Koessler, L. (2016). Correlation of invasive EEG and scalp EEG. Seizure, 41, 196-200
5. Michel, C. M., & He, B. (2019). EEG source localization. Handbook of clinical neurology, 160, 85-101.
6. Lopes, R., Lina, J. M., Fahoum, F., & Gotman, J. (2012). Detection of epileptic activity in fMRI without recording the EEG. Neuroimage, 60(3), 1867-1879.
7. Karahanoğlu, F. I., Grouiller, F., Gaudes, C. C., Seeck, M., Vulliemoz, S., & Van De Ville, D. (2013, April). Spatial mapping of interictal epileptic discharges in fMRI with total activation. In 2013 IEEE 10th International Symposium on Biomedical Imaging (pp. 1500-1503). Ieee.
8. Hunyadi, B., Tousseyn, S., Dupont, P., Van Huffel, S., De Vos, M., & Van Paesschen, W. (2015). A prospective fMRI-based technique for localising the epileptogenic zone in presurgical evaluation of epilepsy. Neuroimage, 113, 329-339.
9. Beall, E. B., & Lowe, M. J. (2014). SimPACE: generating simulated motion corrupted BOLD data with synthetic-navigated acquisition for the development and evaluation of SLOMOCO: a new, highly effective slicewise motion correction. Neuroimage, 101, 21-34.
10. Cox, R. W. (1996). AFNI: software for analysis and visualization of functional magnetic resonance neuroimages. Computers and Biomedical research, 29(3), 162-173.
11. Uruñuela, E., Jones, S., Crawford, A., Shin, W., Oh, S., Lowe, M., & Caballero-Gaudes, C. (2020, July). Stability-Based Sparse Paradigm Free Mapping Algorithm for Deconvolution of Functional MRI Data. In 2020 42nd Annual International Conference of the IEEE Engineering in Medicine & Biology Society (EMBC) (pp. 1092-1095). IEEE.
12. Rosvall, M., Axelsson, D., & Bergstrom, C. T. (2009). The map equation. The European Physical Journal Special Topics, 178(1), 13-23.
Figures
Figure 1: Flowchart of the project with representation of the correlation matrices employed. First, the fMRI data acquired is analyzed with PFM, then the positive events are selected. The correlation matrix is then computed with a temporal window of 5 scans and the top 5% values are binarized. Finally, Infomap is applied.
Figure 2: Results for the finger-tapping dataset with TR=300ms. (A) Time-series for each cluster with the onsets of the single taps (green lines) and multi-taps (orange lines). (B) Infomap cluster 1 depicts the default mode network. (C) Infomap cluster 3 depicts the visual network. (D) Infomap cluster 4 depicts sensory-motor and auditory network activation relevant to the finger-tapping paradigm.
Figure 3: Results for patient 1. (A) EEG-informed GLM (Left) and MEG scanner (Right), (B) InfoMap cluster #2 and (C) InfoMap cluster #11.
Figure 4: Results for patient 2. (A) epileptogenic focus found by the EEG-informed GLM (Left) and the MEG (Right). (B) Infomap cluster #2 in session 1. (C) Infomap cluster #3 in session 2. (D) Infomap cluster #5 in session 3
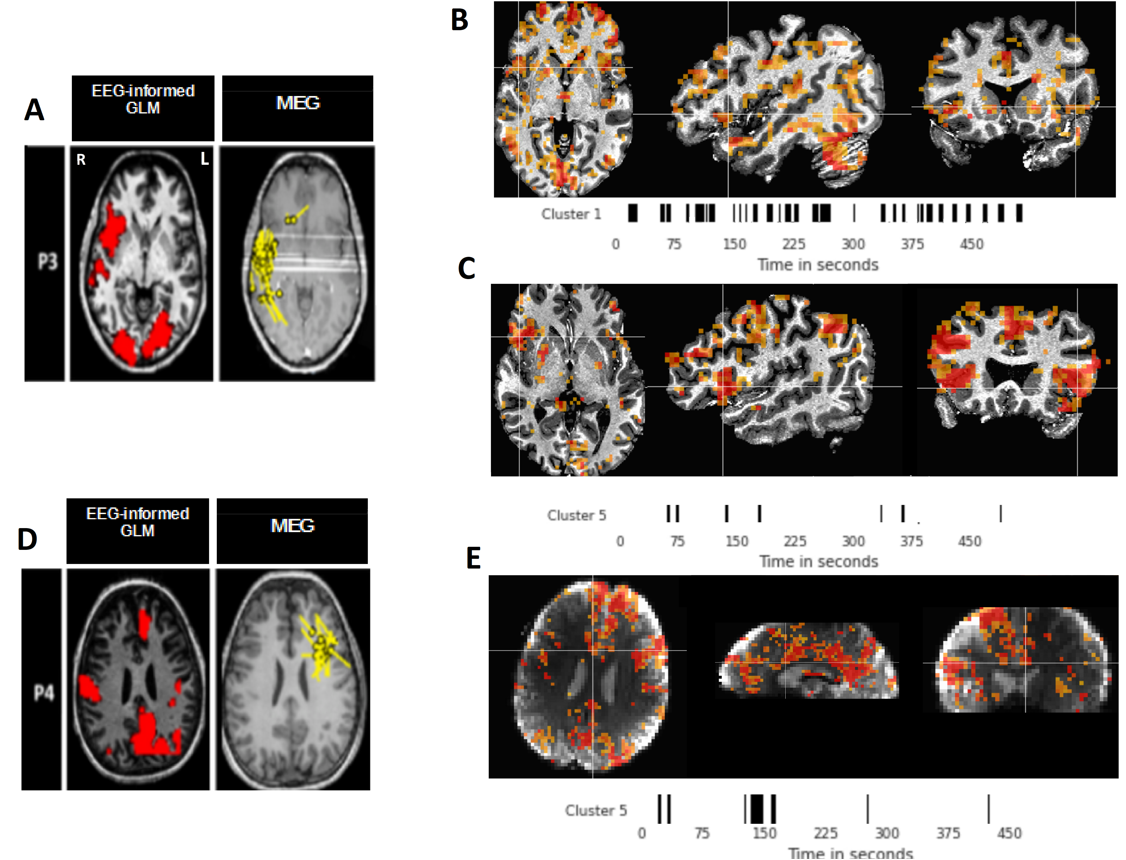
Figure 5: Results for patients 3 and 4. (A) EEG-informed GLM results (Left) and MEG source localization (Right) for patient 3. (B) Infomap cluster #1 session 1 for patient 3. (C) Infomap cluster 5 session 2 for patient 3. (D) epileptogenic focus found by the EEG-informed GLM (Left) and the MEG (Right) for patient 4. (E) Infomap cluster 5 for patient 4.
DOI: https://doi.org/10.58530/2022/0585