0583
Safety Assessment of Custom-Built Multi-Channel RF Coils: EM Modeling Uncertainties1Center for Magnetic Resonance Research (CMRR), University of Minnesota, Minneapolis, MN, United States
Synopsis
Multichannel transmit (Tx) arrays are essential for ultra-high fields. In the absence of commercial options, such arrays must be built in-house. Prior to human imaging, however, safe operations limits for specific absorption rate (SAR) must be established. This is done using EM simulations, the accuracy of which has to be verified by comparing measured and simulated data. Unfortunately, EM simulations may not fully represent experimental conditions, especially for complex transmitter designs. In this work, we propose a numerical approach to determine uncertainties encountered in EM modeling that allows the determination of safe operation limits despite EM modeling errors.
Introduction
Local specific absorption rate (SAR) is a patient safety parameter that needs to be adhered to in MRI scans. However, SAR predictions are subject to errors caused by uncertainties in power monitoring and EM modeling1 which will not exactly match experimental performance. In addition, local SAR is highly dependent on the subject, therefore inter-subject variability also needs to be considered while investigating uncertainties in SAR predictions2-4. While the inter-subject variability of local SAR and uncertainties related to EM modeling have been investigated in previous studies2-6, the latter’s limitation is that assessment of SAR through MR-thermometry studies is required.In this study, we propose a new method to quantify the uncertainty in EM modeling, specifically for peak 10g-averaged SAR (pSAR10g) evaluation without the need to interrogate SAR experimentally. The proposed approach propagates the quantitative differences between measured and simulated B1-maps to find an upper bound for pSAR10g error. As an example, we calculated the EM modeling uncertainty for a custom-built 8-channel TxRx coil7-8, which was used to scale up the simulated SAR of the coil and demonstrate that the method yields overestimated SAR values for arbitrary RF excitation scenarios tested in an RF safety lab. In addition, we calculated the EM modeling uncertainty and the safety factor for a custom-built 16Ch-Tx/32Ch-Rx head coil9,10 at 10.5T and safely acquired in-vivo images of the human head.
Theory
Safety factor (SF) is critical for accounting for uncertainties in pSAR induced in a patient. SF is used to scale up the predicted pSAR and scale down the input power level to ensure patient safety11.$$\begin{array}{*{20}{c}}{SF=1+{e_{SAR}}}&{(1)}\end{array}$$
As previously proposed1,6, three sources of uncertainty should be considered for SAR analysis, namely, power monitoring uncertainty ($$${e_{PM}}$$$), inter-subject variability ($$${e_{ISV}}$$$), and EM modeling uncertainty ($$${e_{EMM}}$$$). These three can be combined with a sum-of-squares approach to calculate the uncertainty in the pSAR prediction6.
$$\begin{array}{*{20}{c}}{{e_{SAR}}^2={e_{PM}}^2+{e_{ISV}}^2+{e_{EMM}}^2}&{(2)}\end{array}$$To quantify $$${e_{EMM}}$$$, we propose to propagate the error between simulated and measured B1-maps to calculate the uncertainty in the pSAR prediction. For this purpose, we perform a three-step process using the simulation model of the TxArray coil:
- We calculate the normalized root-mean-square error (NRMSE0) to quantify the differences between the B1-maps corresponding to an excitation mode (i.e., mode-of-interest (MOI0)).
- We perform Monte-Carlo simulations (N-many; i=1:N); In each simulation, we slightly perturb the amplitude and phase of each channel’s excitation signal such that the total excitation remains within the vicinity of the MOI0 (i.e., NRMSEi ≤ NRMSE0).
- We generate a histogram of the differences between the pSARi values (outcomes of Monte-Carlo simulations) and the pSAR0 (corresponding to the MOI0). We determine the $$${e_{EMM}}$$$ as the upper-bound in the histogram such that it contains 99% of perturbed modes.
Methods
We acquired the experimental and numerical B1-maps of the 8Ch-TxRx array7 with four excitation modes: CP, linear, zero phase-difference, and a random excitation mode. Consequently, the highest $$${e_{EMM}}$$$ among the four modes was determined as the $$${e_{EMM}}$$$ value.The experimental SAR data (previously acquired at eight temperature probe locations with this coil7) for three arbitrary excitation patterns was compared to simulated SAR data scaled with (1+$$${e_{EMM}}$$$). This comparison enabled us to evaluate the safety buffer gained as a result of applying the proposed approach.
For the 16Ch-Tx/32Ch-Rx array9,10, a CP-like mode was used for B1-map acquisition and to calculate the $$${e_{EMM}}$$$ value. Using a previously proposed $$${e_{ISV}}$$$ value3 and the $$${e_{PM}}$$$ reported by the manufacturer (i.e., power measurement uncertainty of the directional couplers), we calculated the SF as summarized in Eq.1. The SF was then used to scale the VOPs12 (obtained from EM simulations with Duke model) for in-vivo imaging.
Results
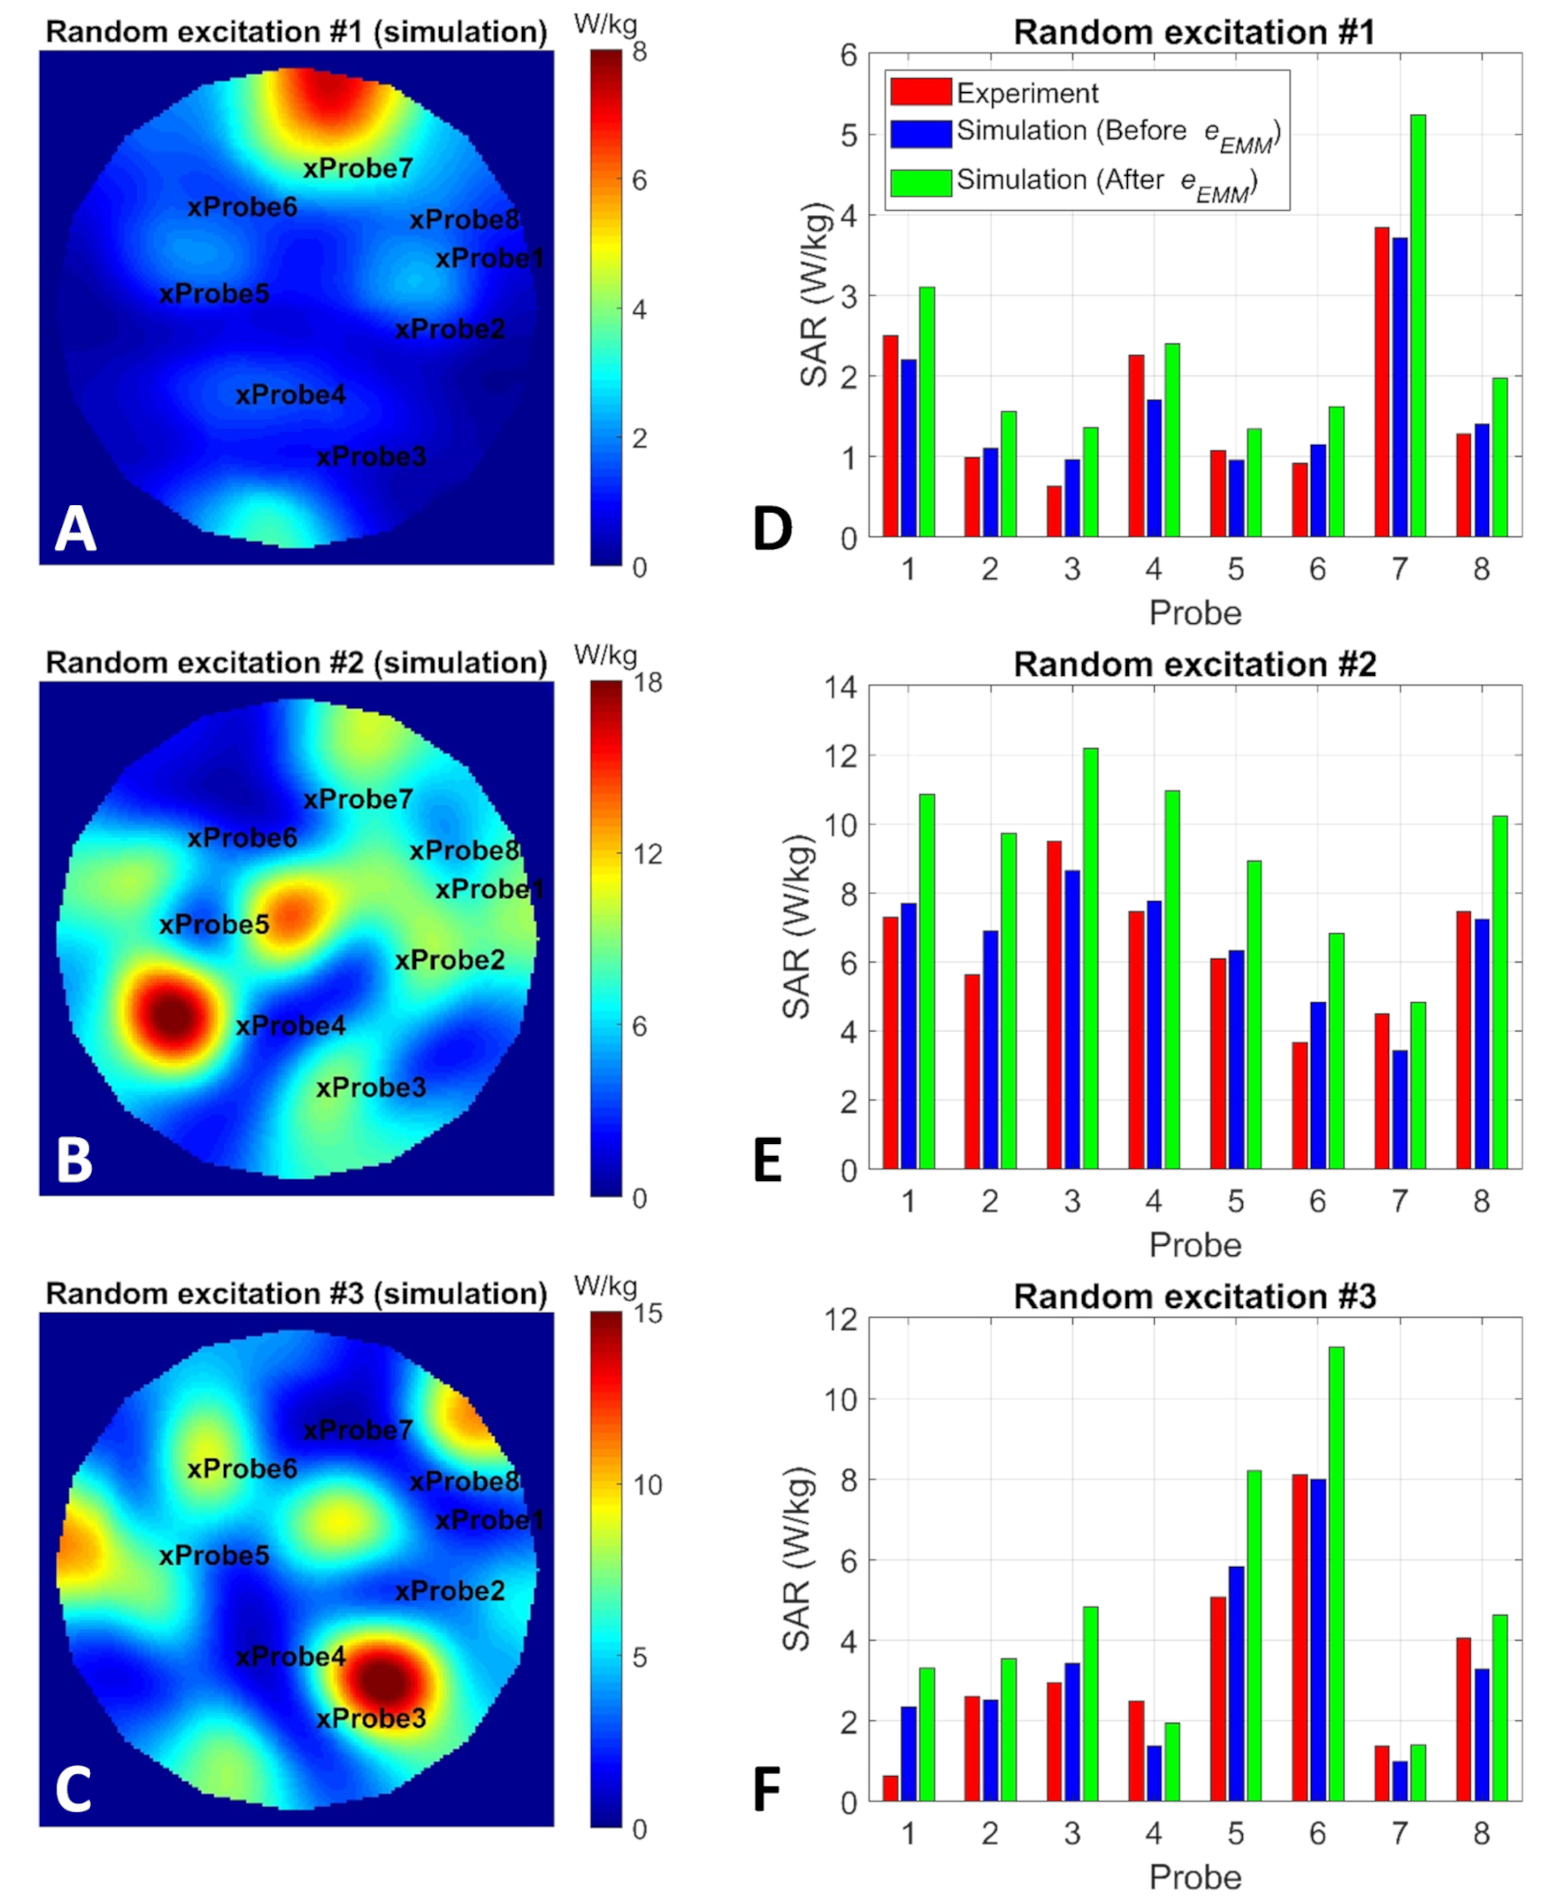
Fig. 2 shows the B1-maps and histogram of the propagated SAR error around four excitation modes of the eight-channel coil. The $$${e_{EMM}}$$$ for this coil was determined as 41%, which is the highest $$${e_{EMM}}$$$ among the four excitation modes.Fig. 3A-C shows the simulated SAR10g distributions corresponding to three arbitrary excitations. The red and blue bars in Fig. 3D-F show the measured and simulated SAR10g values at locations of eight temperature probes. Also, the simulated values were scaled by a factor of (1+$$${e_{EMM}}$$$) =1.41 and presented as green bars.
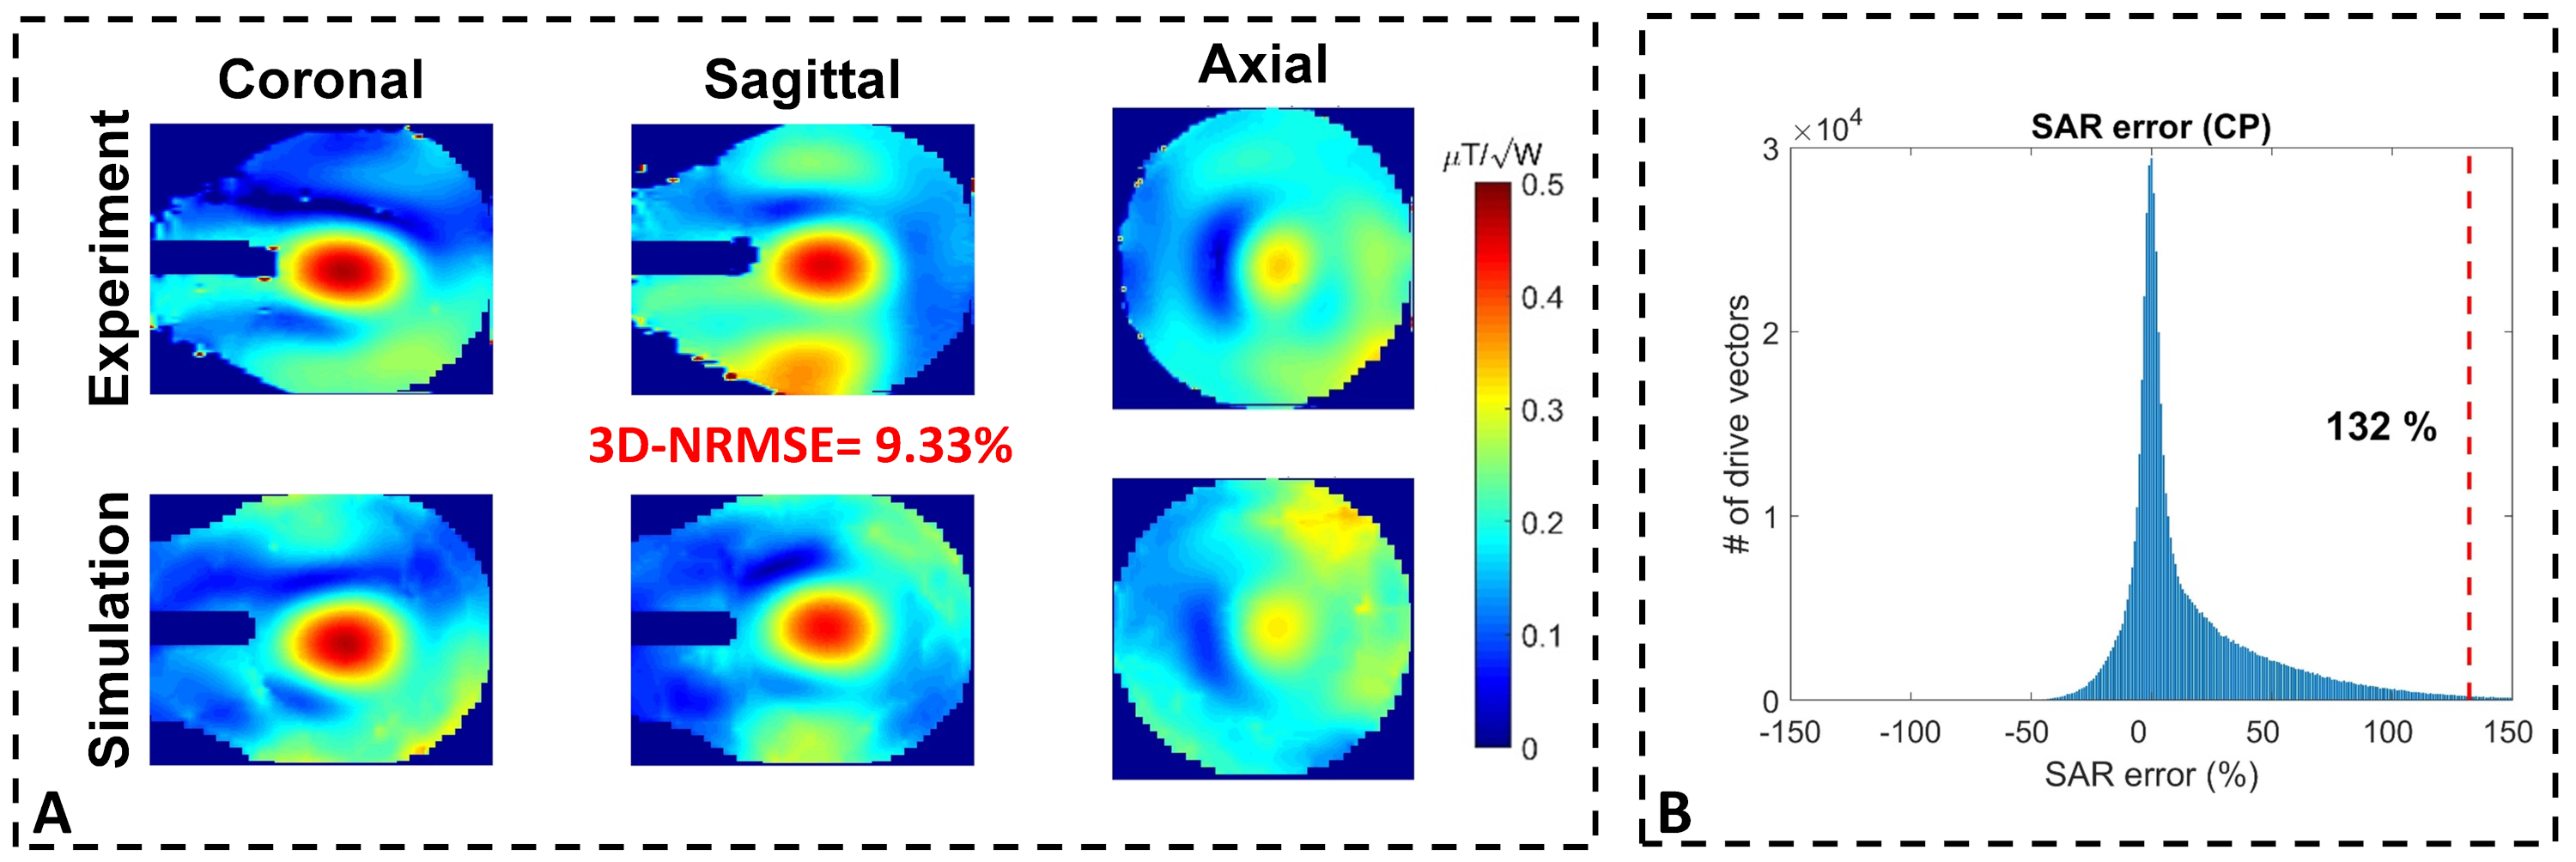
Fig. 4 shows the B1-maps (CP-like) and histogram of the propagated SAR error around CP-like mode for the 16-channel coil. The $$${e_{EMM}}$$$ for this coil was calculated as %132, which yielded an SF of 2.4, assuming an $$${e_{ISV}}$$$ value3 of 50% and an $$${e_{PM}}$$$ value of 15%.
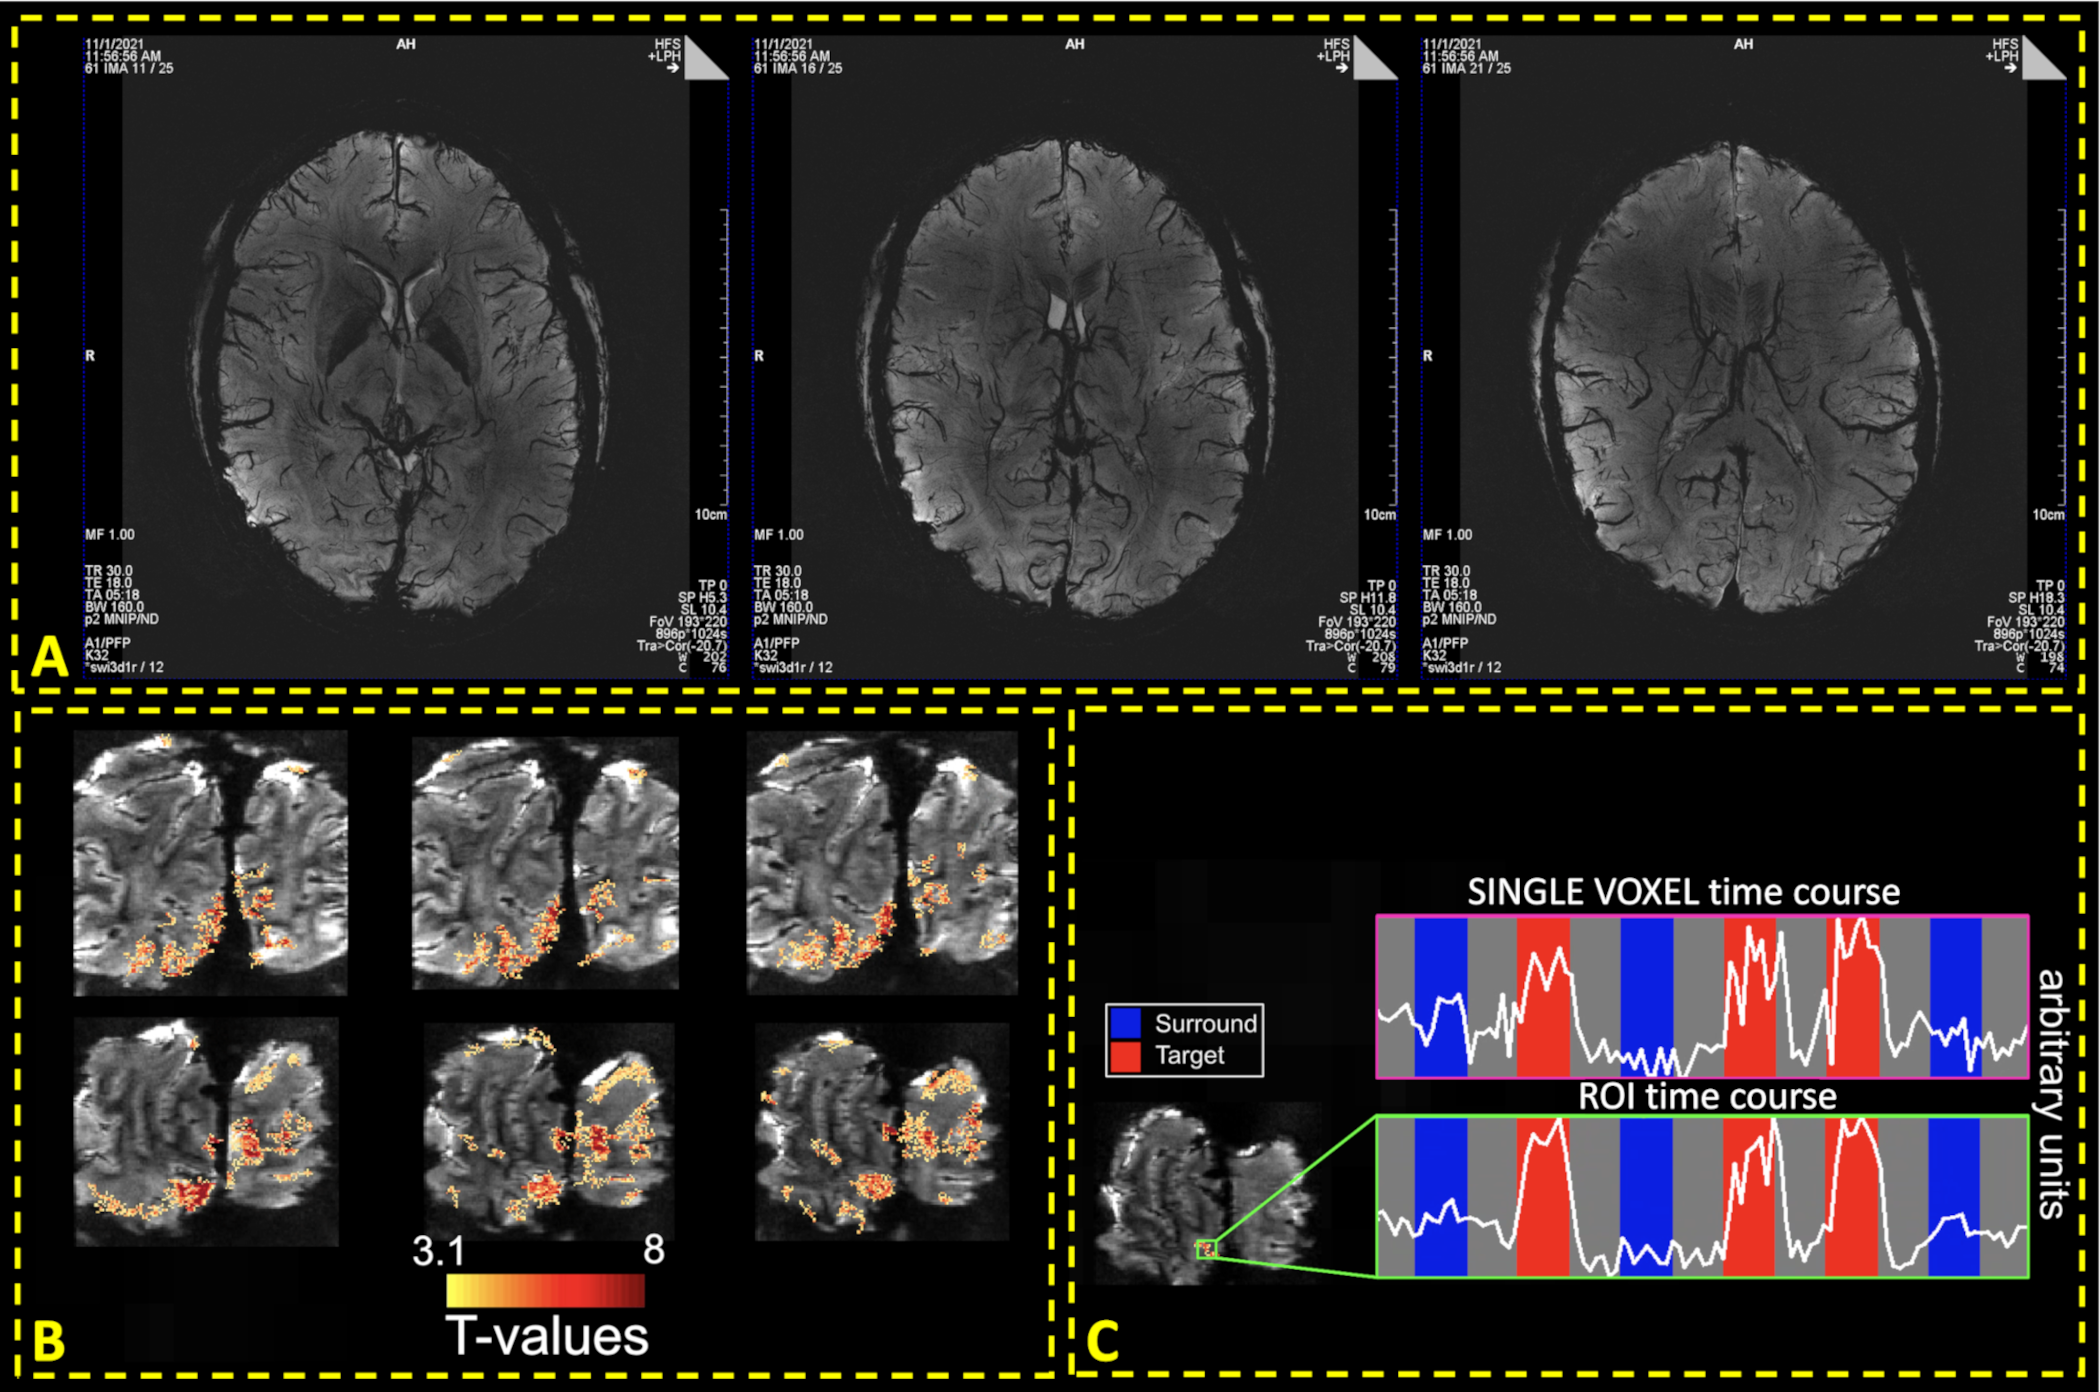
Fig. 5A shows susceptibility-weighted images with 0.21×0.21×1.3mm3 resolution, and Fig. 5B-C shows isotropic 0.5mm3-fMRI (processed with NORDIC denoising13,14).
Discussion
We investigated EM modeling uncertainties and developed a strategy to handle them with a simulation-based analysis. A finite number of excitation modes were investigated, and the SAR errors were statistically calculated in the vicinity of those modes using Monte-Carlo simulations. SAR uncertainty calculations are dependent on the particular modes that are analyzed. This dependency needs to be investigated in detail to ensure the fidelity of the results.Conclusion
We proposed a new numerical approach to determine the EM modeling uncertainties for multi-channel transmit coils. The approach was applied to an 8Ch-TxRx and a 16Ch-Tx/32Ch-Rx array, where the latter was used to acquire in-vivo human head images at 10.5T.Acknowledgements
This work was supported by the following grants: NIBIB P41 EB027061 and NIH U01 EB025144.
References
1. Boulant N, Gras V, Amadon A, et al. Workflow proposal for defining SAR safety margins in parallel transmission. InProceedings of the 26th annual ISMRM meeting 2018 Jun 16 (p. 0295).
2. de Greef M, Ipek O, Raaijmakers AJ, et al. Specific absorption rate intersubject variability in 7T parallel transmit MRI of the head. Magnetic Resonance in Medicine. 2013 May;69(5):1476-85.
3. Le Garrec M, Gras V, Hang MF, et al. Probabilistic analysis of the specific absorption rate intersubject variability safety factor in parallel transmission MRI. Magnetic resonance in medicine. 2017 Sep;78(3):1217-23.
4. Shao Y, Zeng P, Wang S. Statistical simulation of SAR variability with geometric and tissue property changes by using the unscented transform. Magnetic resonance in medicine. 2015 Jun;73(6):2357-62.
5. Ferrand G, Luong M, Amadon A, Boulant N. Mathematical tools to define SAR margins for phased array coil in-vivo applications given E-field uncertainties. In Proceedings of the International Society of Magnetic Resonance in Medicine. 2015.
6. Steensma B, Luijten P, Klomp D, et al. Tier based formalism for RF safety assessment of custom-built RF coils providing flexibility in the tradeoff between effort and overestimation. In: Proceedings of the 2021 ISMRM & SMRT Annual Meeting & Exhibition, 2021. p 4193.
7. Sadeghi‐Tarakameh A, DelaBarre L, Lagore RL, et al. In vivo human head MRI at 10.5 T: A radiofrequency safety study and preliminary imaging results. Magnetic resonance in medicine. 2020 Jul;84(1):484-96.
8. Sadeghi-Tarakameh A, Torrado-Carvajal A, Lagore RL, et al. Toward human head imaging at 10.5 T using an eight-channel transmit/receive array of bumped fractionated dipoles. In: Proceedings of the 27th Annual Meeting of ISMRM, Montreal, QC, Canada, 2019. p 0430.
9. Adriany G, Radder J, Tavaf N, et al. Evaluation of a 16-channel transmitter for head imaging at 10.5 T. In 2019 International Conference on Electromagnetics in Advanced Applications (ICEAA) 2019 Sep 9 (pp. 1171-1174). IEEE.
10. Tavaf N, Lagore RL, Jungst S, et al. A self‐decoupled 32‐channel receive array for human‐brain MRI at 10.5 T. Magnetic resonance in medicine. 2021 Mar 29.
11. IEC. Medical electrical equipment. Part 2-33: particular requirements for the safety of magnetic resonance equipment for medical diagnosis. IEC 60601-2-33. 2015.
12. Eichfelder G, Gebhardt M. Local specific absorption rate control for parallel transmission by virtual observation points. Magnetic resonance in medicine. 2011 Nov;66(5):1468-76.
13. Moeller S, Pisharady PK, Ramanna S, et al. NOise Reduction with DIstribution Corrected (NORDIC) PCA in dMRI with complex-valued parameter-free locally low-rank processing. NeuroImage. 2021 Feb 1;226:117539.
14. Vizioli L, Moeller S, Dowdle L, et al. Lowering the thermal noise barrier in functional brain mapping with magnetic resonance imaging. Nature communications. 2021 Aug 30;12(1):1-5.
Figures
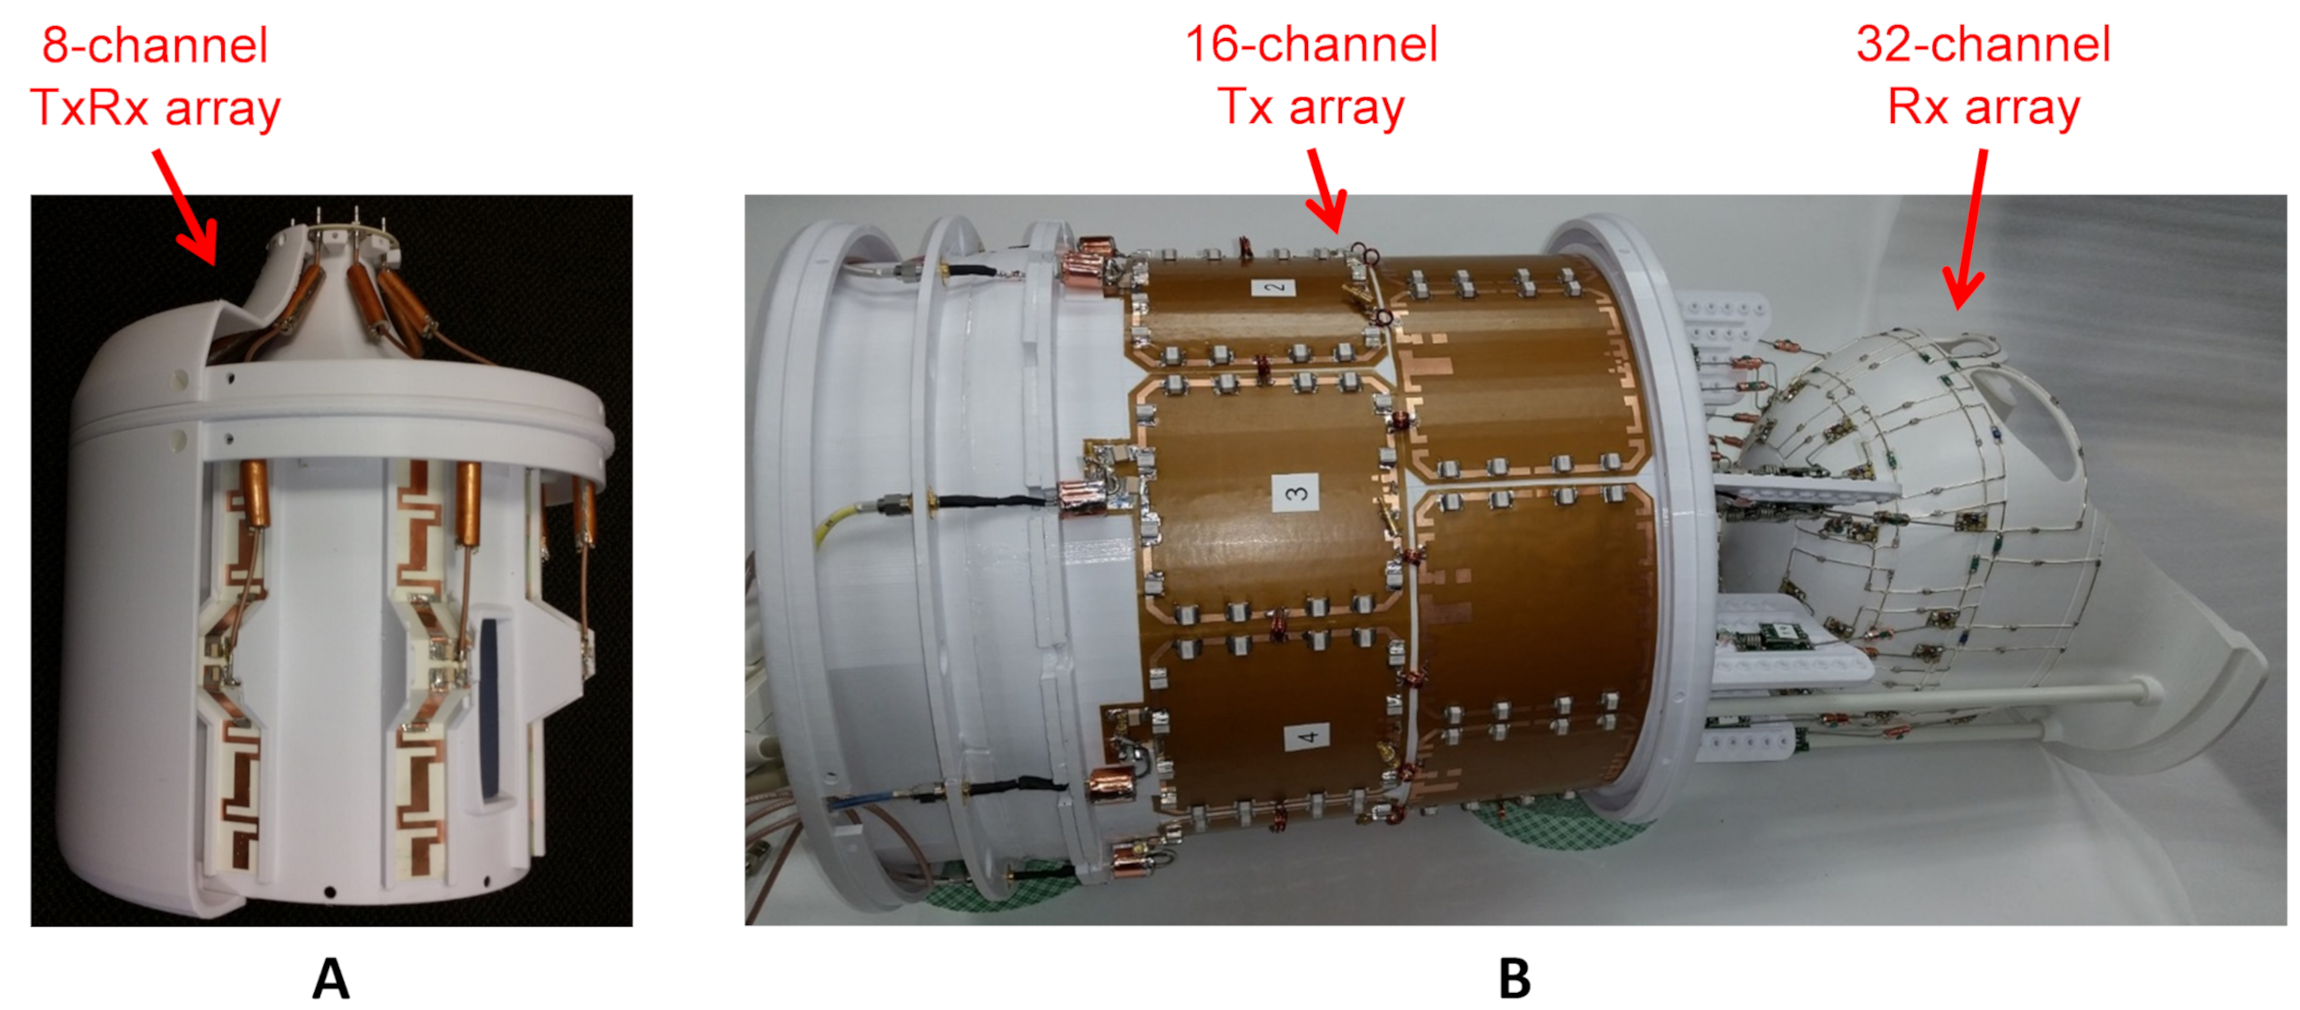
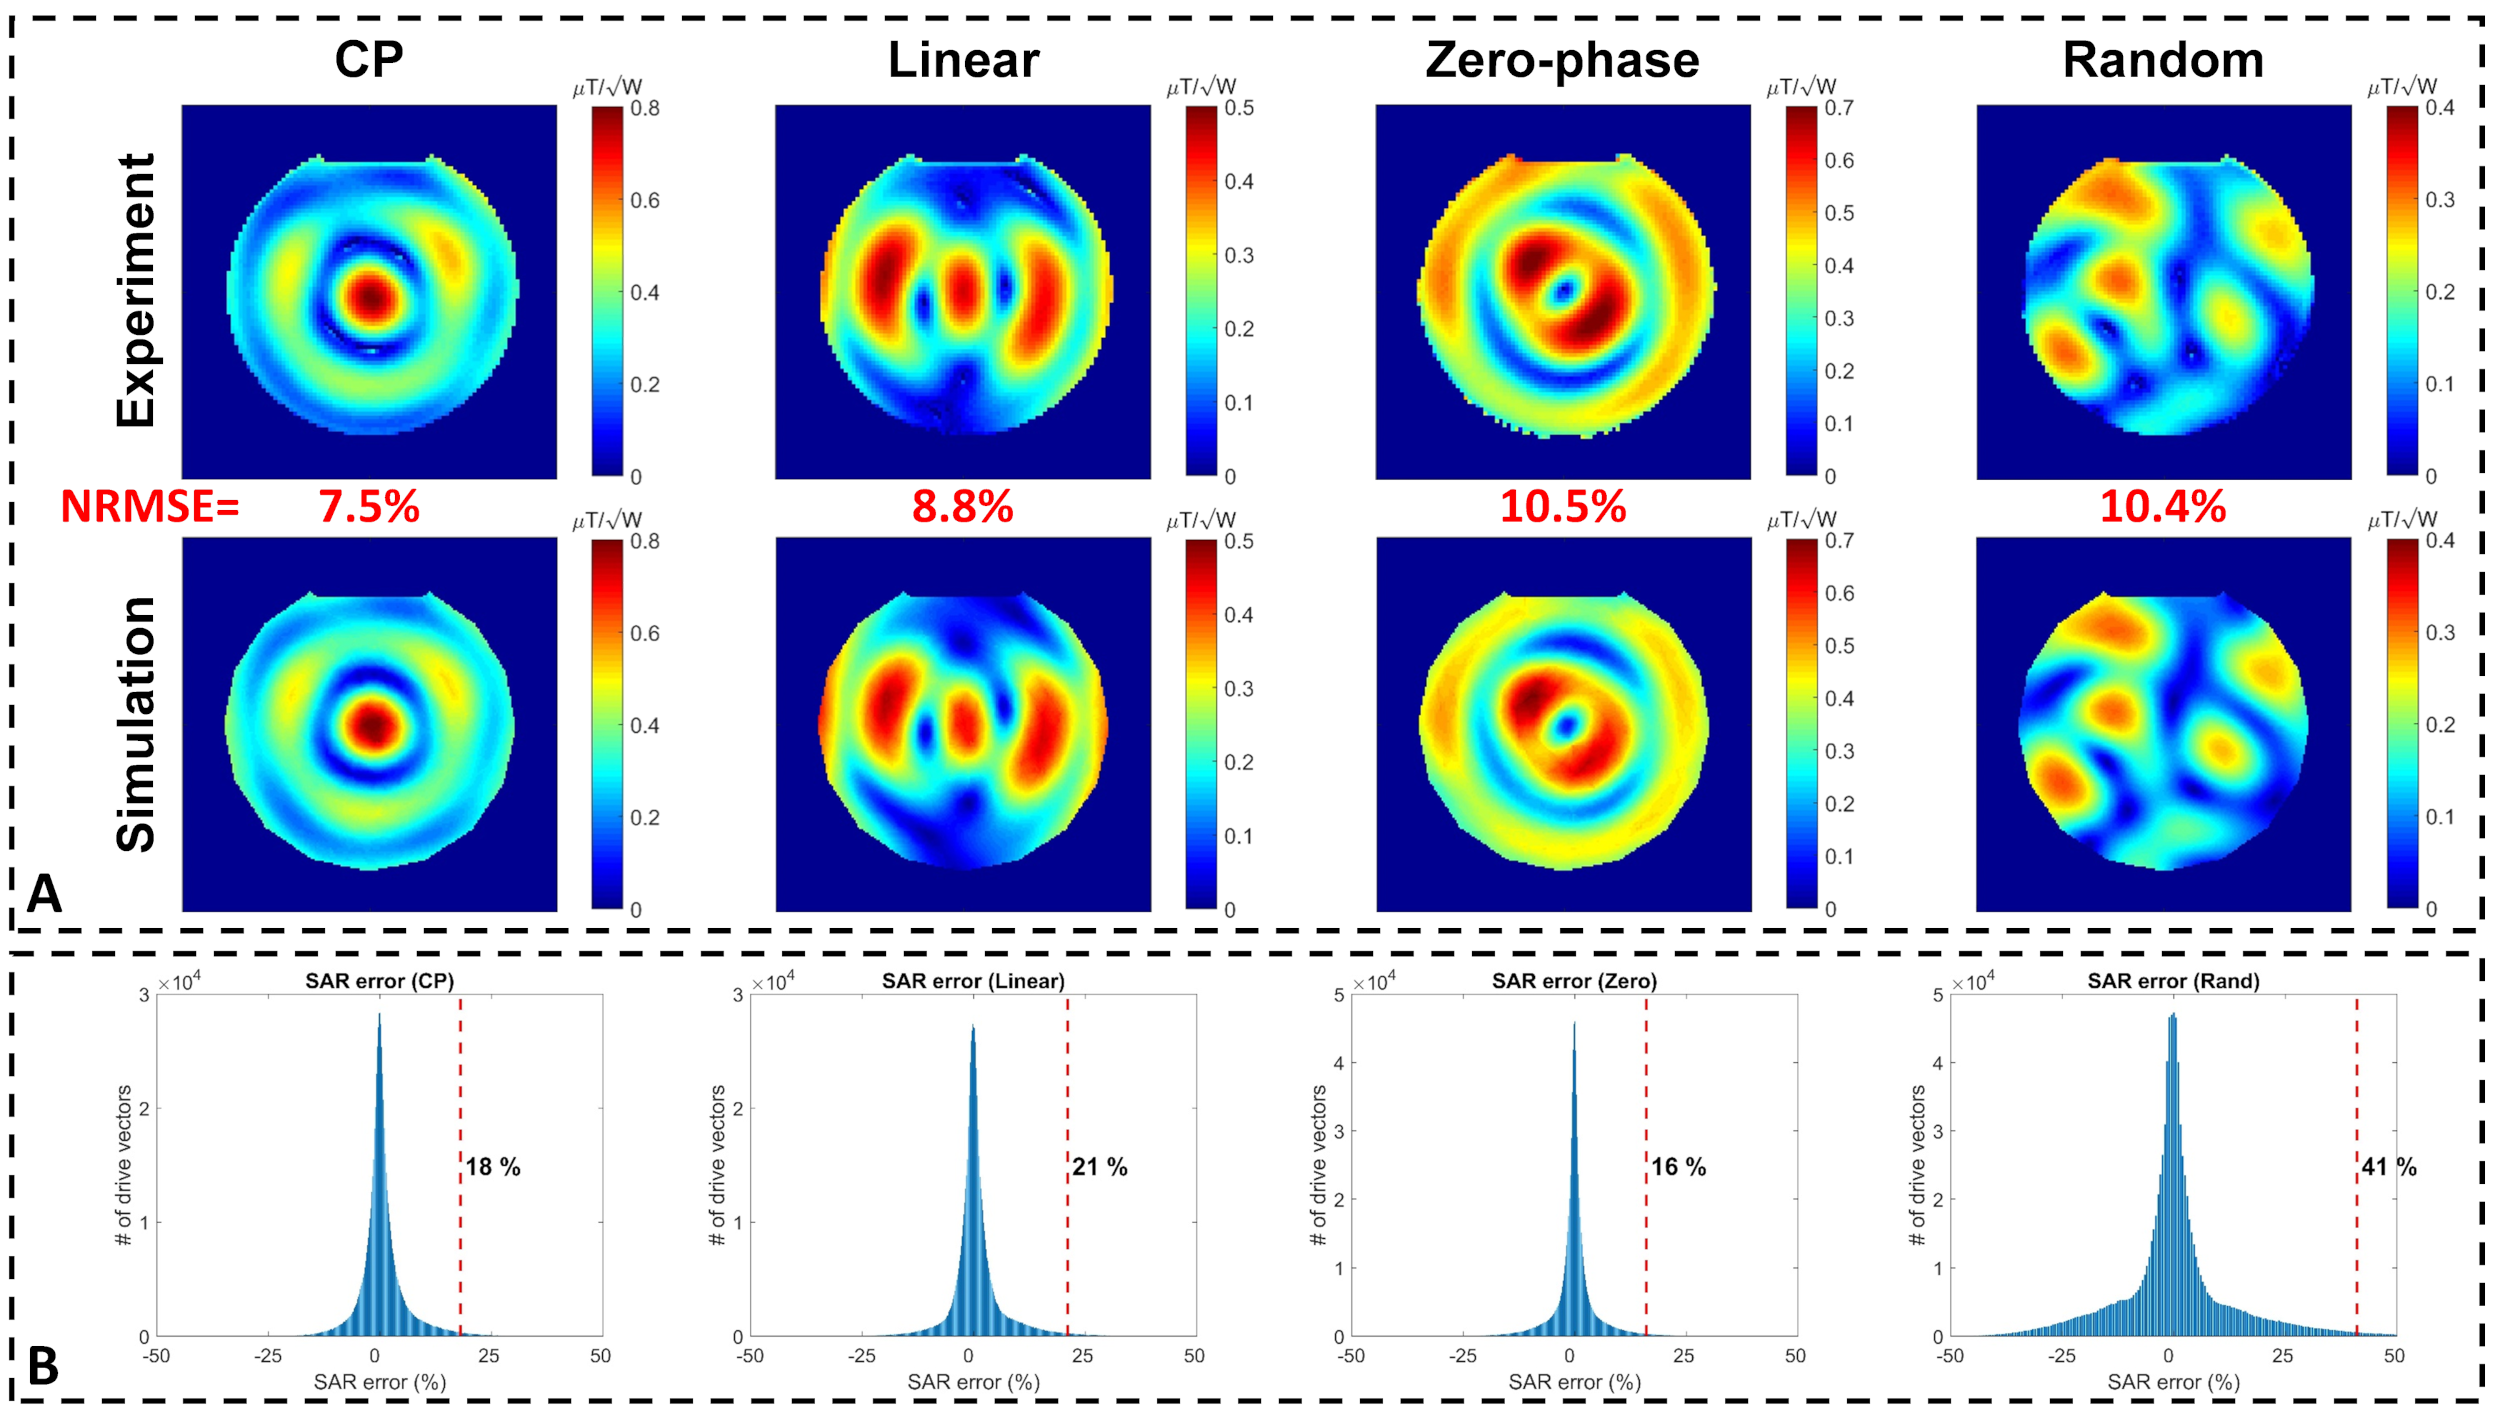
Figure 2. Propagation of the error between the measured and simulated B1-maps to calculate the uncertainty in the pSAR prediction for the eight-channel coil. A jar-shaped uniform phantom filled with a gel consisting of 14g/L hydroxyethyl cellulose and 2.9g/L NaCl with electrical properties of εr=78 and σ =0.5S/m was used. (A) Measured and simulated B1-maps corresponding to four different excitation modes. (B) Histograms of the SAR errors (i.e., outcomes of 106 Monte-Carlo simulations) in the vicinity of each mode.