0581
Measurement of cardiac magnetostimulation thresholds in pigs1Computer Assisted Clinical Medicine, Medical Faculty Mannheim, Heidelberg University, Germany, Mannheim, Germany, 2Department of Radiology, Massachusetts General Hospital, A. A. Martinos Center for Biomedical Imaging, Charlestown, MA, United States, 3Harvard Medical School, Boston, MA, United States, 4Cardiovascular Research Center, Cardiology Division, Massachusetts General Hospital, Charlestown, MA, United States, 5Harvard-MIT Division of Health Sciences and Technology, Cambridge, MA, United States
Synopsis
We measured cardiac magnetostimulation thresholds in ten healthy pigs by discharging a 220-µF capacitor into a flat spiral coil placed close to the pigs’ torso. We used MR Dixon images to locate the porcine heart and determine the relative coil position to calculate the B-field in the heart (Biot-Savart). The average threshold for cardiac magnetostimulation during diastole was dB/dt≈1570±320 T/s at the center of the heart. This value is >10X greater than the IEC 60601-2-33 cardiac dB/dt limit for the effective stimulus duration of the magnetic stimulator system used in the experiments (0.45 ms).
Purpose
The IEC 60601-2-33 guidelines define safety limits to protect patients from cardiac stimulation (CS) by MRI gradients[1]. High-amplitude gradient systems such as the Connectome can reach dB/dt values above the IEC limit at long rise times (>1.5 ms)[2]. Thus, the conservative nature of the cardiac limit is starting to impact MRI operation in addition to the more commonly limiting PNS thresholds. The IEC cardiac limit was based on an E-field strength-duration curve[3] assuming the same rheobase as for large peripheral nerves (6 V/m)[4, 5]. This assumption was based on a single experiment that reported a similar current density threshold for the heart[6] as simulated for a 20-µm nerve with a neurodynamic model[4]. These E-field thresholds were converted to dB/dt values using simulations of a homogeneous, ellipsoidal torso model[4, 5], which ignores the effect of E-field hotspots induced by heterogeneous tissue distribution.Methods
We measured cardiac magnetostimulation thresholds in ten healthy pigs by discharging a capacitor into a spiral coil close to the porcine heart. Biot-Savart calculations allowed us to estimate the B-field (and dB/dt) in the porcine heart at threshold.Magnetic stimulator: We constructed a magnetic stimulator[7] consisting of a 220-µF capacitor bank (HVP, Martinsried, Germany) charged with a high-voltage DC power supply (TDK-Lambda, Tokyo, Japan) at Umax=18 kV. The capacitors were discharged into a spiral coil (total system inductance L=235 µH, RAC=95 mΩ), generating a damped 700-Hz sinusoidal B-field waveform with maximum B-field magnitude Bmax=5.6T and dB/dtmax=26.7kT/s at coil center at an effective stimulus duration of ts,eff=0.45ms (as defined by the IEC[1]).
CS threshold measurements: The study was conducted under a protocol approved by the MGH Institutional Animal Care and Use Committee. Ten pigs (seven male, 20-35 kg) were intubated, ventilated, anesthetized (1-3% isoflurane), and placed on their left side on a fiberglass table with the coil mounted underneath approximately centered below the pigs’ heart. Non-invasive blood pressure, blood oxygenation, and single-lead ECG measurements were acquired continuously during the experiments. A muscle relaxant (vecuronium bromide, 0.5mg/kg) was administered every 20min to suppress motion caused by skeletal muscle stimulation. The stimulation pulse was applied either during early (immediately after the T-wave) or late (immediately before the P-wave) diastole. The stimulus amplitude was increased in steps of ~250V until CS was visually observed on the physiological traces. CS thresholds were then determined from sigmoid fits of the binary cardiac response as a function of charging voltage (Fig. 1B).
MR image acquisition: Dixon images (FOV=500x325x344mm3, resolution=2x2x2mm3, TR/TE1/TE2=5.00/1.23/2.46ms) were acquired in eight of the pigs after the stimulation experiments on a 3T Connectome scanner (Siemens Healthineers, Erlangen, Germany). These allowed us to determine the location of the porcine hearts with respect to the coil using fiducials on the fiberglass table and calculate B-field and dB/dt values at the center of the porcine heart.
For comparison, we computed maximum dB/dt values expected from three commercial MRI gradient systems (Siemens Sonata (Gmax=40 mT/m, Smax=200 T/m/s), Quantum (Gmax=40 mT/m, Smax=140 T/m/s), and Connectome (Gmax=300 mT/m, Smax=200 T/m/s)) at ts,eff=0.45 ms at the heart center of the male Zygote human body model (American Fork, UT, USA) placed with head or heart at isocenter.
Results
Figure 2 shows physiological traces measured in pig #6. At 5250V, the magnetic pulse caused cardiac capture, i.e., depolarization of the myocardium causing contraction and blocking anterograde conduction of the native sinus beat. In pig #4, a single premature ventricular contraction (PVC) was seen following the captured beat, but only with stimulation pulses >7500V (Fig. 3).Figure 4 summarizes all CS thresholds measured during diastole. In pig #5, thresholds were measured for stimuli applied during systole as well as diastole (Fig. 5). Stimulation was only achieved during diastole, and the ventricles remained, as expected, refractory during systole[4, 8].
The three axes of the investigated gradient systems achieved maximum dB/dt values in the heart of 13-23 T/s (head at isocenter) and 1-2 T/s (heart at isocenter) for ts,eff=0.45 ms when confined to their respective Gmax/Smax limits.
Discussion
This study is, to the best of our knowledge, the first measurement of cardiac magnetostimulation thresholds in pigs, a model integral to most current cardiovascular research[9] (previous experiments were conducted in dogs[10, 11]). We found dB/dt thresholds (mean±standard deviation) of 1570±320 T/s (early diastole) and 1610±240 T/s (late diastole) for a damped sinusoidal B-field waveform with an effective stimulus duration ts,eff=0.45 ms. The magnetic pulses did not induce serious cardiac arrhythmias such as ventricular fibrillation, and only a single PVC was induced in one pig at voltages >7500V.The measured thresholds are >10X greater than the IEC dB/dt safety limit at ts,eff=0.45 ms (dB/dtIEC=144 T/s[1]), and >50X greater than the dB/dt values generated by the investigated gradient systems at this stimulus duration. However, dB/dt at a single stimulus duration is an insufficient surrogate for CS, since stimulation is caused by E-field changes along the excitable cardiac fibers[12], and the cardiac rheobase and chronaxie must be known to fully characterize all stimulus durations. Future work will include a more detailed comparison of porcine and human thresholds using detailed E-field simulations coupled with electrophysiological models of excitable cardiac tissue using a recently developed modeling framework[12].
Acknowledgements
This study was in part supported by the ISMRM Research Exchange Grant and the German Academic Exchange Service (DAAD) as well as NIH award number R01 EB028250.References
[1] International Electrotechnical Commission (IEC). International standard IEC 60601 medical electrical equipment. Part 2-33: Particular requirements for the basic safety and essential performance of magnetic resonance equipment for medical diagnosis. 2010.
[2] Setsompop K, Kimmlingen R, Eberlein E, Witzel T, Cohen-Adad J, McNab J A, Keil B, Tisdall M D, Hoecht P, Dietz P, Caluey S F, Tountcheva V, Matschl V, Lenz V H, Heberlein K, Potthast A, Thein H, Van Horn J, Toga A, Schmitt F, Lehne D, Rosen B R, Wedeen V, and Wald L L, Pushing the limits of in vivo diffusion MRI for the Human Connectome Project. NeuroImage, 2013. 80: 220-233.
[3] Blair HA, On the intensity-time relations for stimulation by electric currents I. J. Gen. Physiol., 1932. 15(6): 709-729.
[4] Reilly JP, Principles of nerve and heart excitation by time-varying magnetic fields. Ann. N. Y. Acad. Sci., 1992. 649: 96-117.
[5] Reilly JP, Magnetic field excitation of peripheral nerves and the heart: A comparison of thresholds. Med. Biol. Eng. Comput., 1991. 29: 571-579.
[6] Roy OZ, Summary of cardiac fibrillation thresholds for 60 Hz currents and voltages applied directly to the heart. Med. Biol. Eng. Comput., 1980. 18: 657-659.
[7] Klein V, Davids M, Straney D, Vendramini L, Schad LR, van den Boomen M, Nguyen C, Wald LL, and Guérin B. Device and simulation workflow for validating cardiac magneto-stimulation thresholds in porcine models. In: Proceedings of the 28th Annual Meeting of the ISMRM. 2021. p. 2477.
[8] Yamaguchi M, Andoh T, Goto T, Hosono A, Kawakami T, Okumura F, Takenaka T, and Yamamoto I, Effects of strong pulsed magnetic fields on the cardiac activity of an open chest dog. IEEE Trans. Biomed. Eng., 1994. 41(12): 1188-1191.
[9] Dixon JA and Spinale FG, Large animal models of heart failure. Circ., 2009. 2(3): 262-271.
[10] Mouchawar GA, Bourland JD, Nyenhuis JA, Geddes LA, Foster KS, Jones JT, and Graber GP, Closed-chest cardiac stimulation with a pulsed magnetic field. Med. Biol. Eng. Comput., 1992. 30: 162-168.
[11] Nyenhuis JA, Bourland JD, Schaefer DJ, Foster KS, Schoelein WE, Mouchawar GA, Elabbady TZ, Geddes LA, and Riehl ME. Measurement of cardiac stimulation thresholds for pulsed z-gradient fields in a 1.5-T magnet. In: Proceedings of the 11th Annual Meeting of the SMRM. 1992. Berlin, Germany; p. 586.
[12] Klein V, Davids M, Schad LR, Wald LL, and Guérin B, Investigating cardiac stimulation limits of MRI gradient coils using electromagnetic and electrophysiological simulations in human and canine body models. Magn. Reson. Med., 2021. 85: 1047–1061.
Figures
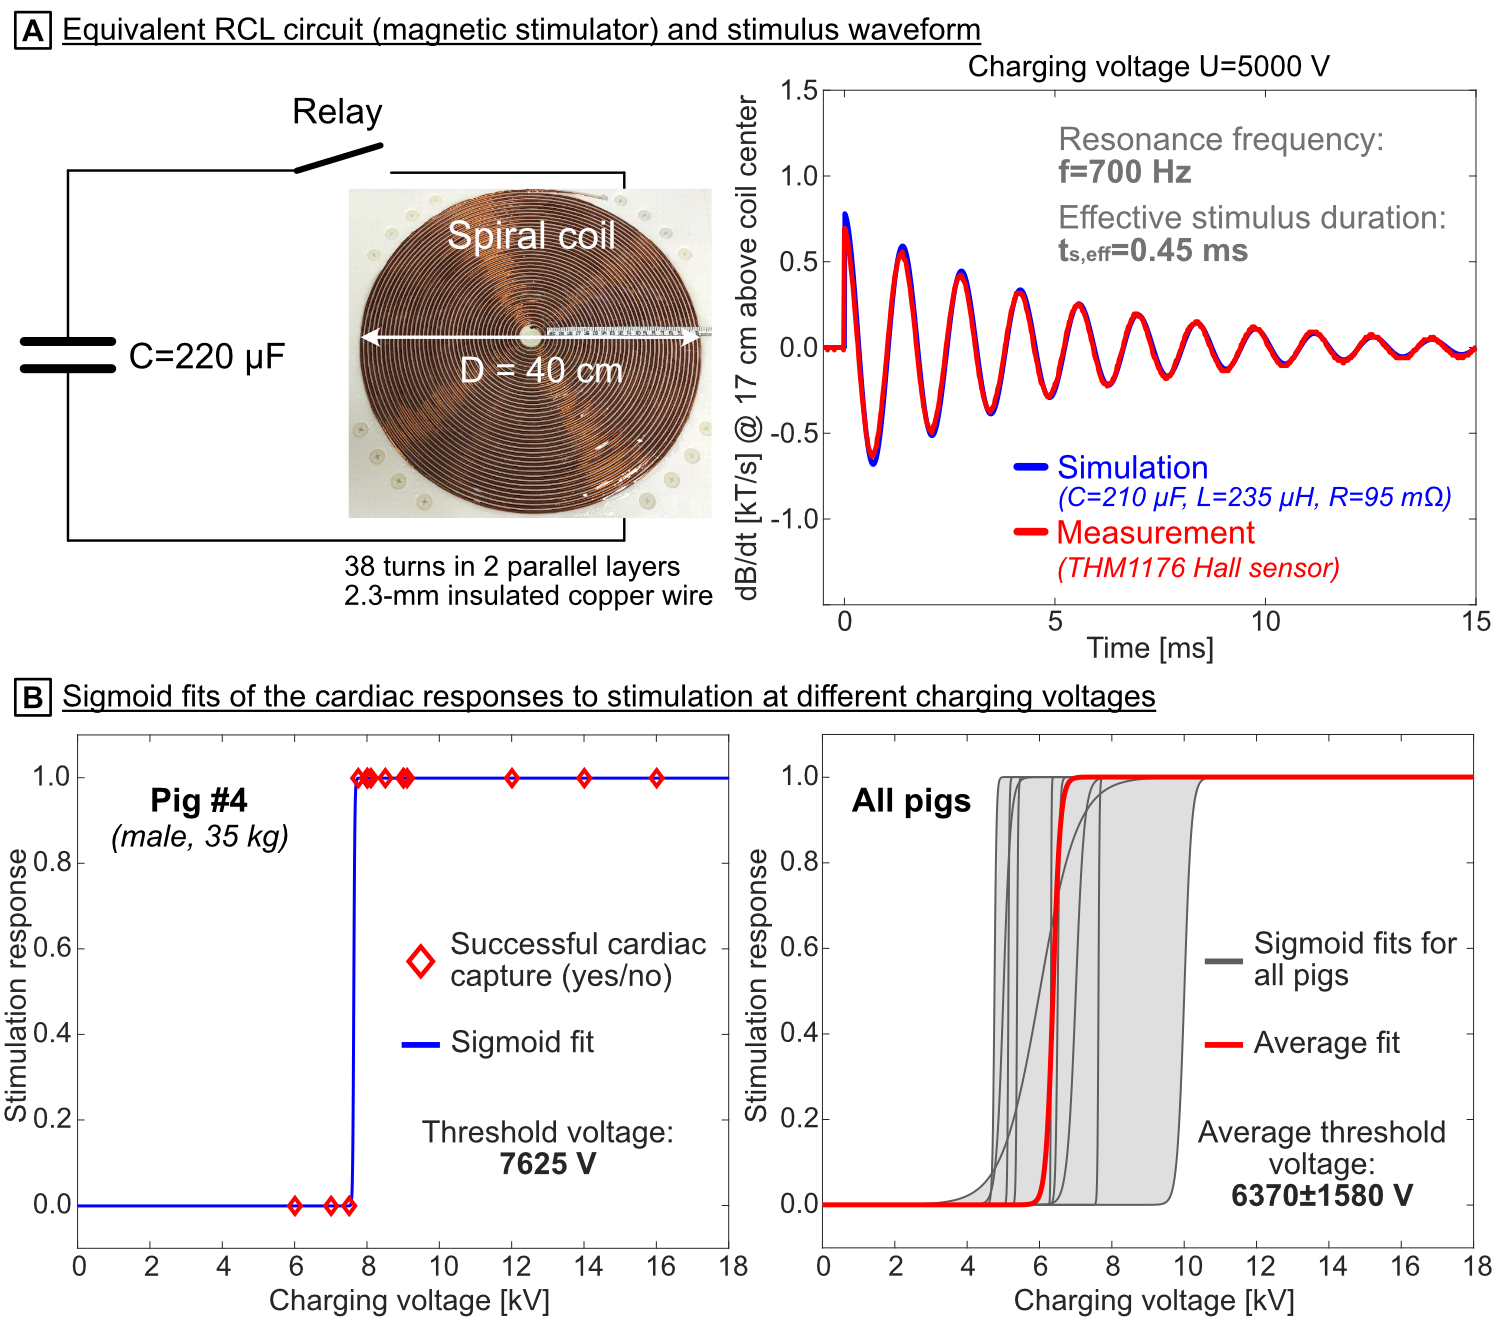
Figure 1: (A) Left: Equivalent RCL circuit of the magnetic stimulator consisting of a 220-µF capacitor, a high-voltage relay, and a flat spiral coil (Dout=40 cm, Din=2.5 cm). Right: Damped sinusoidal dB/dt waveform measured and simulated at U=5000 V. The effective stimulus duration (IEC definition[1]) is ts,eff≈0.45 ms. (B) Cardiac response (capture or no capture) versus charging voltage curves with fitted sigmoid functions for stimulation measurements during early ventricular diastole for pig #4 (left, Uthresh≈7625 V) and for all ten pigs (right, average Uthresh≈6370±1580 V).
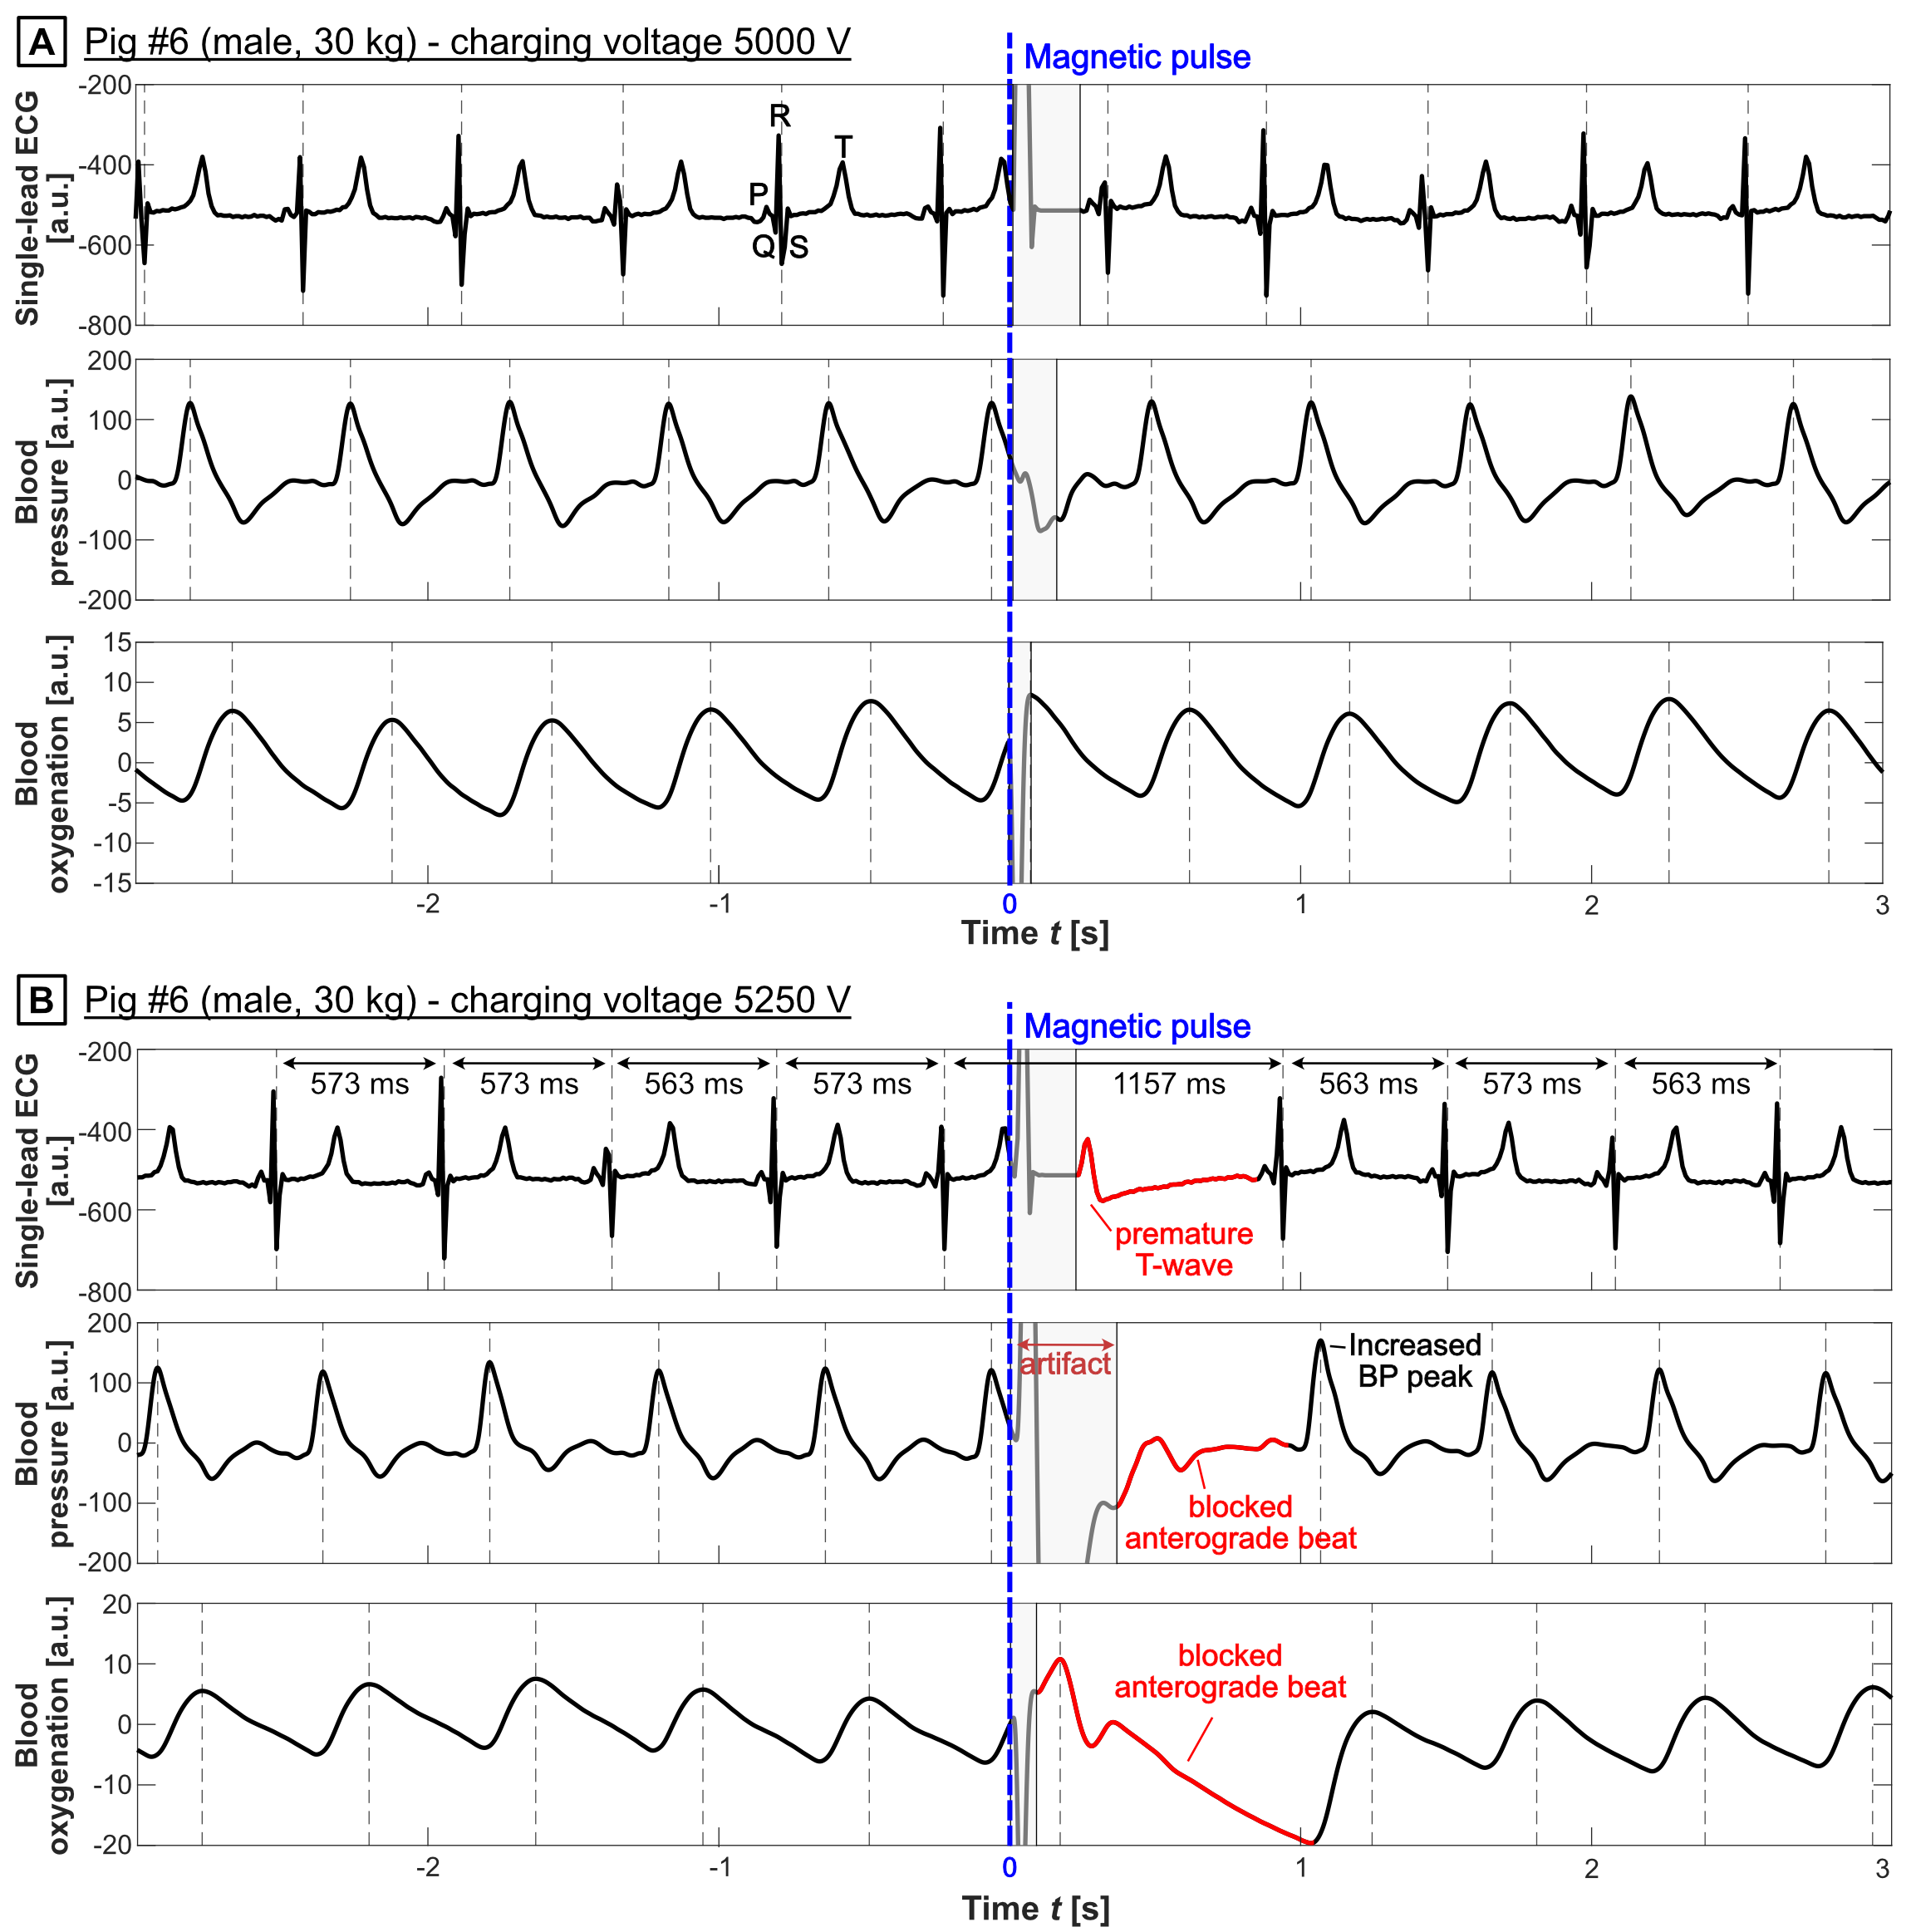
Figure 2: Measurements in pig #6 at (A) 5000 V (sub-threshold) and (B) 5250 V (supra-threshold). All traces suffered from artifacts after the pulse caused by EM interference with the measurement device and skeletal muscle contractions (insufficient muscle paralysis). The 5250-V pulse clearly caused capture, shown by the premature T-wave, the absence of an anterograde QRS complex at the native R-R interval, and a long cycle length (compensatory pause) after the pulse, resulting in increased blood pressure in the next beat. Normal anterograde conduction resumed in the following beat.

Figure 3: Measurements in pig #4 at (A) 6000 V (sub-threshold) and (B) 8500 V (supra-threshold). The ECG signal was noisy (poor skin-electrode contact) and was thus de-noised with a 750-Hz low-pass filter. The 8500-V pulse caused a premature T-wave, followed by a compensatory pause. The next QRS complex exhibited abnormal morphology and was followed by a second compensatory pause before normal anterograde conduction resumed. In this case, the magnetic pulse caused cardiac capture followed by a single premature ventricular contraction (PVC).
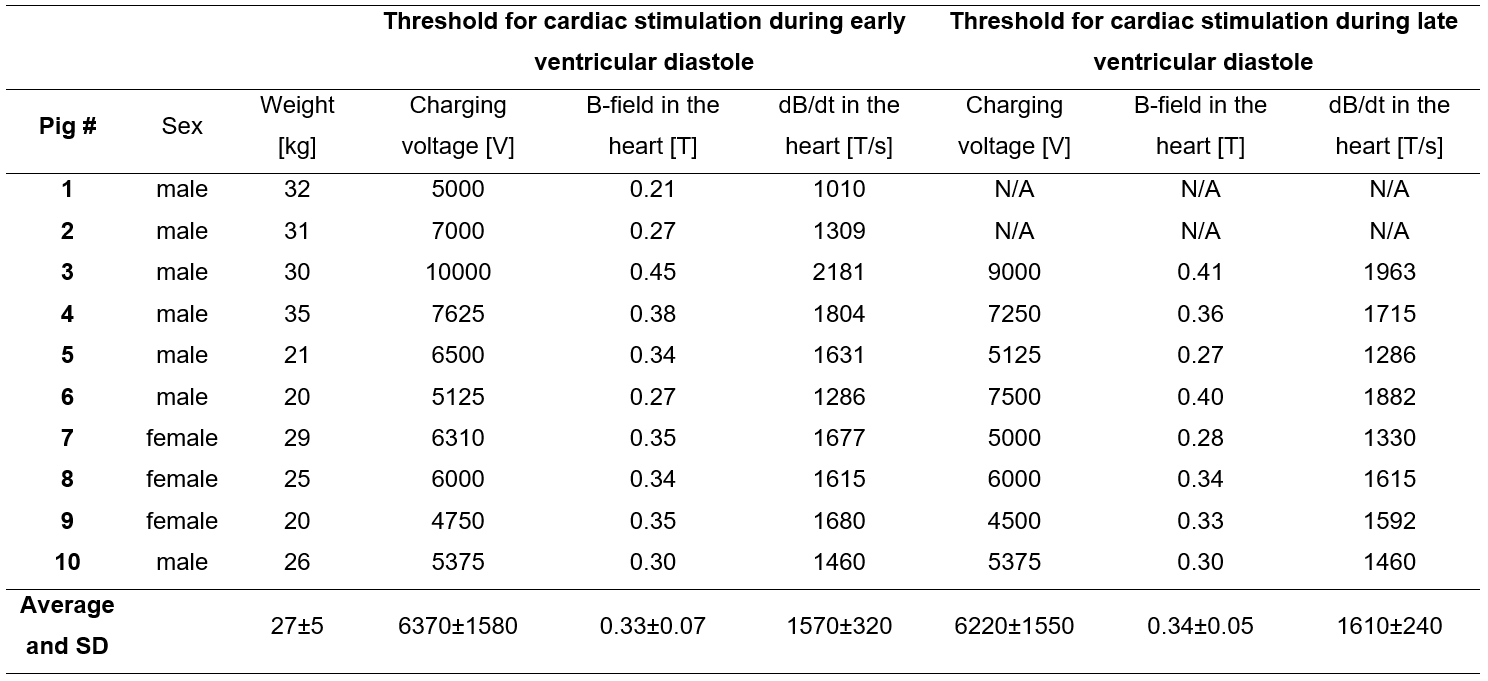
Figure 4: CS thresholds measured during early and late diastole in ten pigs. Charging voltages were measured directly. B-field and dB/dt thresholds were derived from the measured charging voltages and a Biot-Savart B-field simulation of the coil at the porcine heart location, which was evaluated using MR DIXON images. For pigs #5 and #6, no images were acquired, and the B-field was instead evaluated 11 cm above the coil center (mean coil-heart distance in the other pigs). The difference between early and late diastolic thresholds is not statistically significant at p<0.05.

Figure 5: Cardiac threshold measurements (pig #5, male, 21 kg) in terms of charging voltage as a function of the delay after the R-wave at which the magnetic pulse was applied. White dots show supra-threshold events (successful cardiac capture), black dots show sub-threshold events (no cardiac capture). We found the lowest CS threshold at the peak of the T-wave (5000 V) and could not achieve CS during ventricular systole with charging voltages of up to 13000 V.