0576
Quantifying regional pulmonary ventilation changes in hyperpolarized 3He MRI of asthma subjects following bronchodilator at three timepoints1Biomedical, Biological & Chemical Engineering, University of Missouri, Columbia, Columbia, MO, United States, 2Keck School of Medicine, University of Southern California, Los Angeles, CA, United States, 3Department of Radiology, University of Missouri, Columbia, Columbia, MO, United States, 4Biomedical Engineering, University of Virginia, Charlottesville, VA, United States, 5Radiology and Medical Imaging, University of Virginia, Charlottesville, VA, United States
Synopsis
Quantification of reginal pulmonary ventilation changes in a longitudinal study with hyperpolarized gas MRI would be beneficial for clinicians evaluating treatment responses. While VDP is a sensitive measure of global lung ventilation, regional ventilation information inherent in imaging is lost. In this work, we present a method of performing voxel-wise comparisons in 3He MRI and producing regional ventilation change maps in asthma patients following bronchodilation with either short-acting or long-acting beta agonists at three timepoints. Regional change maps were congruous with visual assessment of regional ventilation changes and showed the temporal effects of bronchodilator action in patients with severe asthma.
Introduction
Hyperpolarized gas (HPG) MRI is capable of producing high-quality images of lung function including response to drug treatment and disease progression 1,2. Regions of low signal in HPG images are often identified and quantified as a subject’s ventilation defect percentage (VDP): the percentage of total lung volume with substantially low signal. While VDP is a sensitive measurement of total lung ventilation 3,4, it compromises regional information inherent in imaging. Quantifying the change in regional ventilation patterns may be useful for assessing regional treatment response or guiding targeted therapies. Here, we propose a method for visualizing and quantifying regional ventilation changes in multiple timepoint HPG MRI. Healthy controls and asthma patients were imaged at 3 timepoints: baseline, and ½-hour and 6-hours following administration of short- or long-acting beta agonists (bronchodilator, BD). We hypothesized that regional pulmonary ventilation change maps would reflect changes of lung ventilation due to the differing time-courses of these treatments.Methods
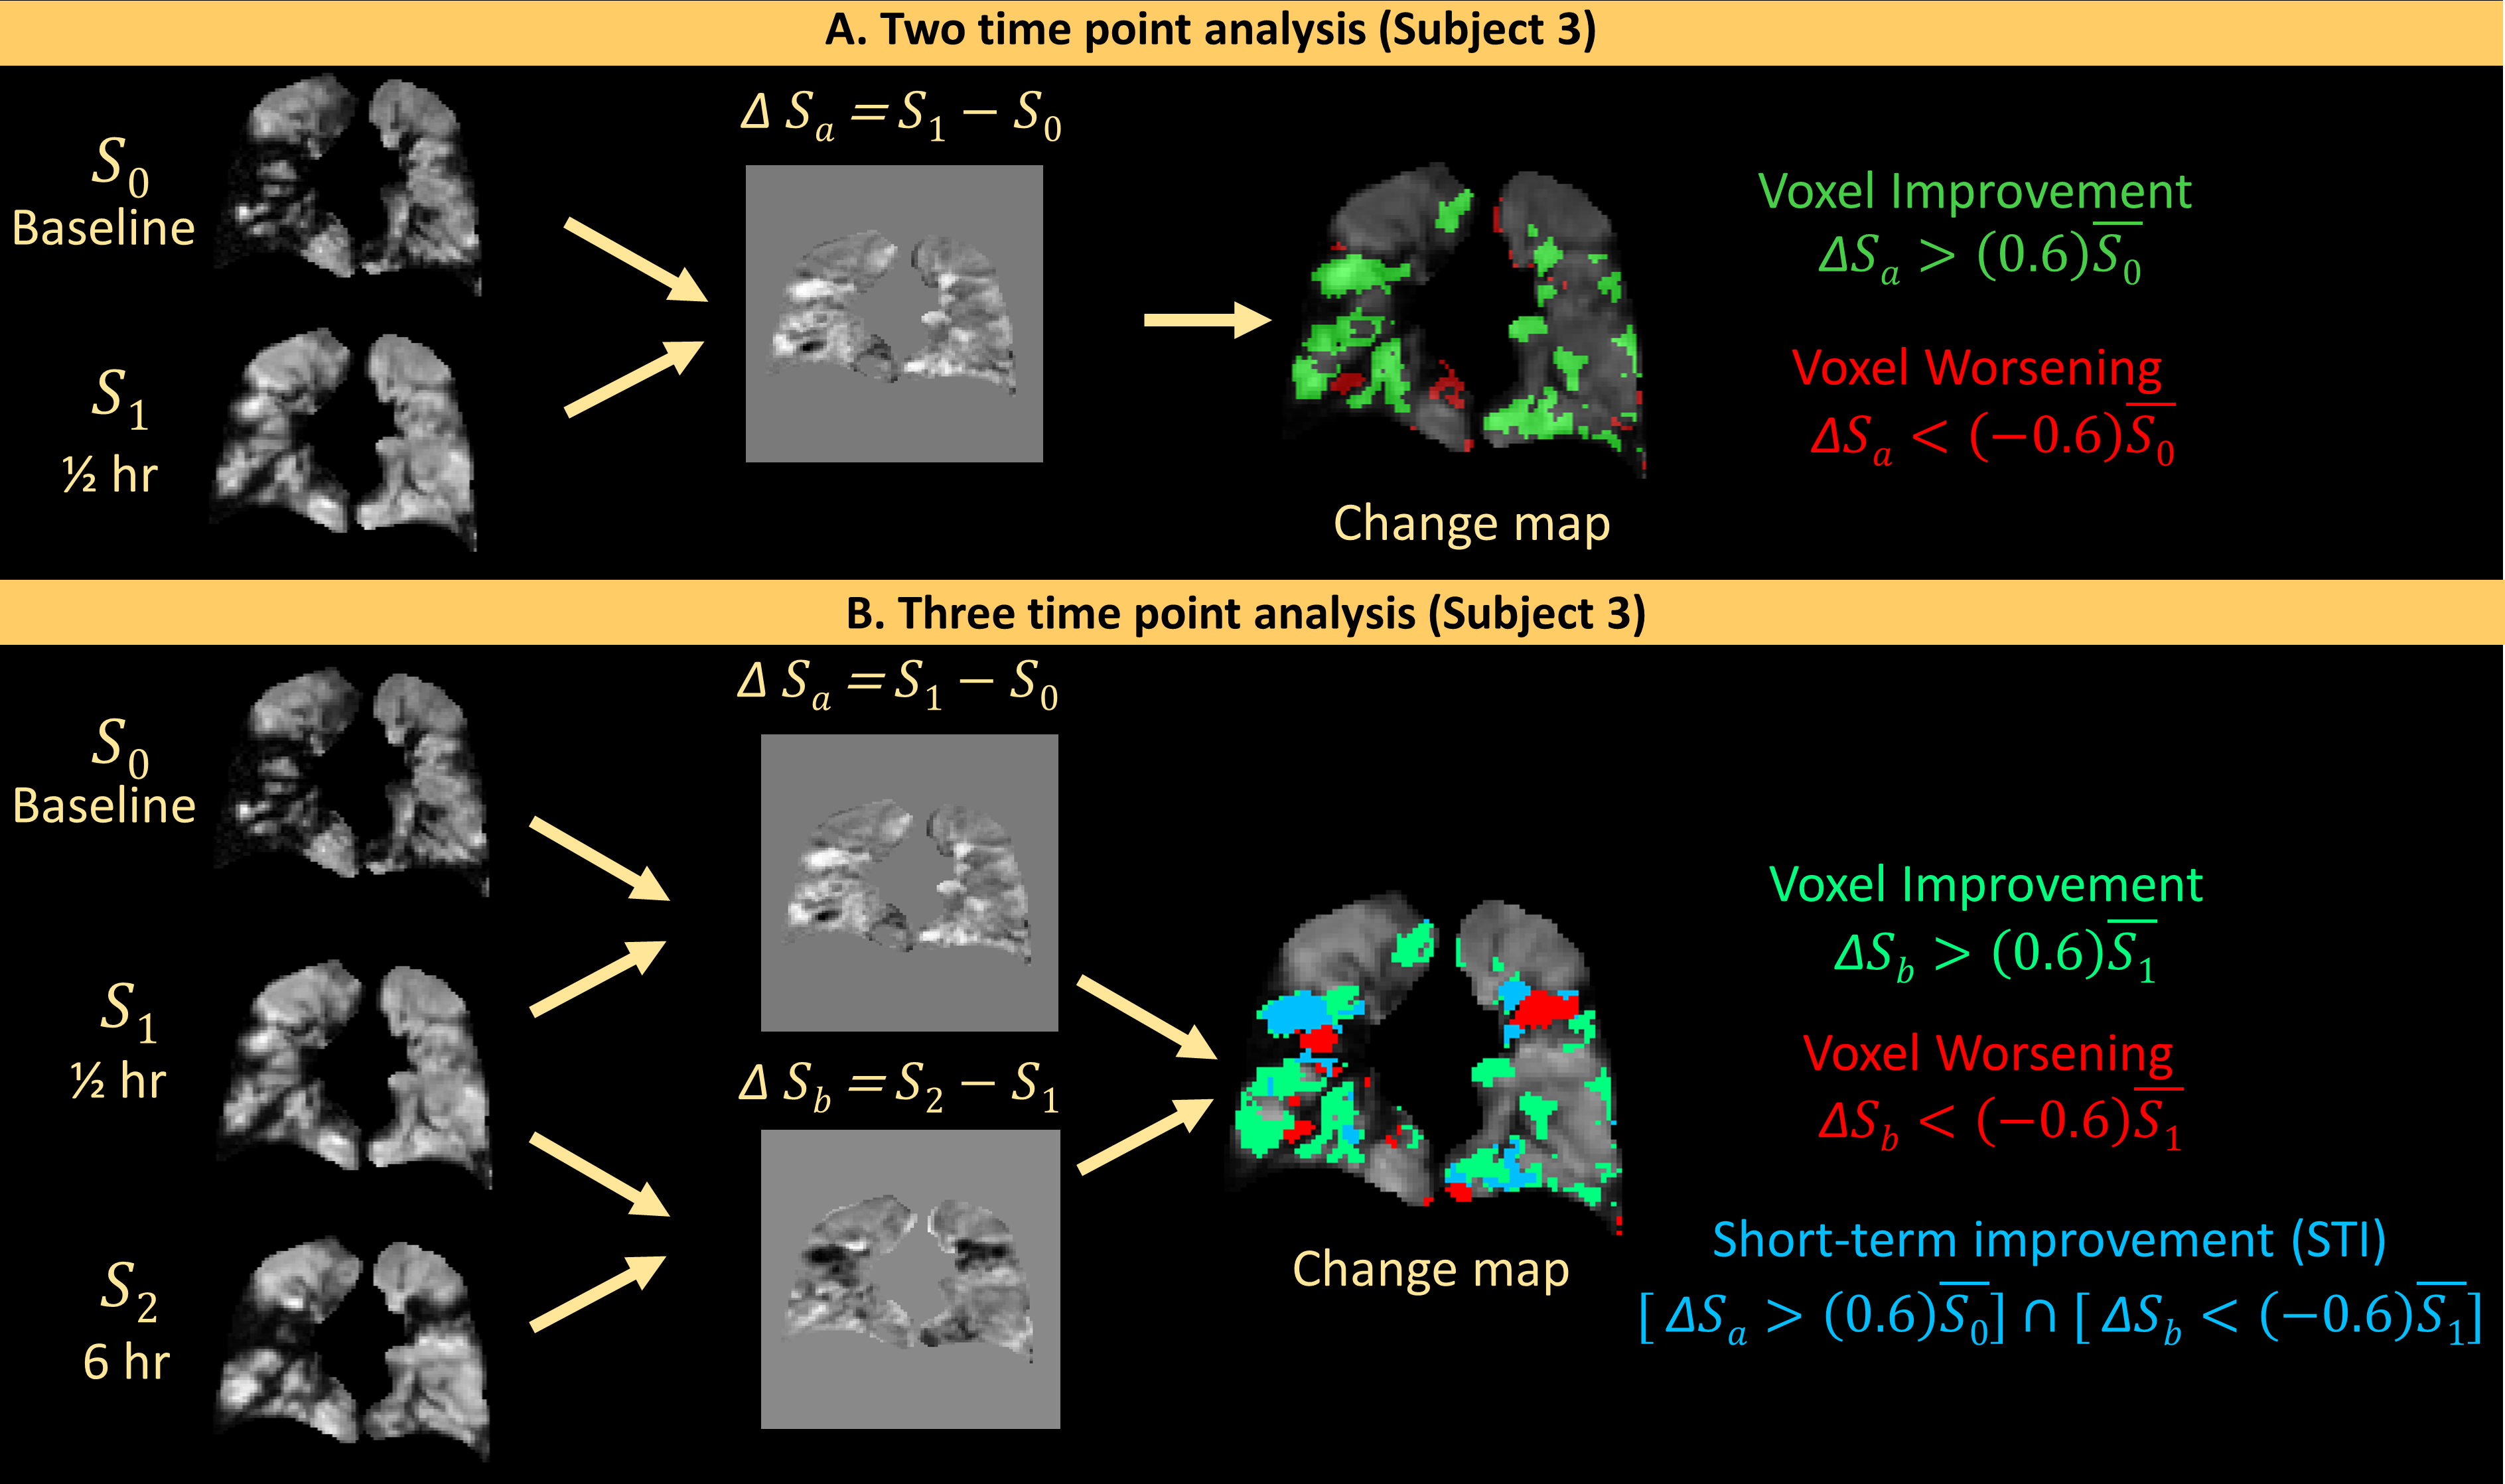
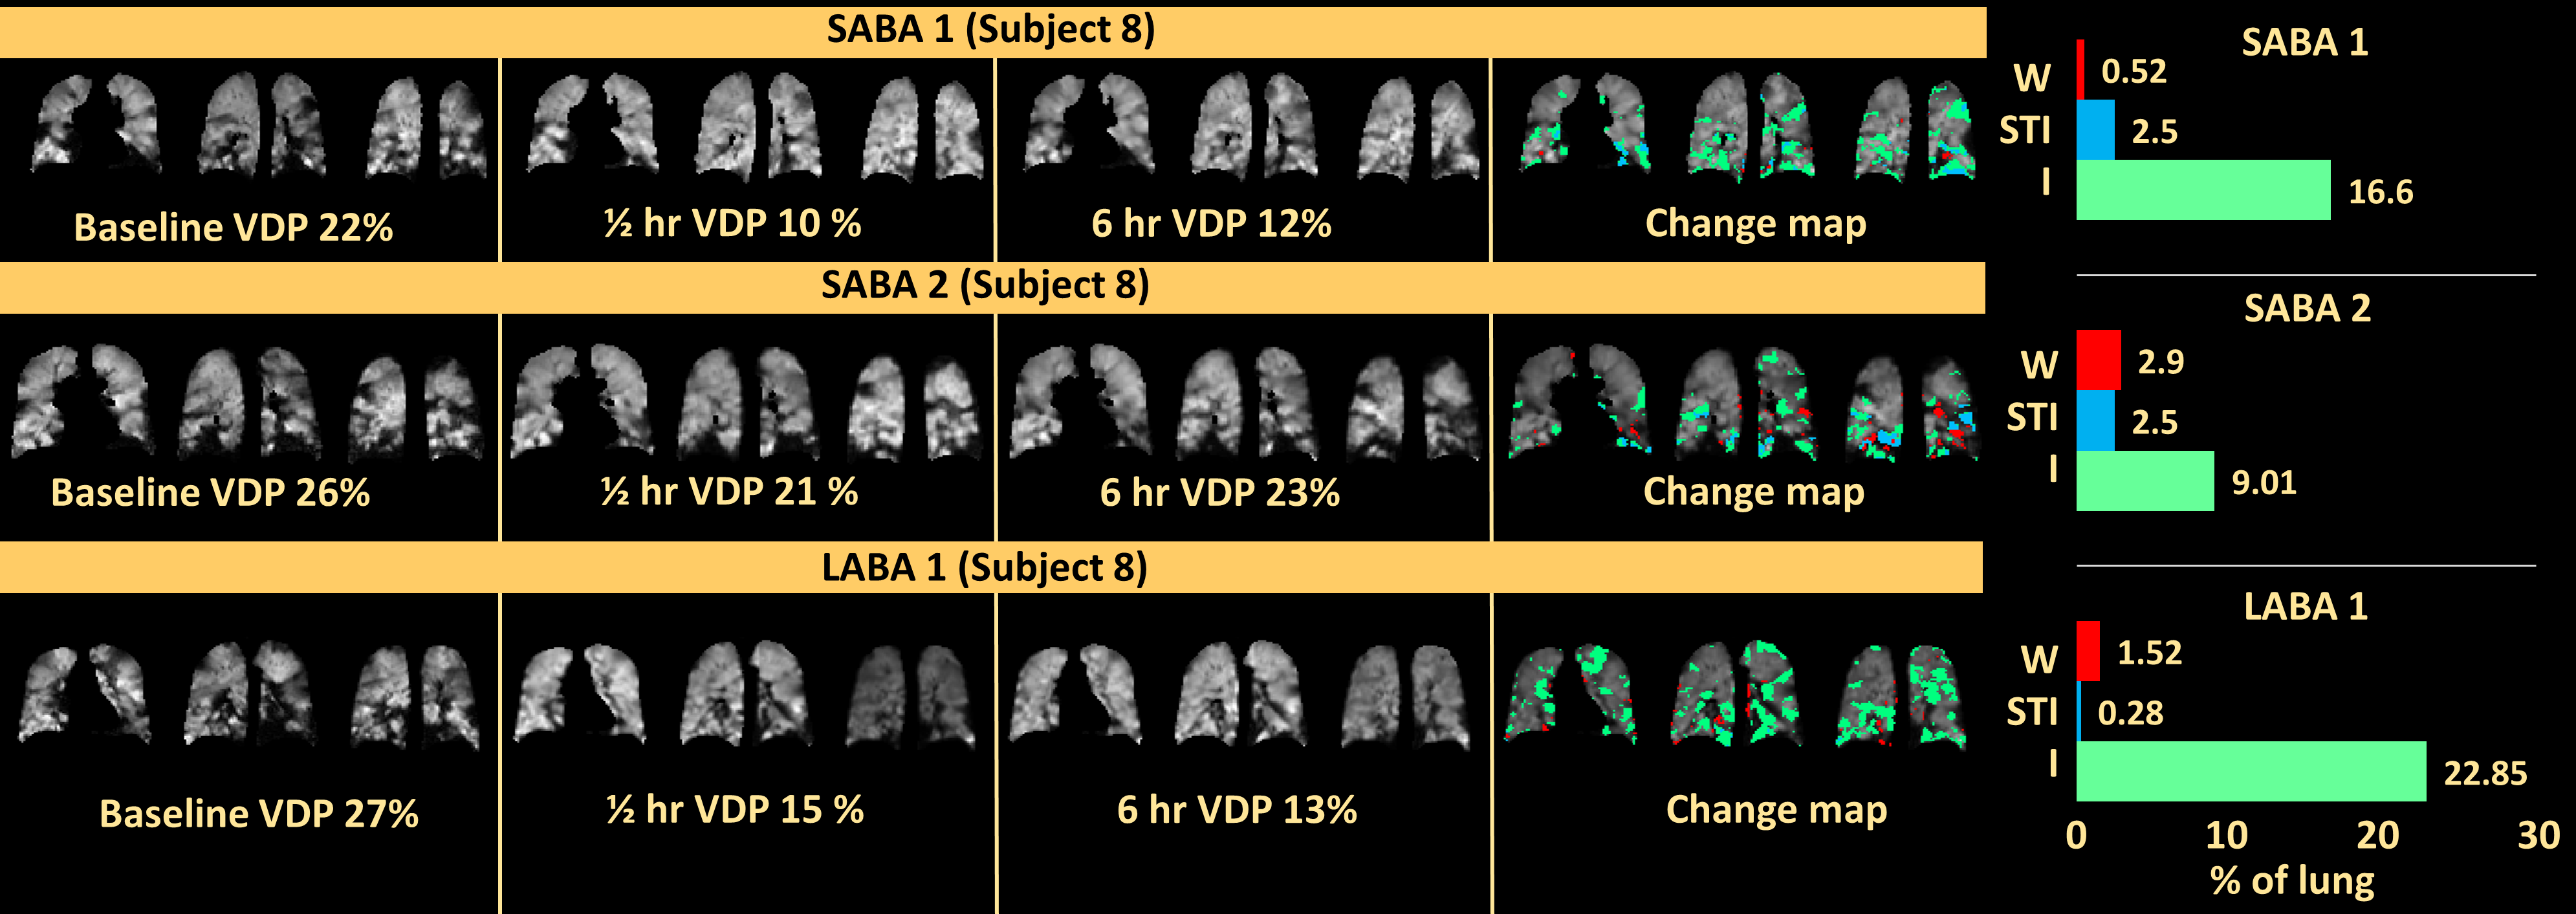
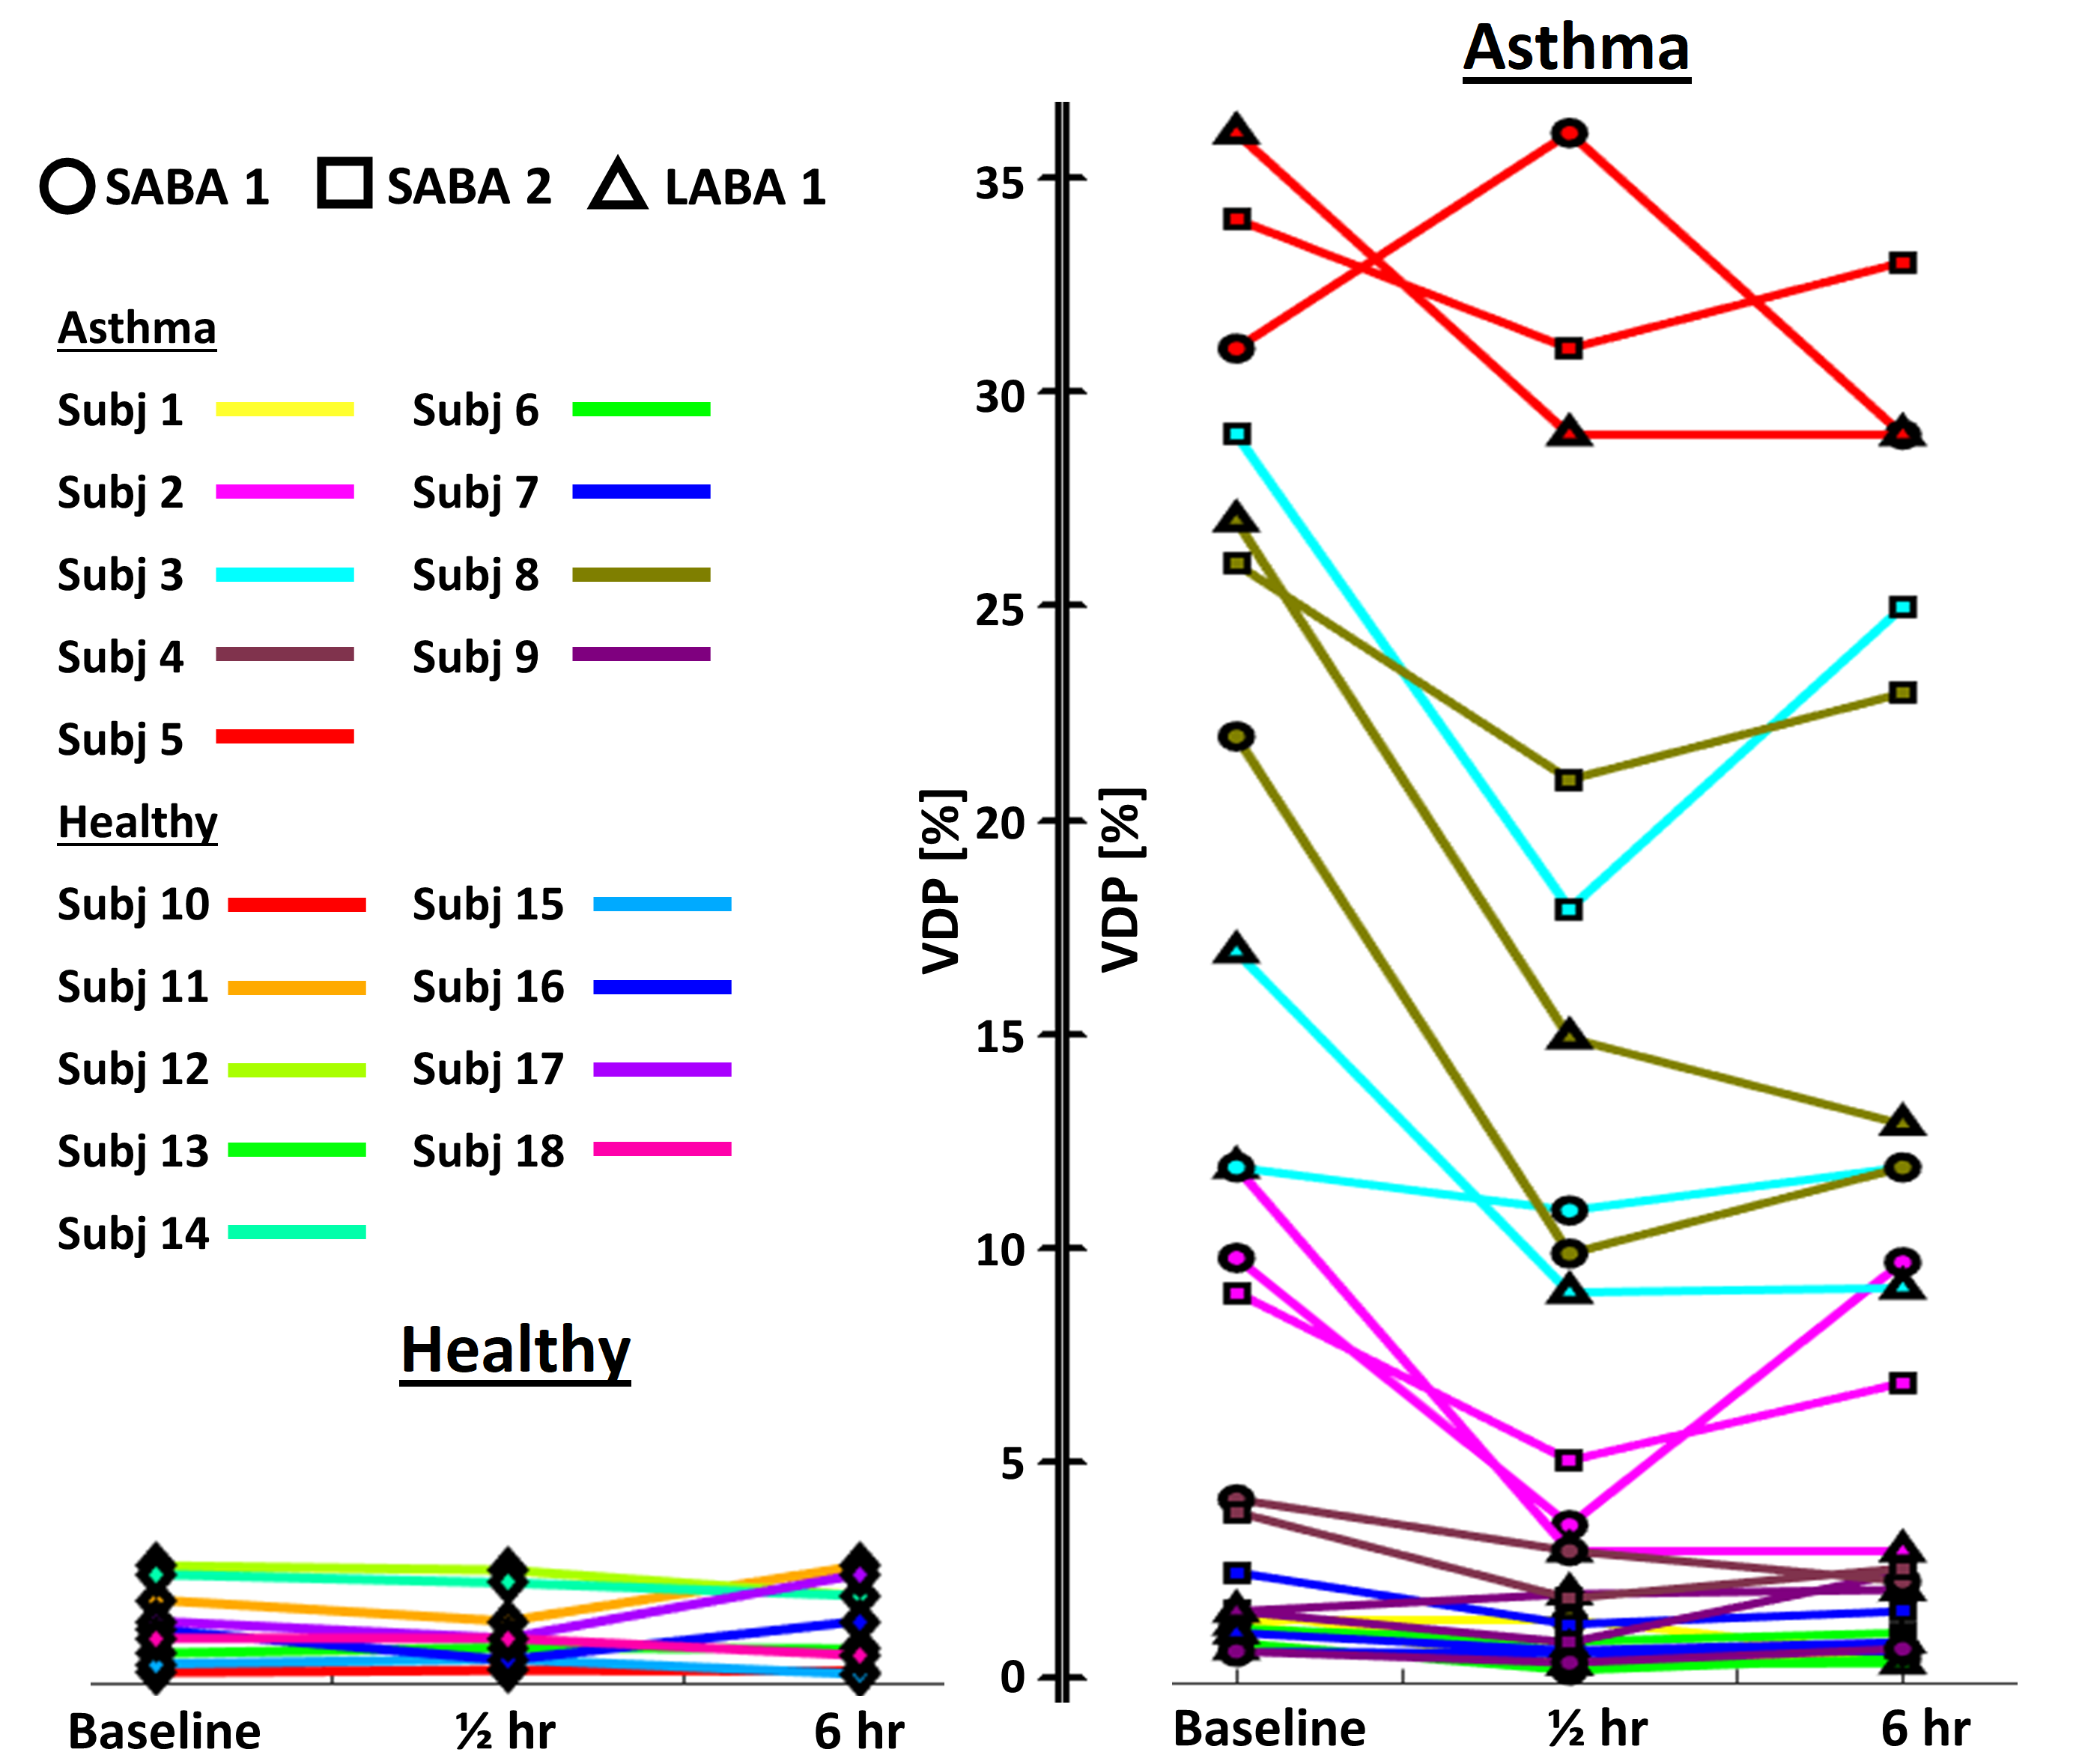
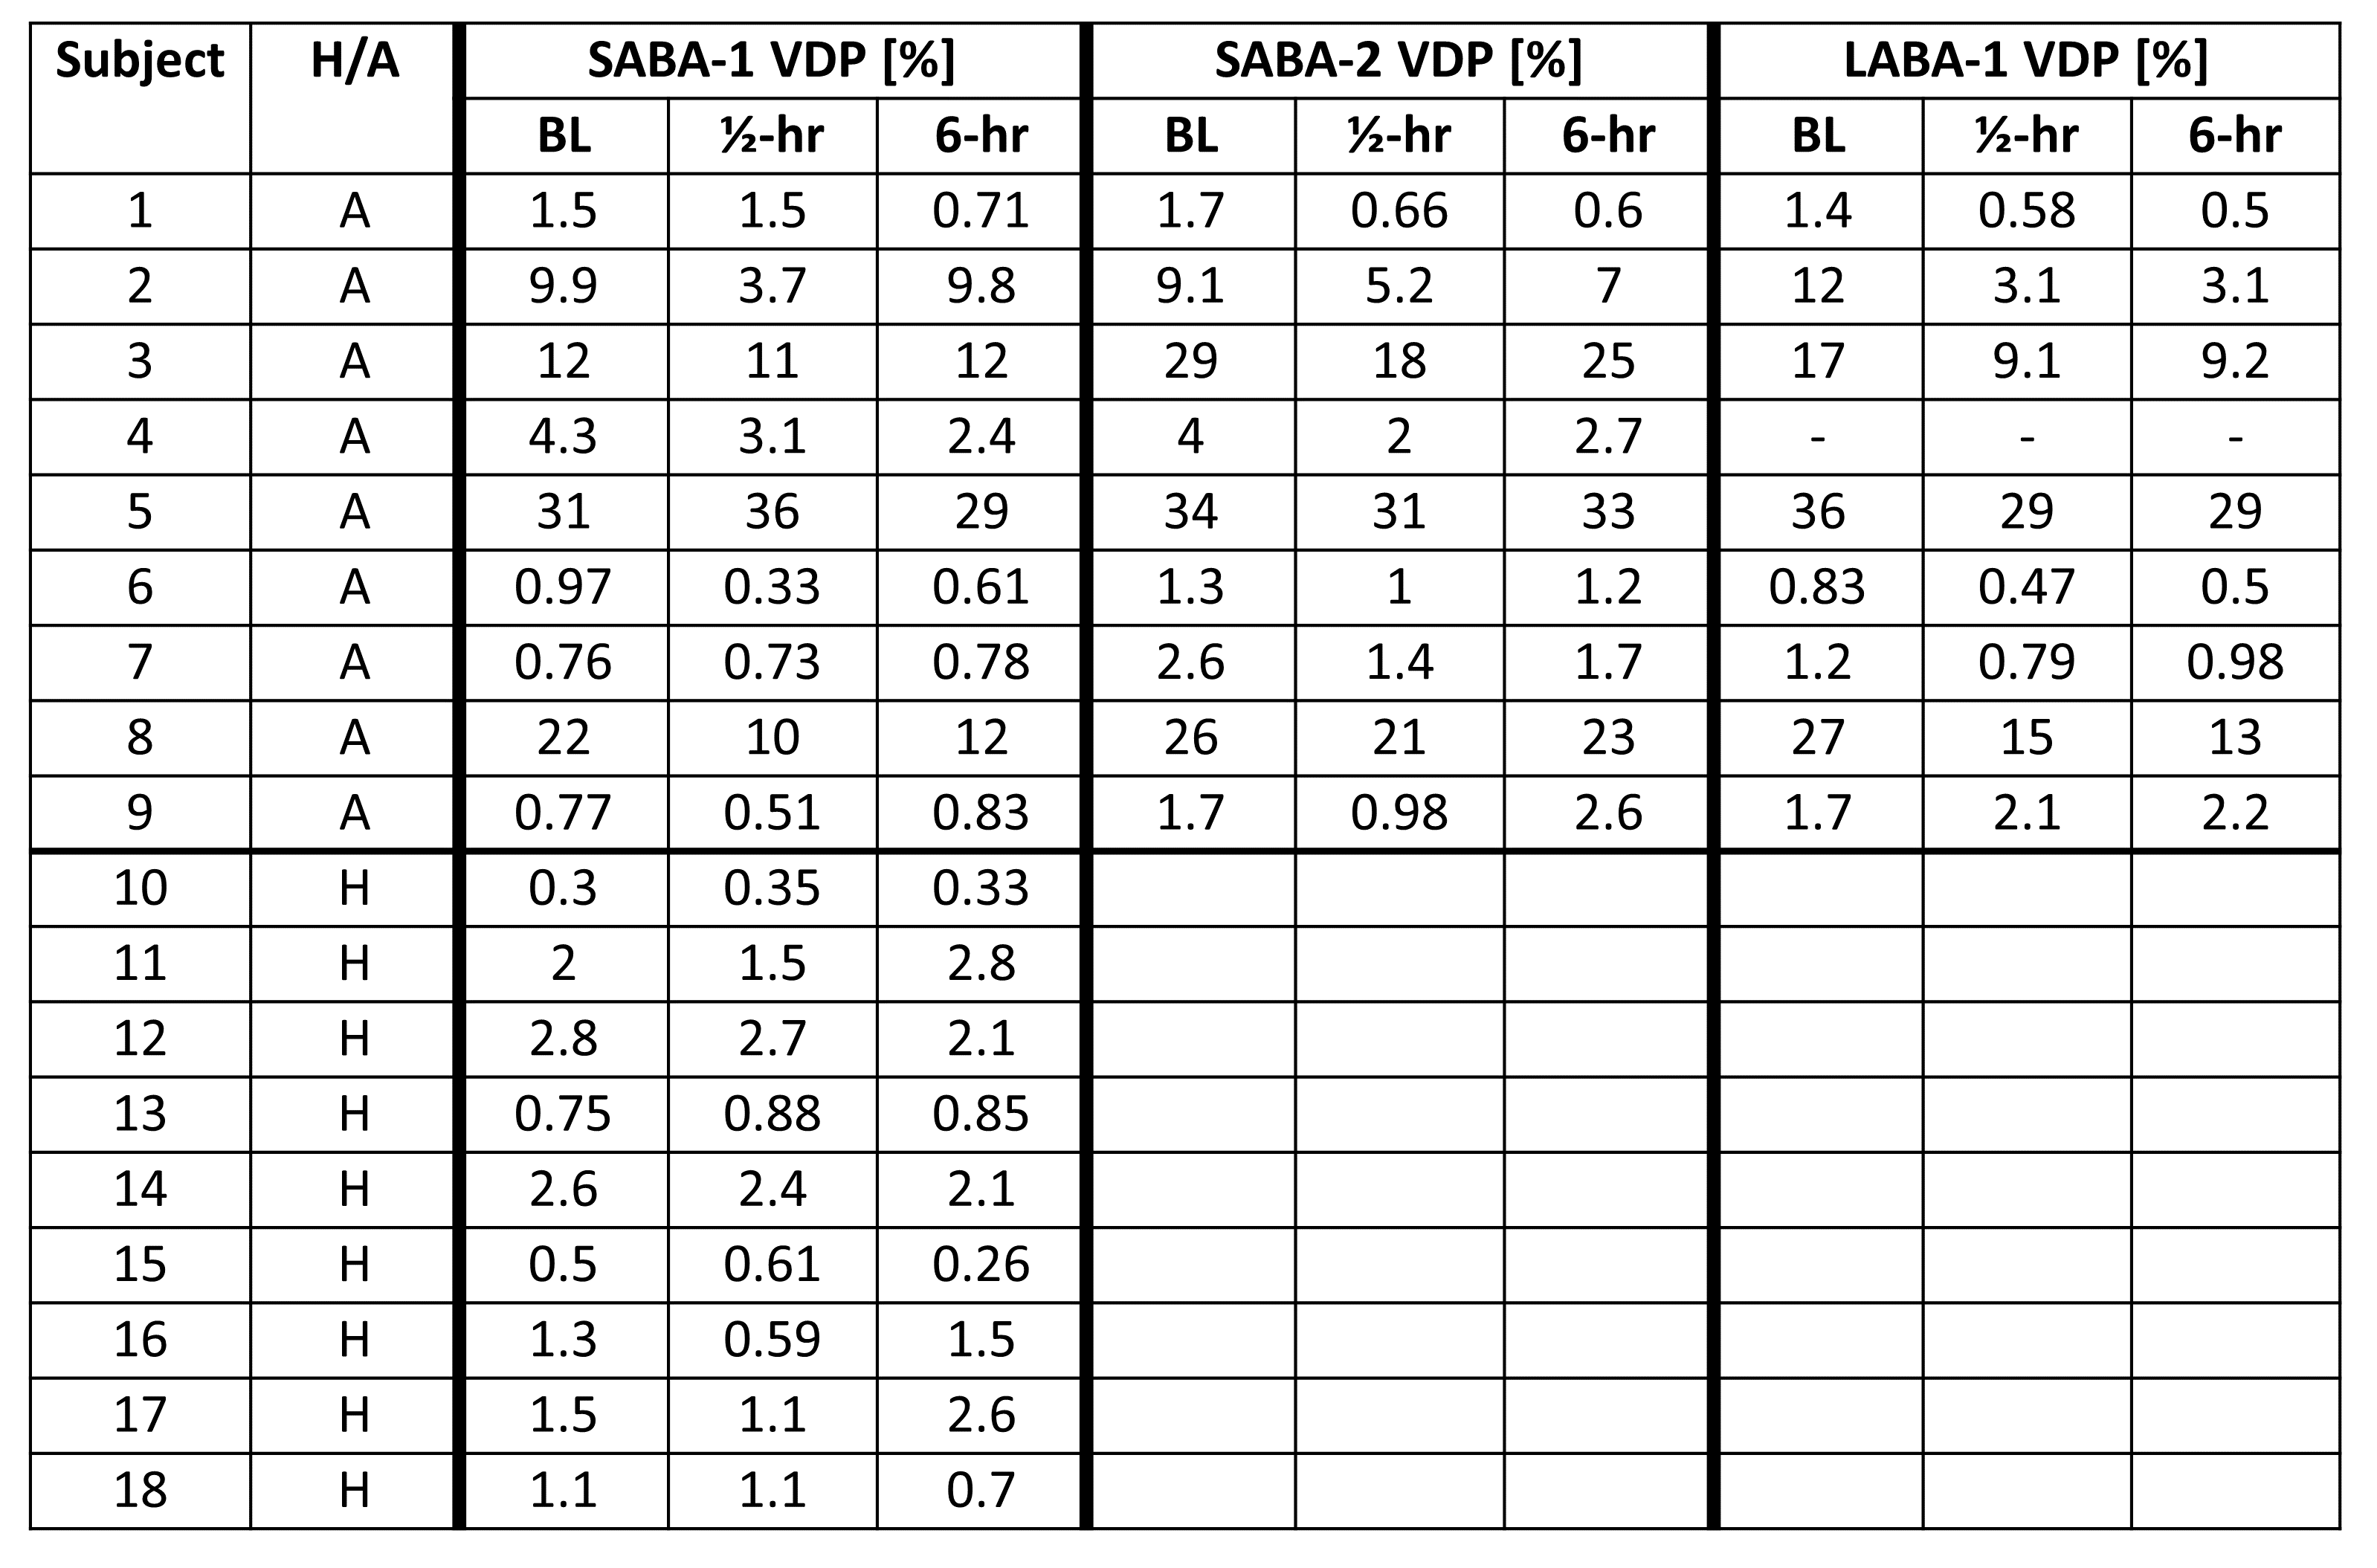
Eighteen subjects (14F/4M) including nine healthy control subjects (age=24.3±3.9, average FEV1pp=105±14.4) and nine asthmatic patients (age=35.5±14.8, FEV1pp=68±20) were enrolled in this IRB-approved study. Asthma subjects underwent HP 3He imaging on three separate days at three separate time points each day: baseline (S0 images), then again ½ hour (S1) and 6 hours (S2) following BD: 1 or 2 puffs of short acting beta-agonist (SABA-1/SABA-2) or 1-puff of long-acting beta agonist (LABA-1). Healthy control subjects only participated in one imaging session and received 1-puff of SABA. HPG MRI consisted of a 3D-TrueFISP scan (TR/TE=1.9/0.8, matrix=80×128, FA=9°, isotropic voxel dimension: 3.9mm, acquisition time=~10s). FEV1 was measured in each subject before and after MRI scanning. N4ITK bias correction 5 and voxel smoothing were performed on images, which were normalized to the signal distribution’s 95th percentile voxel signal value. For calculating regional ventilation change maps, post treatment images were registered to baseline images. The difference in the voxel signal intensity was calculated for baseline to ½-hour (ΔSa=S1–S0) and ½-hour to 6-hour (ΔSb=S2-S1). For two-time point analysis, difference-map voxel values of >60% of the baseline mean signal value were identified as improved and those of <-60% were identified as worsened (green and red regions, respectively, in change maps, Figure 1A). In addition, three-timepoint analyses were performed to identify regions of short-term improvement (STI) in which voxels improved at ½-hour but returned to normal at 6-hours (colored blue in 3-timepoint change map and calculated as shown in Figure 1, examples in Figure 2). Finally, ventilation changes from baseline to 6-hours were quantified as the difference between total volume of improvement and total worsening expressed as percentage of whole-lung volume: the regional percent change (RPC). In addition to RPC, we also calculated VDP as voxels with <60% of the whole-lung HP gas signal mean 3. The following analyses were performed: comparison of inter-quartile values for RPC and its significance for the 3 dosing schemes of BD; Pearson correlation between RPC, VDP and FEV1.Results
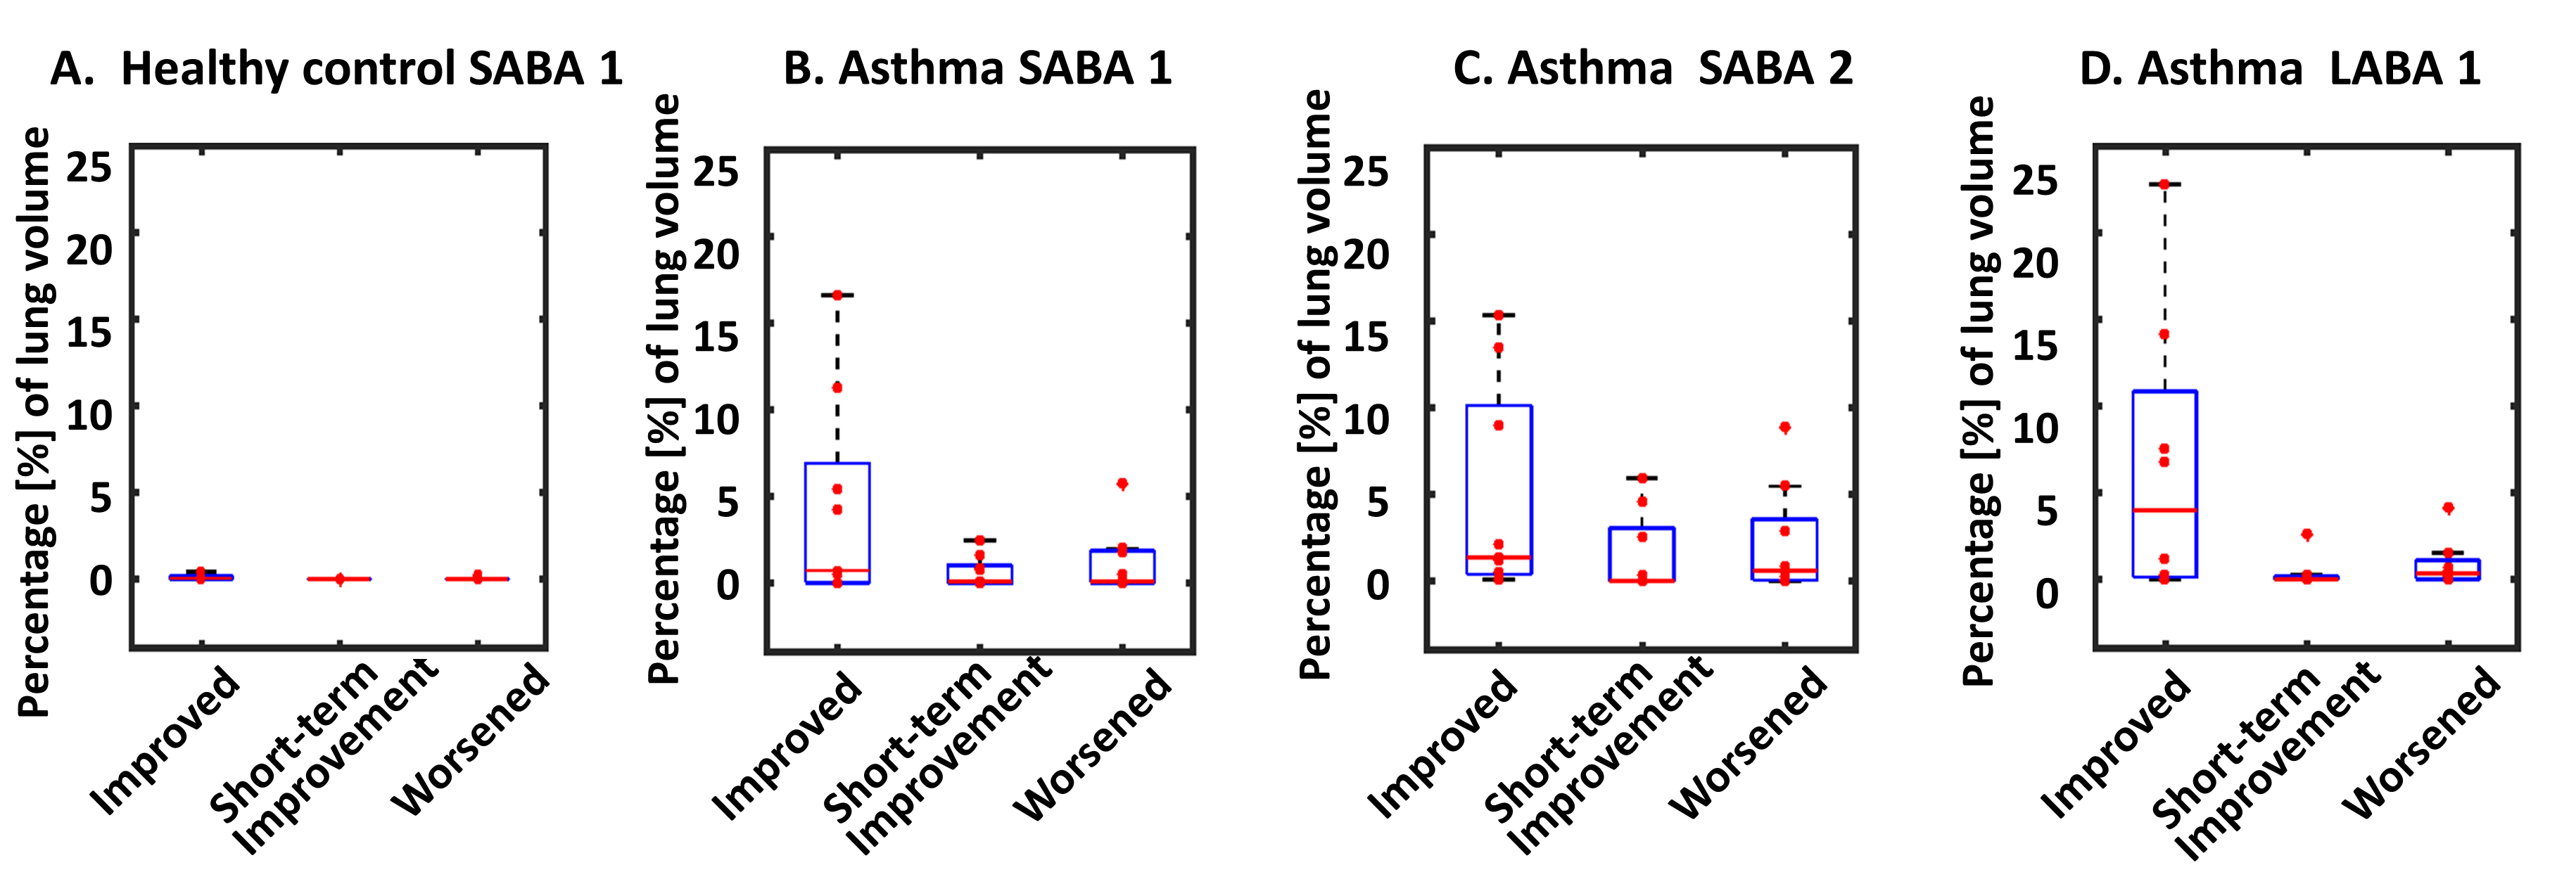
The average improvements between RPC of the lung for nine asthmatic subjects after inhaling LABA-1, SABA-2 and SABA-1 were 6.6±8.2%, 4.8±6.1% and 4.3±5.9% respectively (Figure 3) whereas healthy subjects’ RPC averaged 0.08%±0.1. In 5 of the 9 asthma subjects, (subjects 1,4,6,7,9) baseline VDP was <5% and thus they experienced minimal/no change in ventilation following BD. In patients with >5% VDP at baseline (subjects 2,3,5,8), the average improvement in RPC for SABA-1, SABA-2, and LABA-1 was 9.4%, 9.9% and 13%, respectively. In 3 of the 9 asthma cases, the lung condition improved 4% more with LABA-1 than with SABA-1 or SABA-2. Overall, net RPC correlated with change in VDP and FEV1 from the baseline to 6-hour scan (ρ=-0.75 for ∆RPC vs ∆FEV1, P-value<10-7; ρ=0.94 for ∆RPC vs ∆VDP, P value< 10-7; ρ=-0.72 for ∆VDP vs ∆FEV1, P-value<10-16).Discussion
Our regional change maps (Figure 1 and 2) demonstrated congruence with visual examination of regional ventilation changes, which may be a useful tool for clinicians evaluating regional ventilation changes longitudinally. In subjects with many defects, baseline images showed variation in VDP (average standard deviation of baseline images $$$\bar\sigma$$$ =3.85) across imaging sessions (Figure 4, Table 1). Nevertheless, our analysis shows a quantifiable rapid onset improvement with 1 or 2-puff of SABA and long-term control with 1-puff of LABA in 8 of the 9 asthmatics as indicated by larger STI values from the SABA sessions. The P-values for STI between SABA-1 vs SABA-2, SABA-1 vs LABA-1 and SABA-2 vs LABA-1 were 0.33, 0.56 and 0.2, respectively, indicating an insignificant difference across all patients, –likely due to baseline VDP <5% in 5 of the asthma patients. Importantly, half of our patients had VDP <5% at baseline where very minimal effect of BD was observed. This suggests that ventilation deficiencies may not appear in asthma cohorts with HPG ventilation MRI but could possibly show discrepancies with dissolved-phase imaging (tissue/blood plasma and/or red blood cells) where our quantifying technique can be applied.Conclusion
We present a method for quantifying regional ventilation changes in HPG images at two or three-timepoints. Our analysis exhibits concordance with visual inspection towards temporal effects of bronchodilator treatments.Acknowledgements
Funded by Novartis International AGReferences
1. Altes TA, Johnson M, Fidler M, et al. Use of hyperpolarized helium-3 MRI to assess response to ivacaftor treatment in patients with cystic fibrosis. J Cyst Fibros. Mar 2017;16(2):267-274.
2. Sun Y, O'Sullivan BP, Roche JP, et al. Using hyperpolarized 3He MRI to evaluate treatment efficacy in cystic fibrosis patients. J Magn Reson Imaging. Nov 2011;34(5):1206-1211.
3. Thomen RP, Sheshadri A, Quirk JD, et al. Regional ventilation changes in severe asthma after bronchial thermoplasty with (3)He MR imaging and CT. Radiology. Jan 2015;274(1):250-259.
4. Roach DJ, Willmering MM, Plummer JW, et al. Hyperpolarized 129Xenon MRI Ventilation Defect Quantification via Thresholding and Linear Binning in Multiple Pulmonary Diseases. Acad Radiol. Aug 2021; S1076-6332(21)00304-4.
5. Tustison NJ, Avants BB, Cook PA, et al. N4ITK: improved N3 bias correction. IEEE Trans Med Imaging. Jun 2010;29(6):1310-1320.
Figures