0575
Measuring Airflow Velocity in the Upper Airways with 129Xe Phase Contrast MRI: Feasibility in Pediatric Patients with Obstructive Sleep Apnea1POLARIS, Imaging Sciences, Department of Infection, Immunity & Cardiovascular Disease, The University of Sheffield, Sheffield, United Kingdom, 2Center for Pulmonary Imaging Research, Cincinnati Children’s Hospital Medical Center, Cincinnati, OH, United States, 3Division of Pulmonary Medicine, Cincinnati Children’s Hospital Medical Center, Cincinnati, OH, United States, 4MR Clinical Science, Philips, Cincinnati, OH, United States, 5Department of Radiology, Cincinnati Children’s Hospital Medical Center, Cincinnati, OH, United States, 6Department of Pediatrics, College of Medicine, University of Cincinnati, Cincinnati, OH, United States
Synopsis
We report preliminary HP 129Xe phase contrast (PC) MRI data in pediatric patients with obstructive sleep apnea; a common sleep-related breathing disorder caused by upper airway collapse. The feasibility and safety of 129Xe gas delivery through the patient’s anesthesia mask during tidal breathing under sedation (approximately sleep stage-2) was demonstrated. Dynamic spiral-based PC MRI (temporal resolution 0.5—1s) captured inspiratory and expiratory airflow, with sufficient sensitivity to identify flow features such as high-speed jets corresponding to regions of airway narrowing/obstruction on 1H anatomical MRI. With further data, our work may allow the development of optimized personalized treatment plans.
Introduction
Obstructive sleep apnea (OSA) is a common sleep-related breathing disorder caused by upper airway collapse, with a global prevalence ~1 billion and a significant healthcare burden1. OSA is diagnosed by polysomnography, and anatomical imaging including proton MRI can be used to identify sites of airway collapse for treatment planning. However, there is a lack of robust methods for evaluating the relationship between airway anatomy and airflow; for example, regions of fast-moving airflow indicate obstructed sections of the upper airway, which may be candidates for surgical interventions.Phase contrast (PC) MRI offers a means to measure fluid flow non-invasively in-vivo, and is commonly used in cardiovascular medicine2. Hyperpolarized (HP) gases have shown utility as inhaled contrast agents for PC MRI of the airways3-5, and we recently reported a concordance between PC MRI and computational fluid dynamics (CFD) simulations of upper airway flow in healthy volunteers6. To date, in-vivo HP gas PC MRI studies have been limited to healthy volunteers7, 8 or small animals5.
Here, we hypothesize that HP 129Xe PC MRI is feasible in pediatric patients with OSA, and can aid the assessment of respiratory flow in the upper airway by identifying obstructions.
Methods
3 patients (mean age=15.6years, obstructive apnea-hypopnea index=11.4) were enrolled in this study, which was approved by the Cincinnati Children’s Hospital IRB.PC MRI was performed using a 3T Philips clinical MRI scanner and flexible 129Xe radiofrequency coil, during a clinically-indicated MRI performed for OSA. Previously, we reported 129Xe PC MRI of the upper airways in non-sedated healthy volunteers during slow inhalation of 1L of 129Xe over a period of 10—20s, during which a series of PC images were obtained6. In the present work, patients with OSA were clinically sedated with dexmedetomidine, which approximates sleep stage-2, and 129Xe gas (1L, polarized to ~30%) was delivered from a bag to the patient’s anesthesia mask during tidal breathing and was removed after two inhalation-exhalation cycles.
2D sagittal PC MRI data were acquired continuously during this period, with acquisition parameters; spiral readout, spatial resolution: 2.5mm2, slice thickness: 10mm, venc: 200cm/s, velocity encoding in either one (foot-head) or three spatial directions (right-left, anterior-posterior, foot-head); acquisition time for a single slice: ~0.5 or 1s, respectively.
Flow at the mask was measured with an MRI-compatible pneumotachograph; patient heart rate and SpO2 were measured throughout.
Results
The MRI procedure was successful, with no adverse events. SpO2 did not noticeably drop at any time during or after the introduction of 129Xe gas.Velocity maps of respiratory airflow over two breaths in the upper airway and trachea along the foot-head direction are shown in Figure 1. In this example subject, three images captured inspiratory airflow, two captured expiration, and one captured the transition. During inhalation, a high-speed jet formed in the nasopharynx, which qualitatively corresponds to a region of airway narrowing at the tip of the soft palate on 1H anatomical MRI. High velocity flow is not visible in the same region during exhalation, demonstrating that obstruction occurs only during inhalation. A jet formed through the glottis during both inhalation and exhalation, corresponding to the region inferior to airway narrowing at the epiglottis on 1H anatomical MRI. Results obtained from 3-directional PC MRI in the same subject (Figure 2) illustrate that despite the 2-fold lower temporal resolution compared with unidirectional PC MRI, respiratory airflow during inspiration and expiration was captured by at least one distinct dynamic image. Although the most pronounced jets are observed in the (dominant) foot-head direction, anterior-posterior flow appears to show additional features that may be informative in patients who exhibit more turbulent flow patterns.
The approximate mean SNR in the nasopharynx for the 3-directional scan was 21.7±4.8 (inspiration phase) and 10.0±5.5 (expiration), and for the FH-only scan was 23.1±8.3 (inspiration) and 8.7±5.9 (expiration). The inspiratory/expiratory patterns of airflow observed in PC MRI qualitatively matched the breathing cycle measured by the pneumotachograph (Figure 3).
Discussion
Low SNR of 129Xe PC MRI data, particularly in the expiration phase, constrains the accuracy of airflow velocity measurements9. Whilst 1L 129Xe was connected to the gas delivery apparatus, the actual volume of gas that enters the airways during two breathing cycles is likely much less. The addition of a preparatory gas “wash-in” phase may boost SNR. In addition, these experiments were performed using a flexible chest coil with suboptimal efficiency when used for upper airway measurements; a localized receiver array proximal to the neck may provide SNR benefits.Though spiral trajectories are inherently robust to motion, bulk motion of the airway during acquisition can cause motion artefacts and difficulties in isolating the airway signal. In patients with more complicated bulk airway motion, the use of image acceleration techniques7, motion-compensated reconstruction strategies, in combination with 1H-MRI-guided image registration may be needed.
Conclusion
We have demonstrated that 129Xe PC MRI can be performed safely to map regional airway velocity in patients with OSA under sedation, with sufficient sensitivity to identify regions of obstruction at different phases of the breathing cycle.Combined with proton MRI of airway anatomy and CFD simulations, this may lead to further understanding of disease severity and local function, allowing the development of personalized treatment plans.
Acknowledgements
We acknowledge funding from the National Heart, Lung, and Blood Institute of the National Institutes of Health under Award Number K99HL144822. The content is solely the responsibility of the authors and does not necessarily represent the official views of the National Institutes of Health.
References
[1] A. V. Benjafield, N. T. Ayas, P. R. Eastwood, et al. The Lancet Respiratory Medicine. 2019, 7, 687-98.
[2] K. S. Nayak, J.-F. Nielsen, M. A. Bernstein, et al. Journal of Cardiovascular Magnetic Resonance. 2015, 17, 71.
[3] G. J. Collier, M. Kim, Y. Chung, et al. Journal of Magnetic Resonance Imaging. 2018, 48, 1400-9.
[4] L. de Rochefort, L. Vial, R. Fodil, et al. Journal of Applied Physiology. 2007, 102, 2012-23.
[5] K. R. Minard, A. P. Kuprat, S. Kabilan, et al. Journal of Magnetic Resonance. 2012, 221, 129-38.
[6] Q. Xiao, N. J. Stewart, M. M. Willmering, et al. PLOS ONE. 2021, 16, e0256460.
[7] G. J. Collier, J. M. Wild Magnetic Resonance in Medicine. 2015, 73, 2255-61.
[8] L. de Rochefort, X. Maître, R. Fodil, et al. Magnetic Resonance in Medicine. 2006, 55, 1318-25.
[9] A. H. Andersen, J. E. Kirsch Medical Physics. 1996, 23, 857-69.
Figures
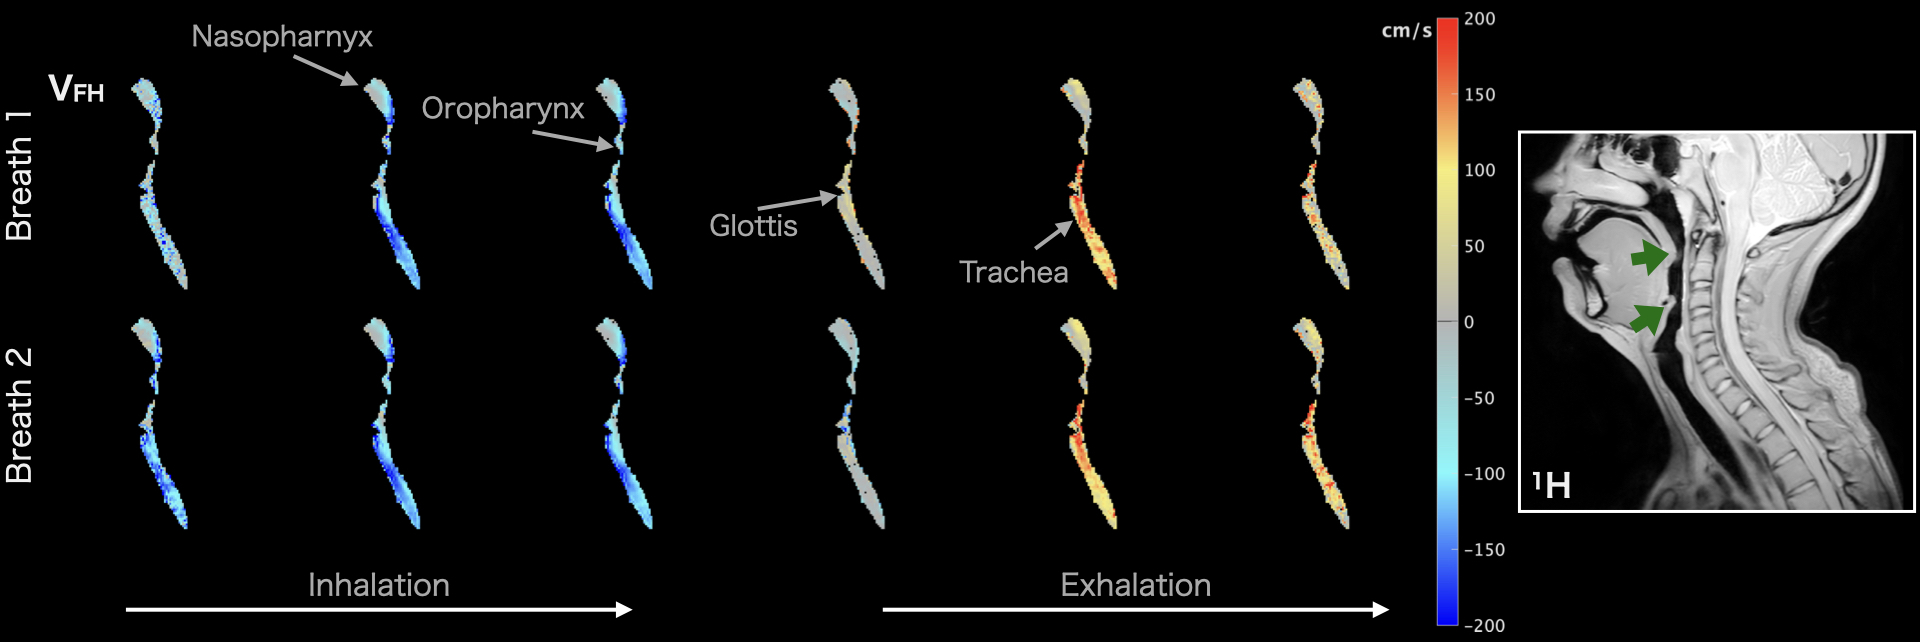
Figure 1: 129Xe velocity maps of flow in the foot-head direction (vFH) acquired during two breathing cycles (temporal resolution; 𝛥t ~0.5 s). Inspiratory flow is indicated by negative values (blue) and expiratory flow by positive values (red). The major anatomical structures of the upper airways are labeled. Right: approximately spatially corresponding slice from high-resolution 1H anatomical MRI, indicating regions of narrowing at the tips of the soft palate and epiglottis (green arrows).
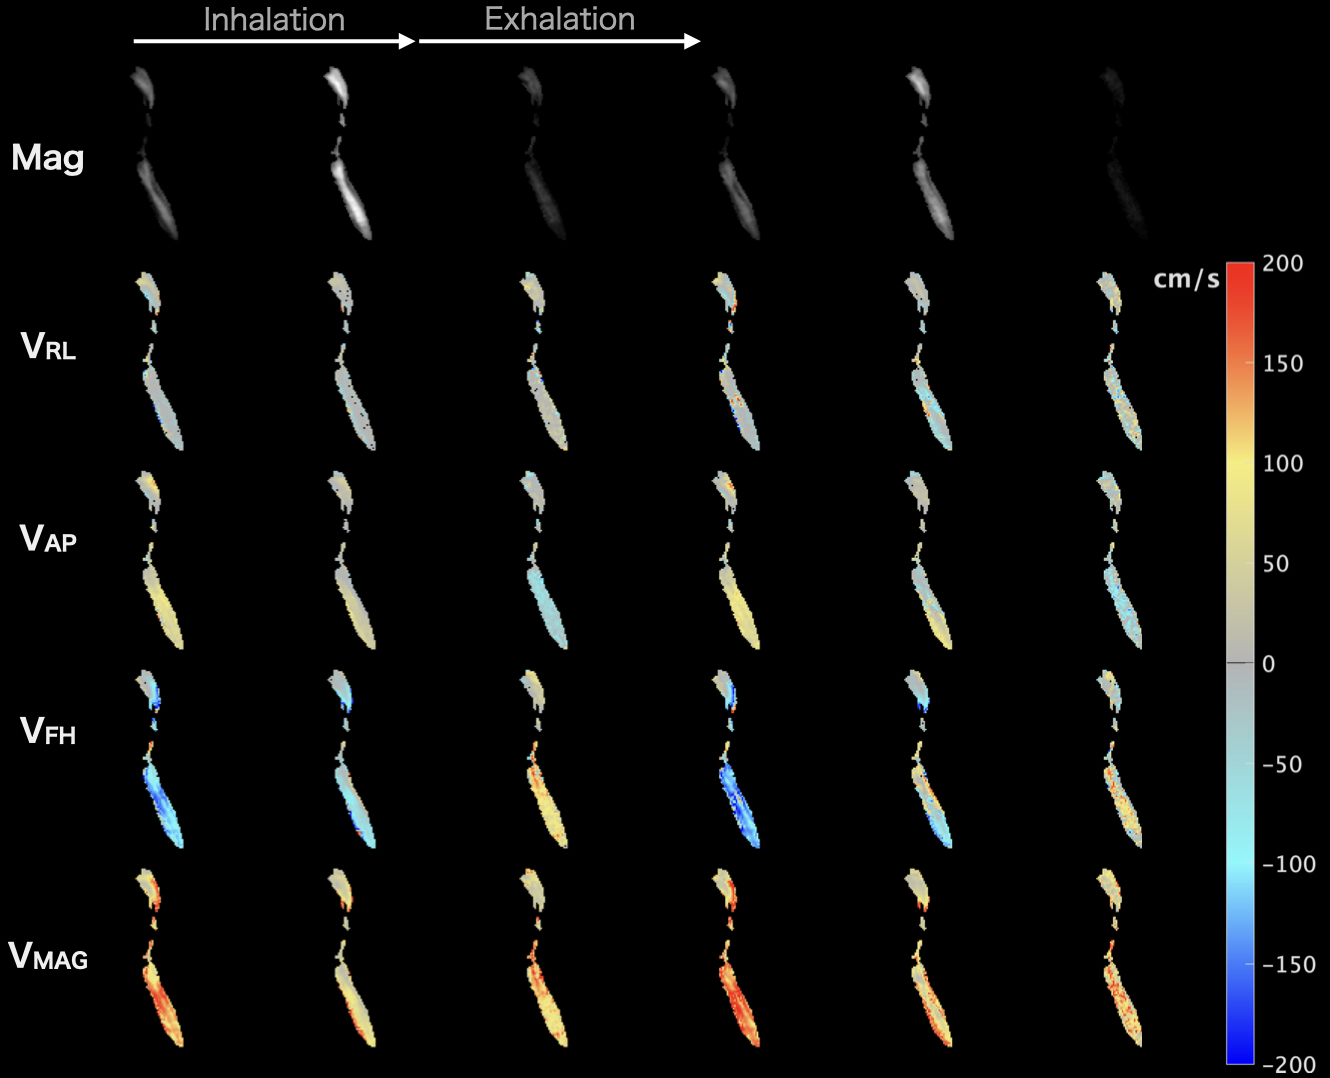
Figure 2: 129Xe signal magnitude (Mag) and velocity maps of flow in the three anatomical directions; right-left (vRL), anterior-posterior (vAP), foot-head (vFH) acquired during two breathing cycles (temporal resolution; 𝛥t ~1 s). In the foot-head direction, inspiratory flow is indicated by negative values (blue) and expiratory flow by positive values (red); in the anterior-posterior direction, anteriorposterior flow is indicated by positive values (red) and posterioranterior flow by negative values (blue).
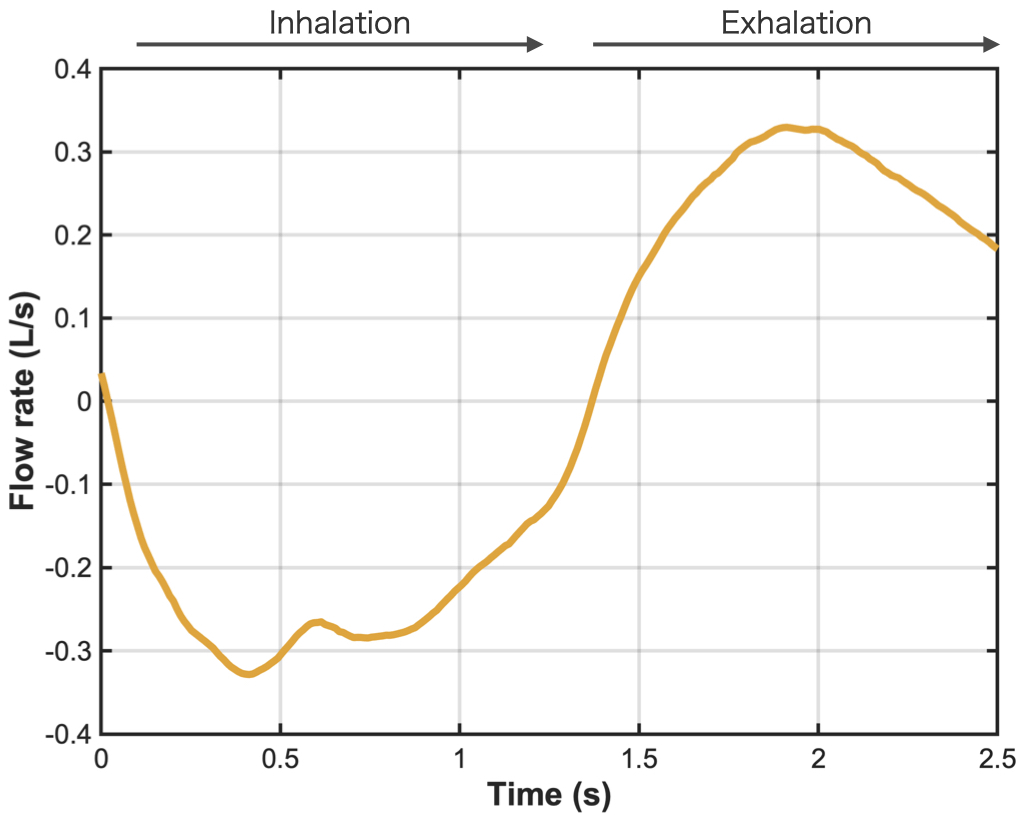
Figure 3: Respiratory flow-time curve measured at the mask by pneumotachograph, showing the inspiration / expiration cycle for the patient whose 129Xe PC MRI data are shown in Figures 1, 2.