0574
In vivo pH imaging in rats using [1,5-13C2]Z-OMPD1Department of Nuclear Medicine, Technical University of Munich, Munich, Germany
Synopsis
We introduce hyperpolarized [1,5-13C2]Z-OMPD as a novel in vivo pH sensor. Upon synthesis from ethyl pyruvate, the molecule appears to be non-toxic and shows good hyperpolarization properties, as indicated by high polarization levels and long T1 relaxation times for both 13C-labels. 13C-chemical shifts show good pH sensitivity in the physiological range, which enables pH imaging in vitro of human blood phantoms of different pH. In vivo pH imaging upon injection in rats reveals previously reported pH compartments in kidneys. It is further demonstrated, that the OMPD1 peak can be used as internal reference, further facilitating the process.
Introduction
Several diseases such as cancer or renal failure often induce local tissue pH changes, creating a clinical need for its in vivo detection1. Hyperpolarized (HP) molecules currently used for non-invasive pH-imaging are limiting the resolution and SNR of the technique due to their relatively short signal lifetime2. Here, we introduce hyperpolarized [1,5-13C2](Z)-4-methyl-2-oxopent-3-enedioic acid (13C-OMPD) as a novel in vivo pH-sensor. We synthesized the pure 13C-labelled compound and evaluate pH sensitivity, hyperpolarization properties and pH imaging in vitro and in vivo.Methods
Synthesis: Performed similar to Rios et. al3, using [1-13C]ethyl pyruvate as a precursor.Blood Phantoms: Human blood samples were titrated using 30% HCl.
Hyperpolarization: 27 mg 13C-OMPD and 24 mg 13C-urea were co-polarized by DNP. Dissolution was performed using D2O or H2O with 80 mM TRIS, 124 mM NaOH, 0.3 mM Na2EDTA resulting in final concentrations of 50 mM 13C-OMPD and 100 mM 13C-urea.
HP MRSI: in vivo HP MRSI was performed using a FIDCSI starting 10 s after end of injection with FA 15°, TR 83.1 ms, matrix size 18x14, slice thickness 5 mm, FOV 54x42 mm², BW 3201 Hz, 256 spectral points.
Data Processing: Processing of spectra, zero filling of imaging data and fitting of the difference of 13C5-OMPD-peak (OMPD5) with respect to the 13C-urea peak or 13C1-OMPD-peak (OMPD1) to calculate pH-maps was performed in MatLab.
Results
13C-OMPD (Fig. 1a) exhibits total pH-dependent chemical shifts of 2.7 ppm (OMPD5) and 0.4 ppm (OMPD1) in the physiologically and pathologically relevant pH range (5.6 – 7.8) (Fig. 1b, c).Using dissolution DNP, a liquid state polarization level of 17 - 26% was achieved, decaying with long T1 (up to 138 s) as observed at 1 T and 7 T both in D2O and blood (Fig. 2a). An exemplary RF-depletion-corrected HP signal decay curve is shown in figure 2b.
Imaging of pH in titrated blood phantoms shows good contrast confirmed by electrode pH values (Fig. 3a, b).
In vivo pH imaging in rats (n=9, Fig. 4) shows excellent SNR of both 13C-labels and distribution of OMPD in the body. The tracer was well tolerated by all animals. Generation of pH maps reveals physiological values in most of the observed tissue (pH=7.41 ± 0.04, n=4). pH mapping in kidneys shows three pH compartments which could be assigned to the ureter (6.46 ± 0.07, n=9), the medulla (6.95 ± 0.06, n=9) and the cortex (7.42 ± 0.04, n=9).
pH mapping by referencing the OMPD5 peak to the OMPD1 peak yielded a comparable image as pH mapping by referencing the OMPD5 peak to the urea peak (Fig. 5a, b). pH values of three macroscopic pH compartments in the kidneys agree within the error range (Fig. 5c).
Discussion
As indicated by the pKa=6.54 of the C5-carboxyl proton (Fig. 1a), 13C chemical shifts of [1,5-13C2]Z-OMPD exhibit strong pH sensitivity in the physiologically relevant pH range, rendering it suitable for detection of in vivo occurring pH values.13C-OMPD exhibits a high polarization level for both 13C-labels and long T1, comparable to [1-13C]pyruvate. In D2O at 1 T, 138 s was measured, which is one of the highest T1 for 13C-nuclei ever observed so far4,5. The T1 is superior compared to previously used 13C-hyperpolarized pH sensors, increasing the robustness of the technique, and enabling further imaging possibilities such as prolonging the perfusion time or increasing the spatial resolution2,6.
HP pH-imaging experiments proved the feasibility of quantitative pH mapping in vitro in human blood phantoms (Fig. 3) and in vivo in kidneys of healthy rats (Fig. 4). The three detected pH compartments in the kidneys agree well with previously reported values6,7.
A comparison of pH mapping approaches, performed either by referencing the OMPD5 peak to the urea peak (Fig. 5a) or to the OMPD1 peak (Fig. 5b) shows good spatial and quantitative (Fig. 5c) agreement, thereby validating the approach of using 13C-OMPD as a pH sensor with an internal reference. For generating the image shown in figure 5b, the OMPD1 chemical shift was assumed to be insensitive to pH and constant at its position at pH=7.4. However, since the OMPD1 exhibits a slight pH-dependent shift (Fig. 1c), a systematical error is added by this assumption. Assuming a linear pH shift of the OMPD1 peak, the maximum error is calculated to be 0.14 pH units per pH deviation from physiological pH. Within one kidney voxel, a maximum acidification of 0.2 pH units can be reasonably assumed, since the physiological pH compartment (cortex) dominates the signal (Fig. 4c), corresponding to an error of 0.03 pH units for the presented kidney experiments, which can be tolerated for quantitatively accurate pH imaging.
Conclusion
We introduce 13C-OMPD as a new pH sensor molecule for in vivo pH imaging. The synthesized compound shows good hyperpolarization properties, long T1 and good pH sensitivity in the physiological range. pH imaging in vitro shows quantitative agreement with electrode pH and high-resolution in vivo pH imaging shows good agreement with previous pH measurements in healthy kidneys as well as the ability to use the OMPD1 peak as an internal reference instead of 13C-urea6,7.Acknowledgements
We acknowledge support from the Deutsche Forschungsgemeinschaft (DFG, German Research Foundation– 391523415, SFB 824).This project has further received funding from the European Union’s Horizon 2020 research and innovation program under grant agreement No 820374.References
- Granja S., Tavares-Valente D., 2017, 'Value of pH regulators in the diagnosis, prognosis and treatment of cancer', Seminars in Cancer Biology, 43, 17-34, Amsterdam - Netherlands: Elsevier Inc.
- Anemone A., 2019 'Imaging tumor acidosis: a survey of the available techniques for mapping in vivo tumor pH', Cancer metastasis reviews 38.1-2
- Rios Andro C., Bera Partha P., 2020, 'Pyruvate Aldol Condensation Product: A Metabolite That Escaped Synthetic Preparation for Over a Century', ACS Omega, 5 (25), S. 15063–15068, Washington, D.C.: American Chemical Society
- Hundshammer C., Duewel S., 2017, 'Imaging of Extracellular pH Using Hyperpolarized Molecules', Israel Journal of Chemistry, 57.9, pp. 788–799, Israel: Wiley-VCH
- Wang Z., 2019, 'Hyperpolarized 13C MRI: State of the Art and Future Directions', Radiology, 291.2, Oak Brook: Radiological Society of North America
- Duewel S., Hundshammer C., 2017, 'Imaging of pH in vivo using hyperpolarized 13C‑labelled zymonic acid', Nature Commun., 8, 15126, London - UK: Nature Publishing Group
- Natarajan Raghunand, 2003, 'Renal and systemic pH imaging by contrast enhanced MRI', Magnetic resonance in medicine, 49.2, pp. 249–257., Hoboken: Wiley
Figures
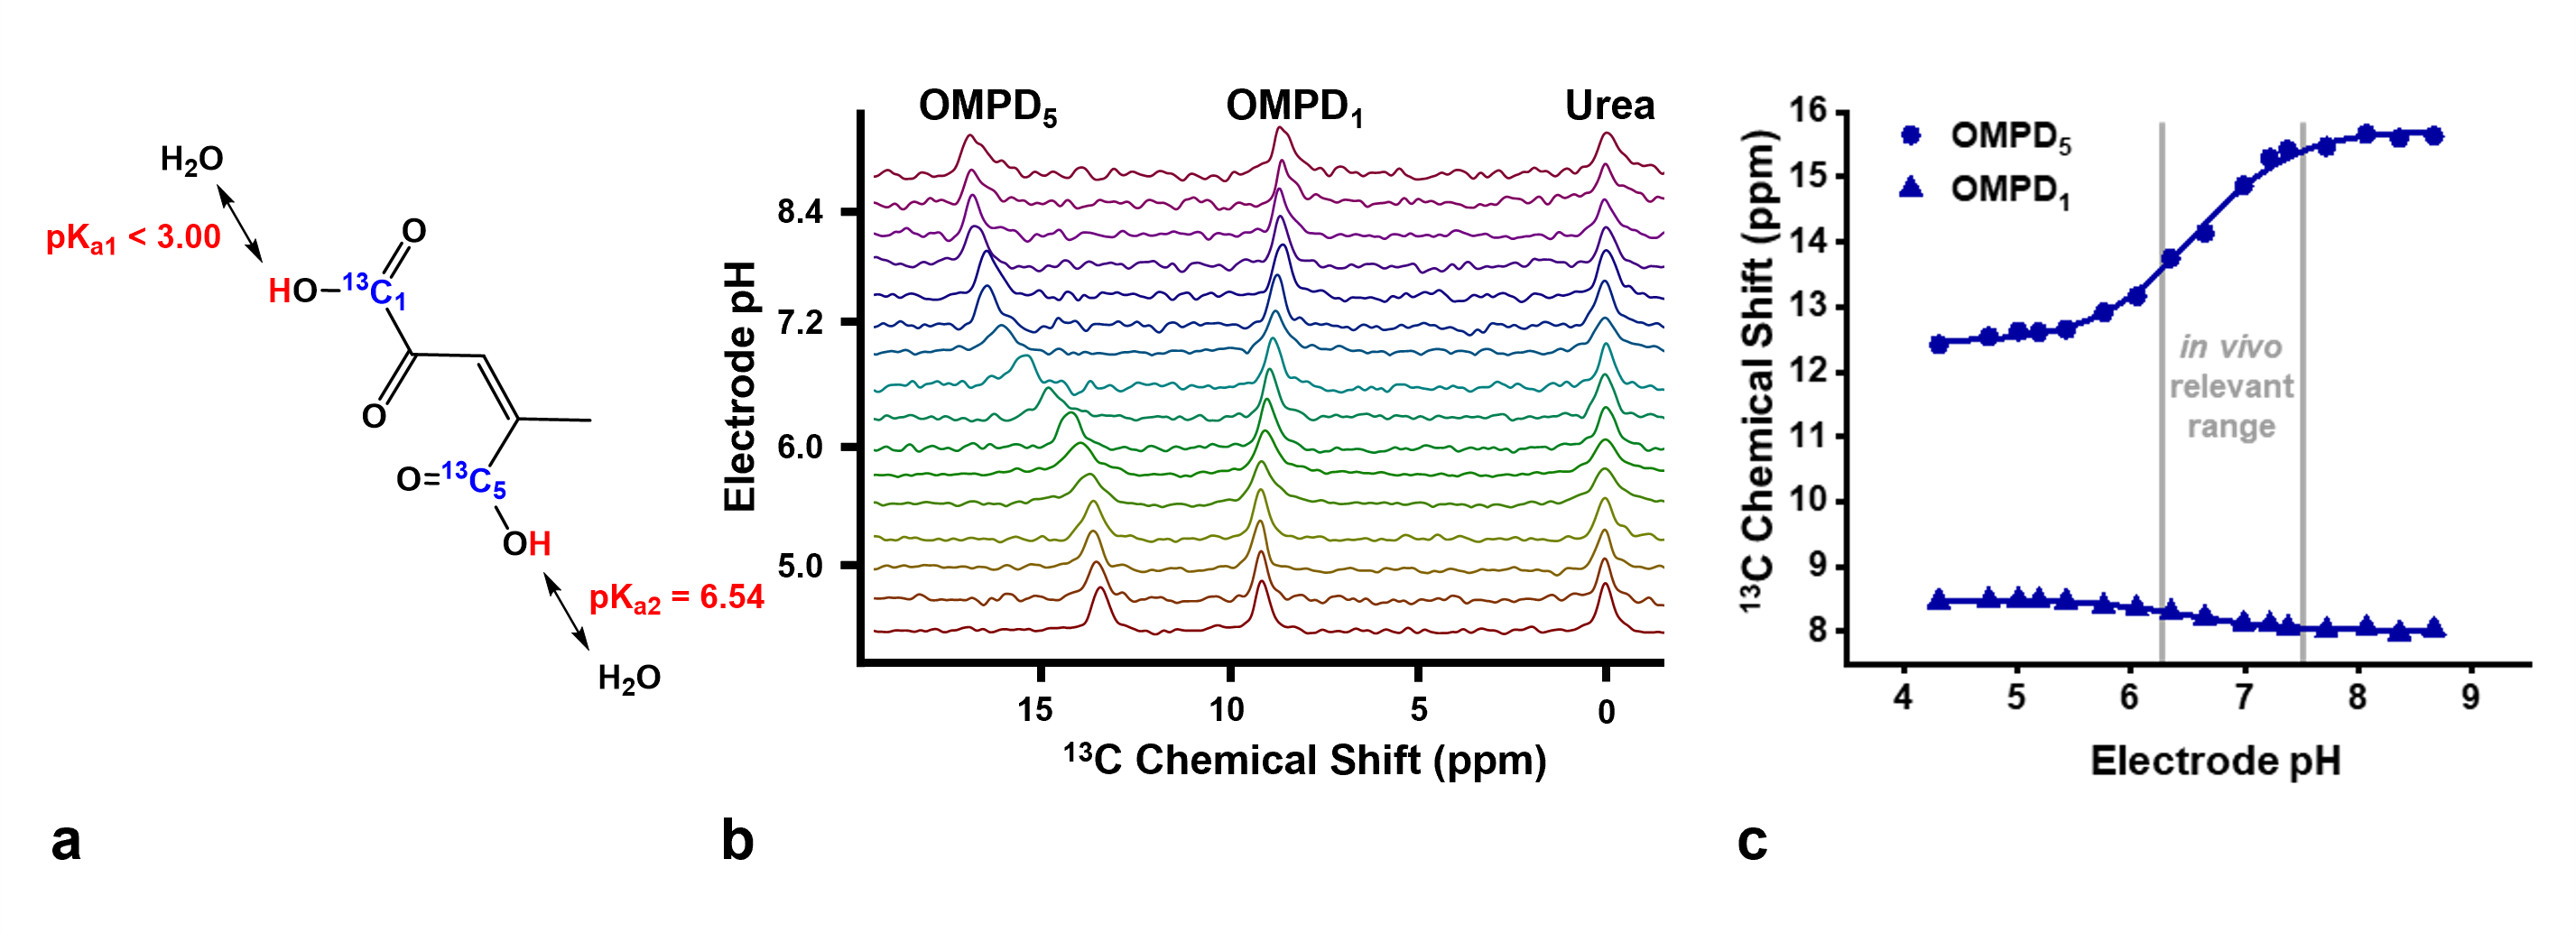
a: 13C-OMPD bears two exchangeable protons in carboxyl groups, one of them at C5 with pKa2=6.54, indicating pH sensitivity in the physiological range.
b: 13C-spectra of 13C-OMPD and 13C-urea at different pH values. A pH dependent shift of the two 13C-peaks with respect to the pH-insensitive 13C-urea-peak is observable.
c: The fit of a scaled logistic function to the peak positions from b results in a calibration curve with a direct dependence between the chemical shifts of 13C-OMPD and pH.
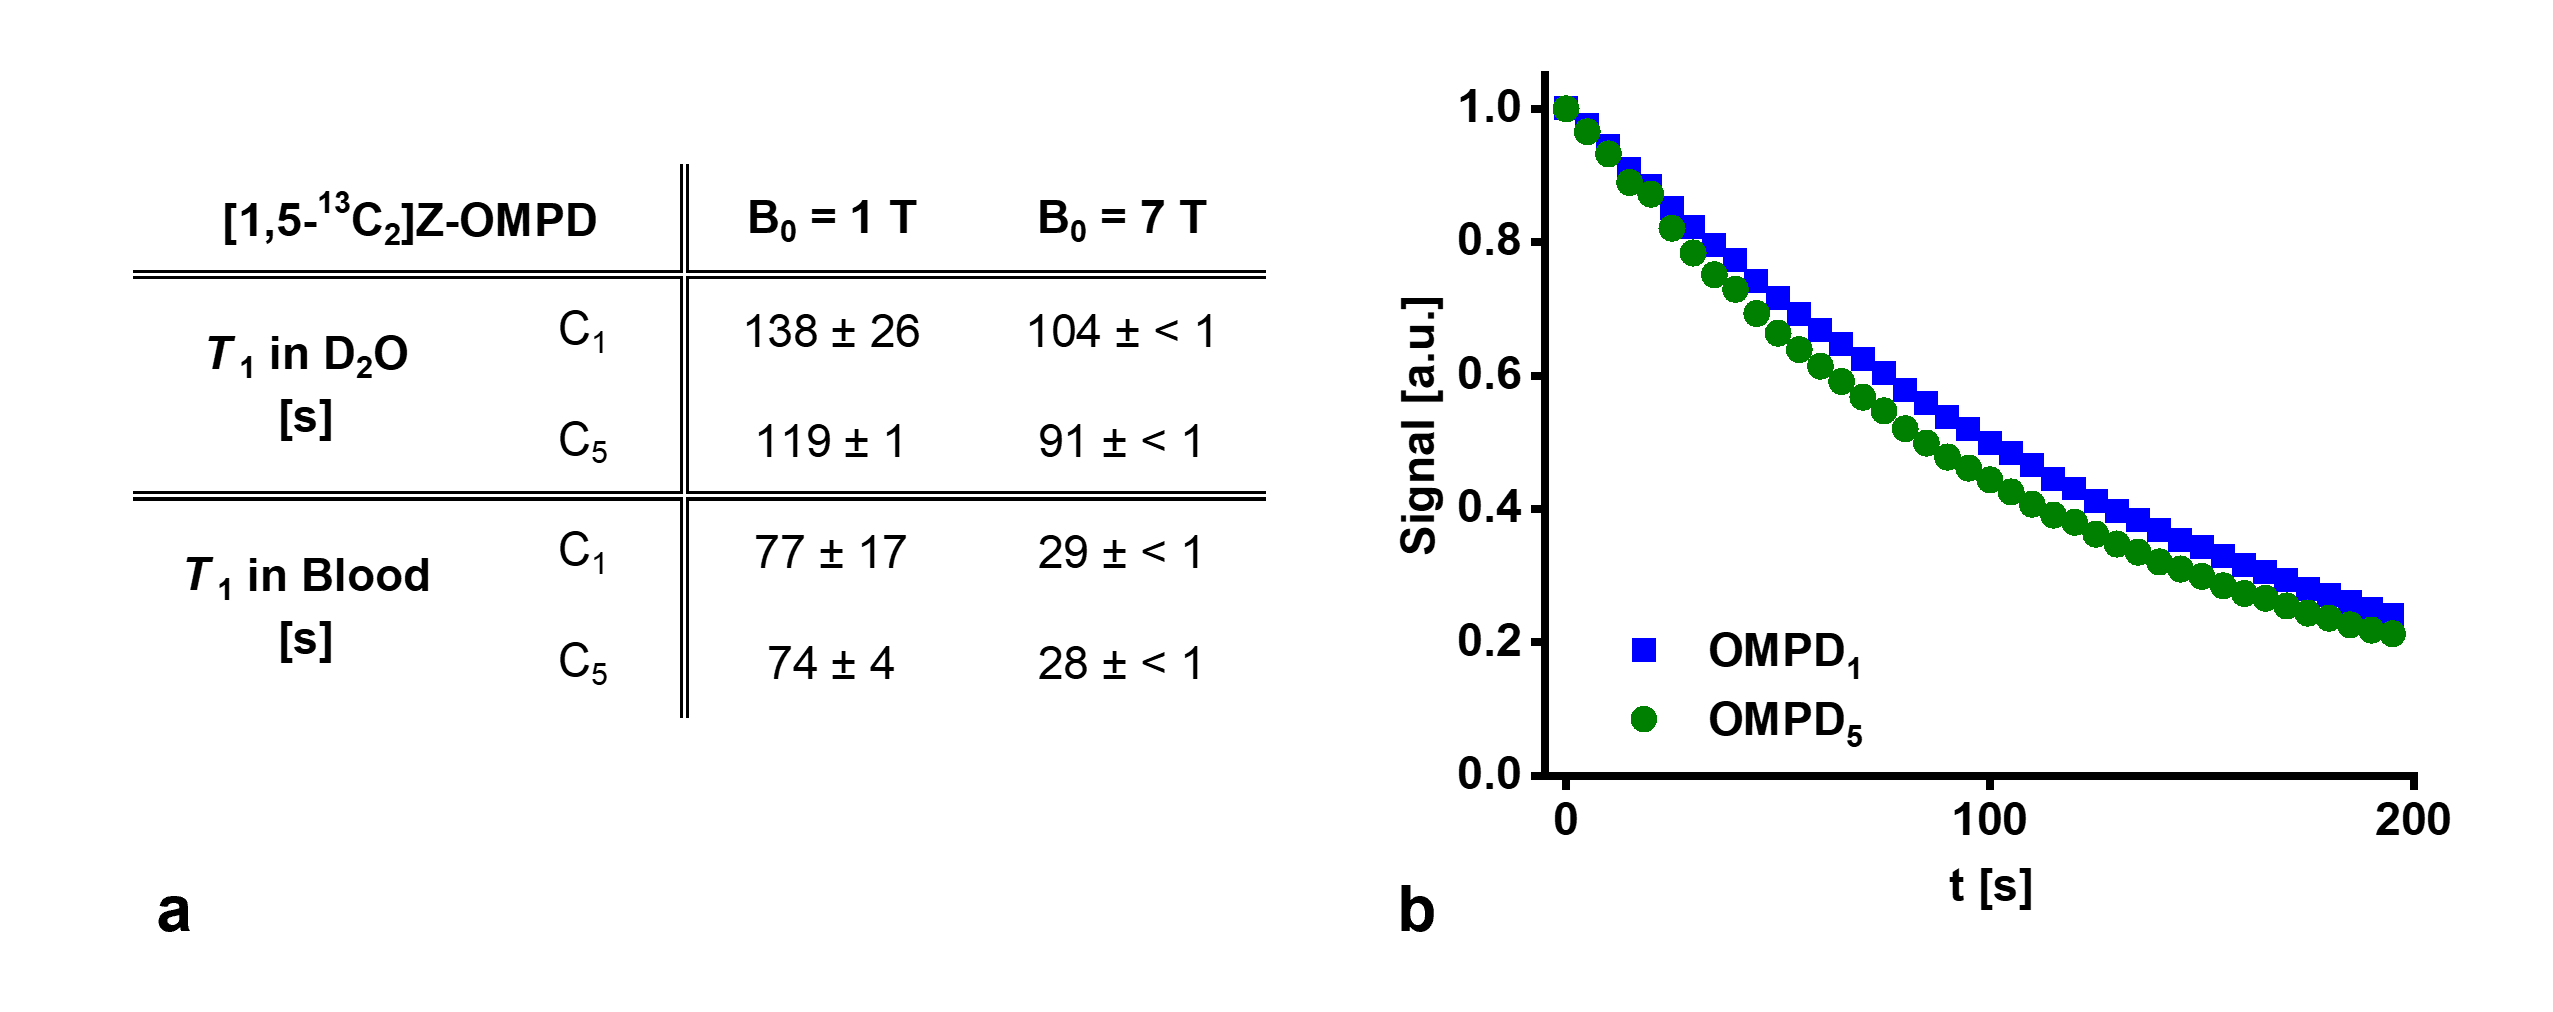
a: T1 relaxation time constant of 13C-labels of Z-OMPD in blood and in D2O at magnetic field strengths of 1 T and 7 T.
b: Flip-angle corrected decay curve of the liquid state polarization of [1,5-13C2]Z-OMPD at 1 T in D2O.
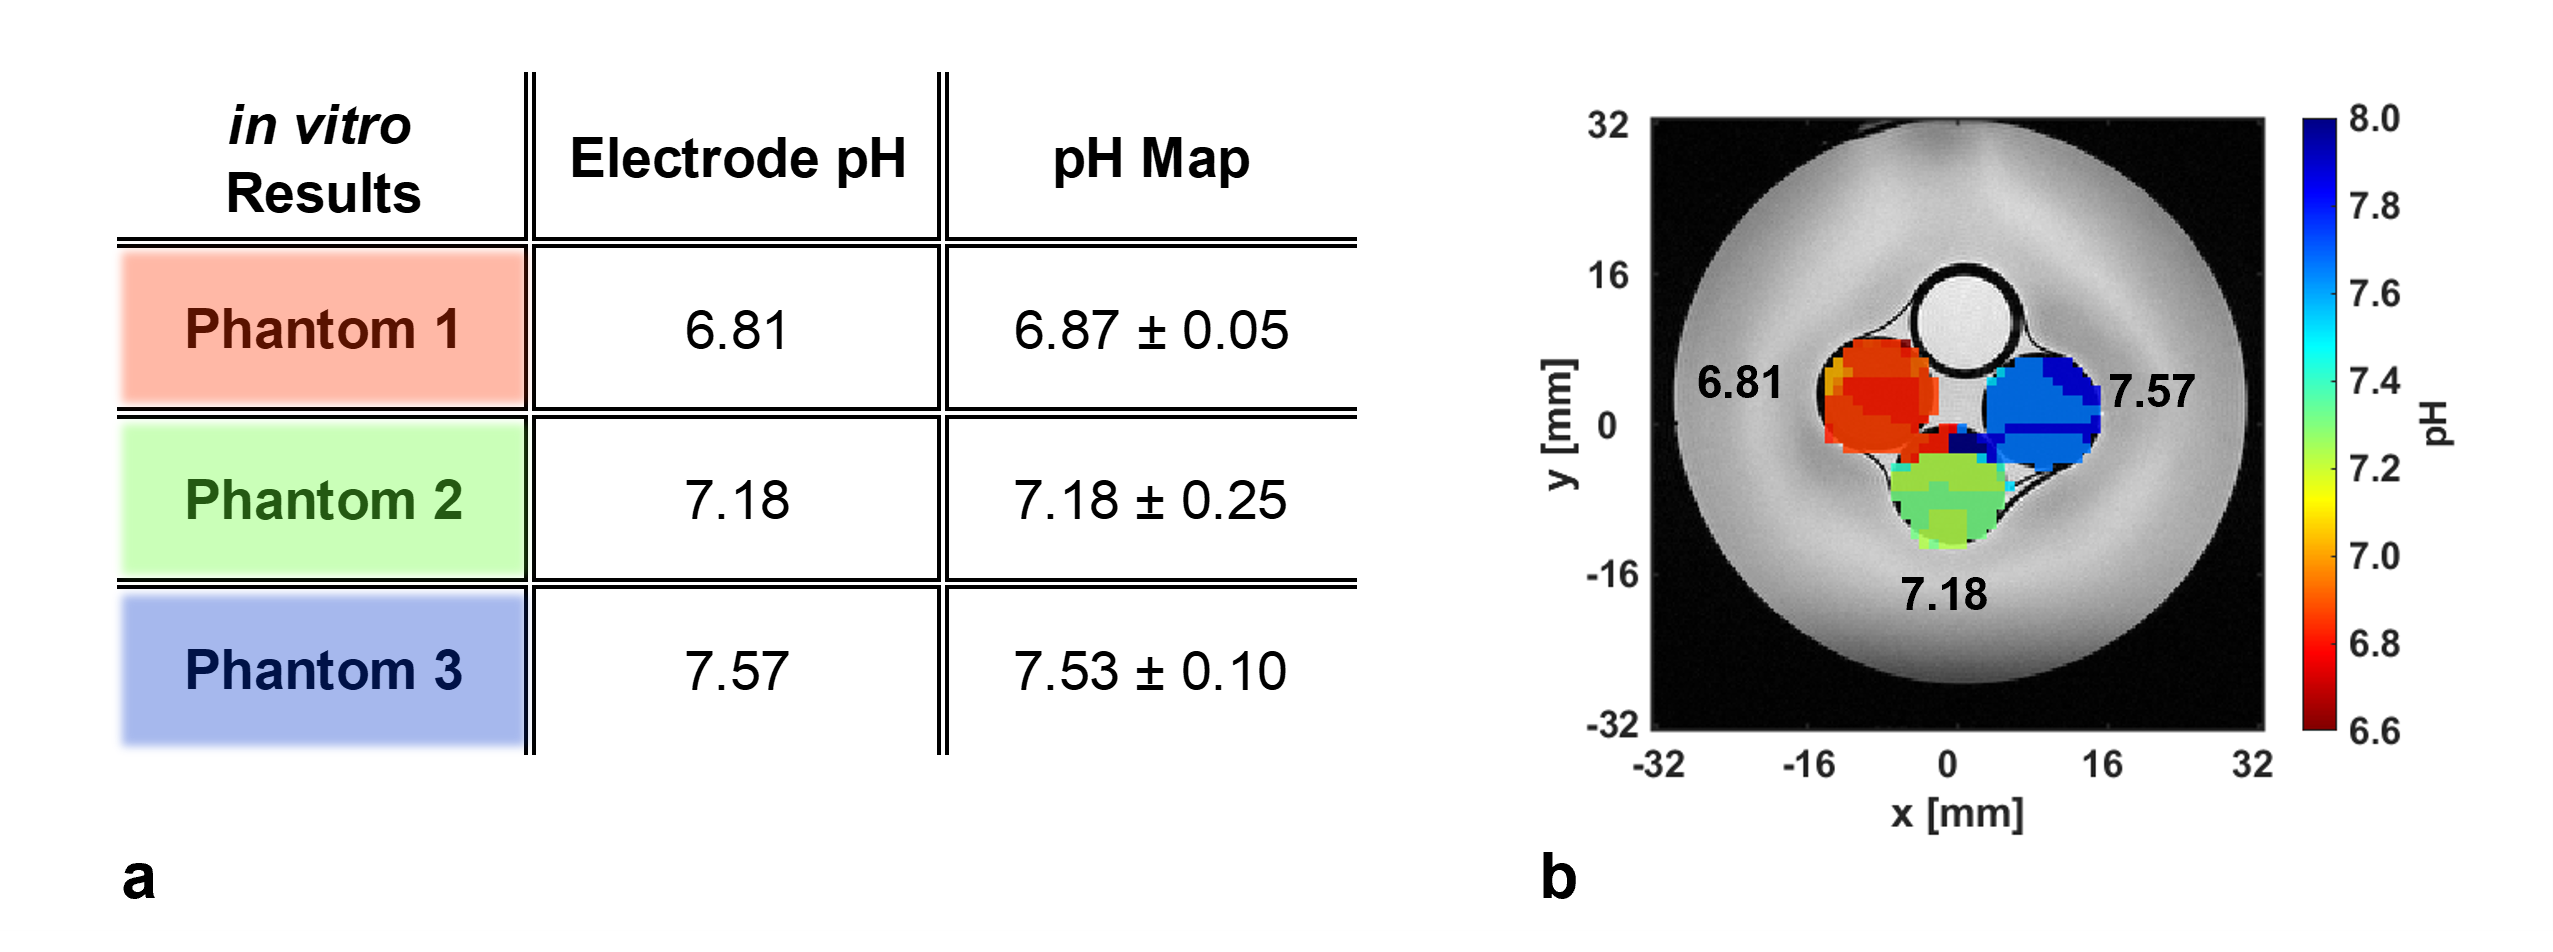
a: pH values in the three blood phantoms, measured by a conventional pH electrode, and mean pH values in the phantom ROIs, calculated from the generated pH map. The phantom color corresponds to the color in figure b.
b: Anatomical T2-weighted image of three blood phantoms prepared at different pH values (black) and a 13C-urea phantom overlaid with a pH map.
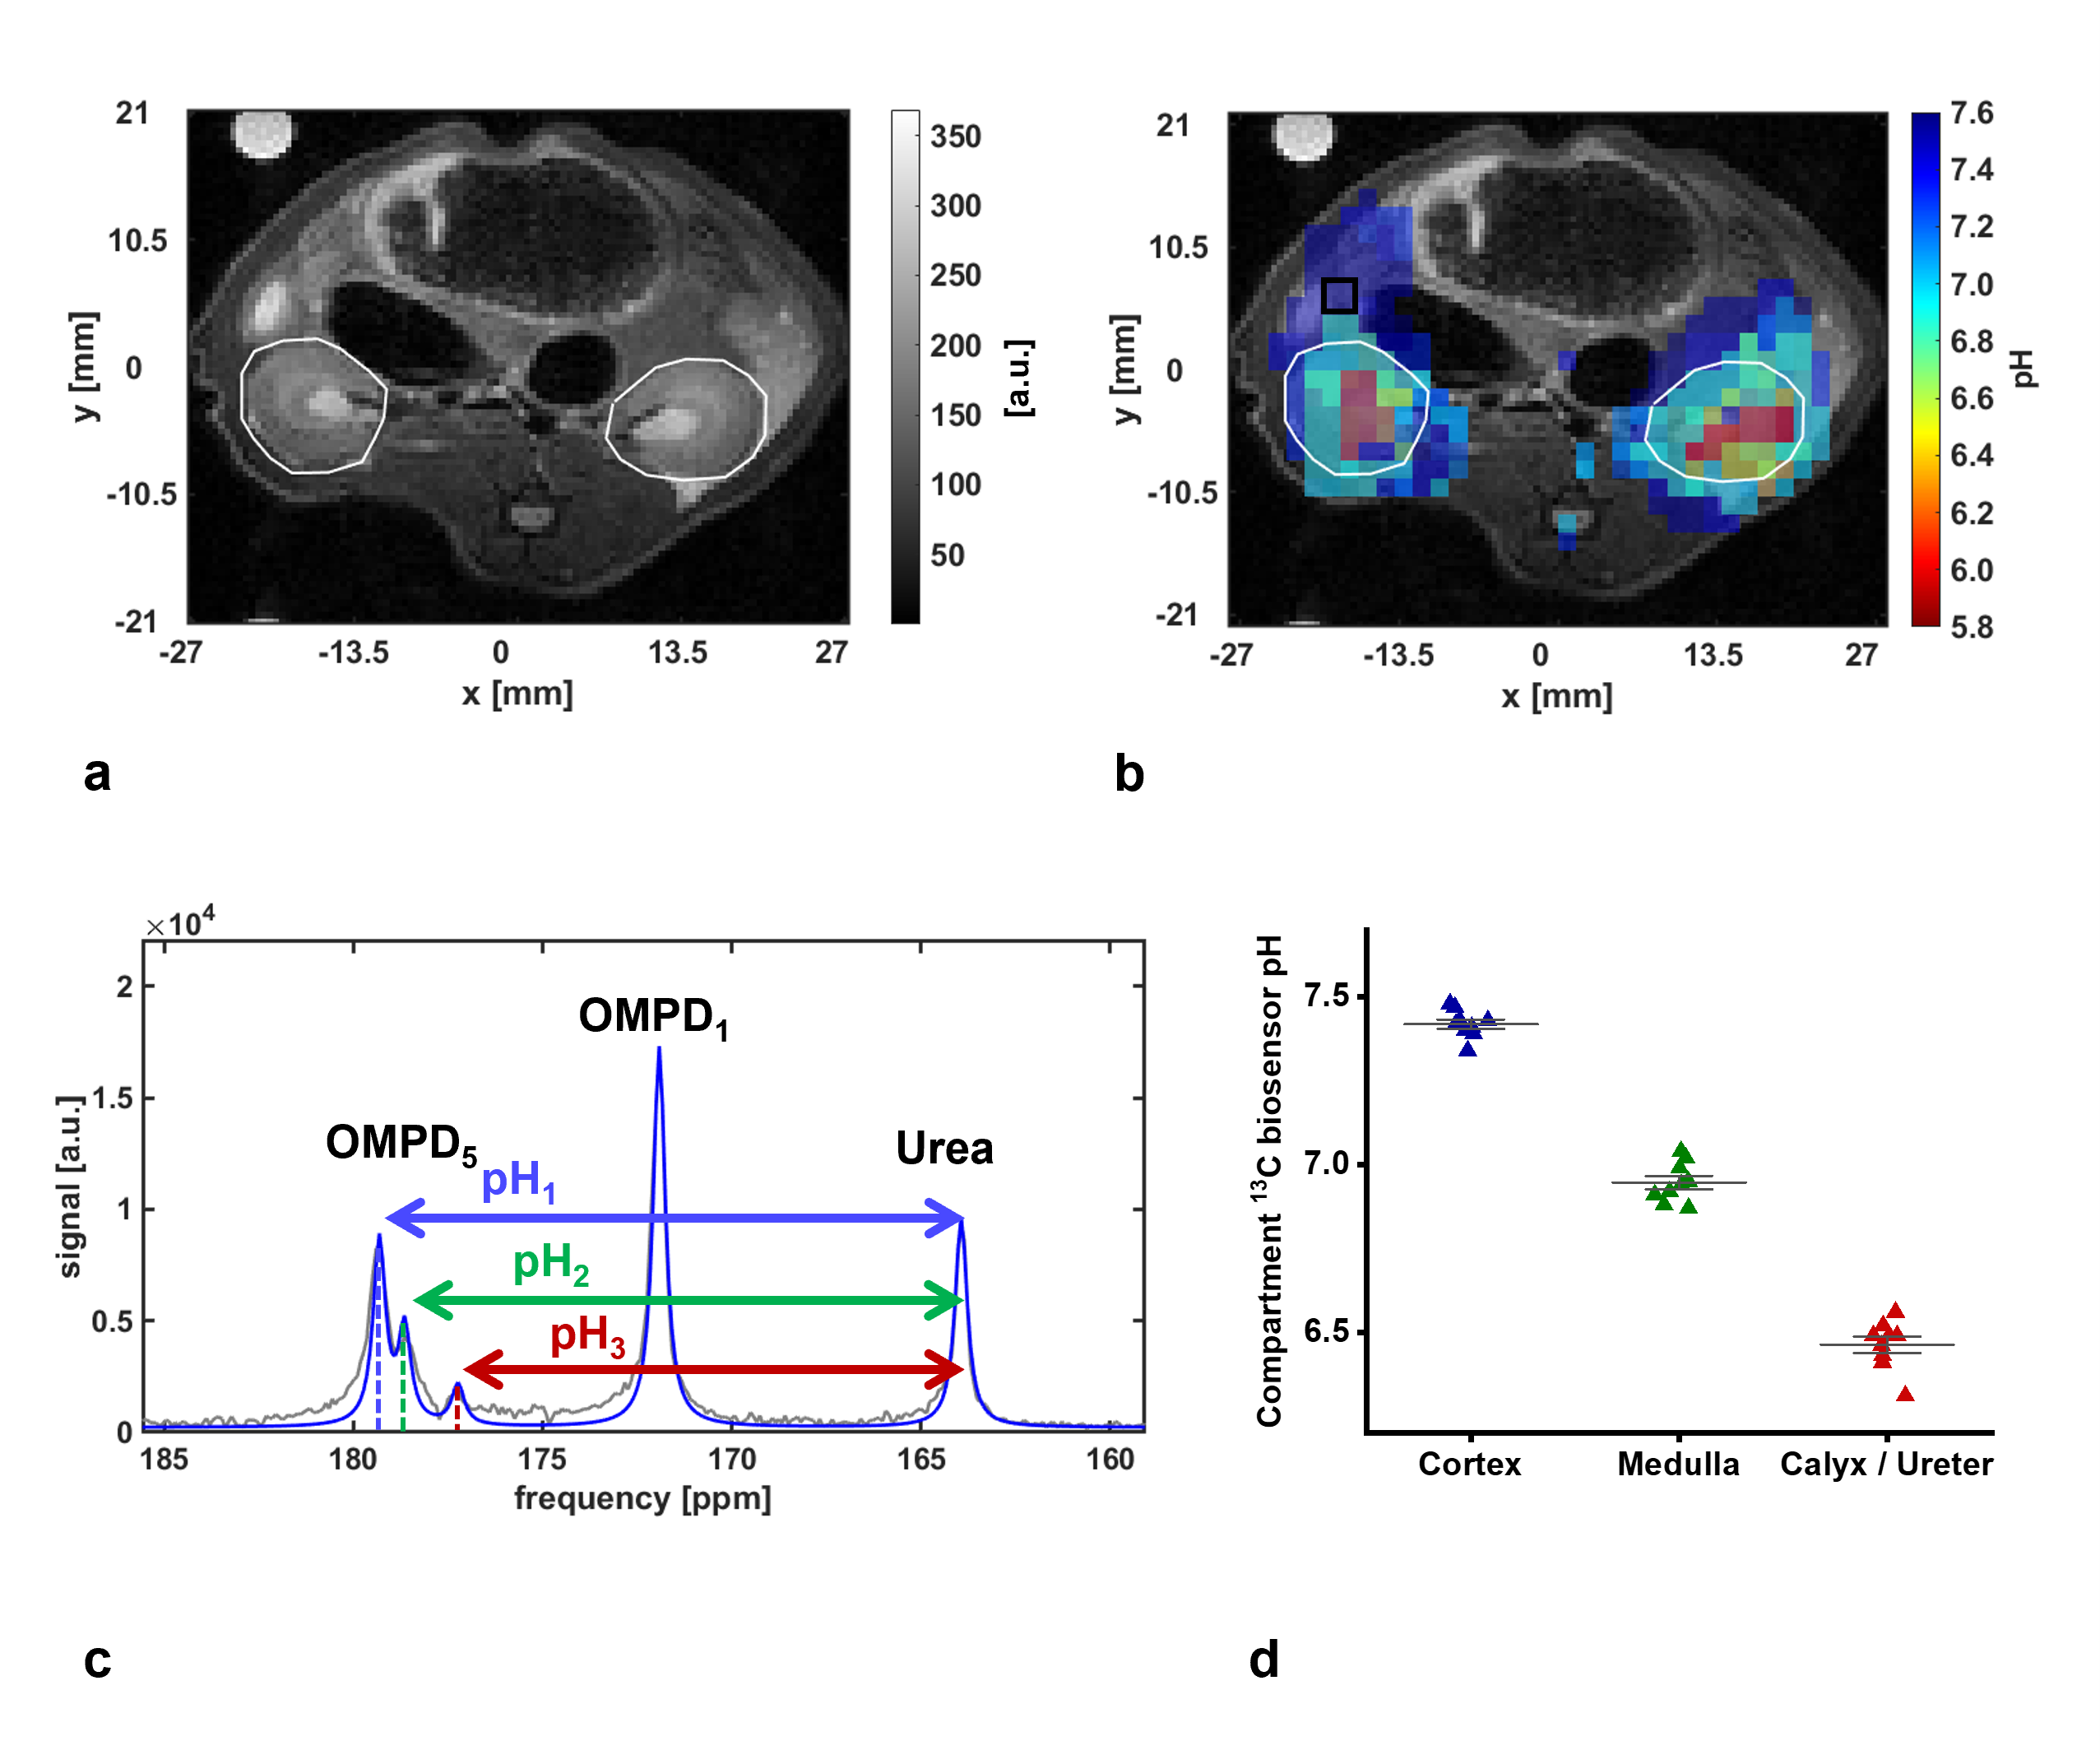
a: Anatomical T2-weighted image of kidneys (white ROIs) in a healthy rat.
b: Image of a, overlaid with three pH maps, generated from the three detected pH-compartments of the kidney.
c: 13C-NMR spectrum of a single voxel inside a kidney, overlaid by a fit (blue). A splitting of the OMPD5 peak due to pH compartmentation (cortex = pH1, medulla = pH2, calyx/ureter = pH3) in the kidneys is observable.
d: Compartment pH values detected using [1,5-13C2]Z-OMPD in kidneys of n=9 rats.
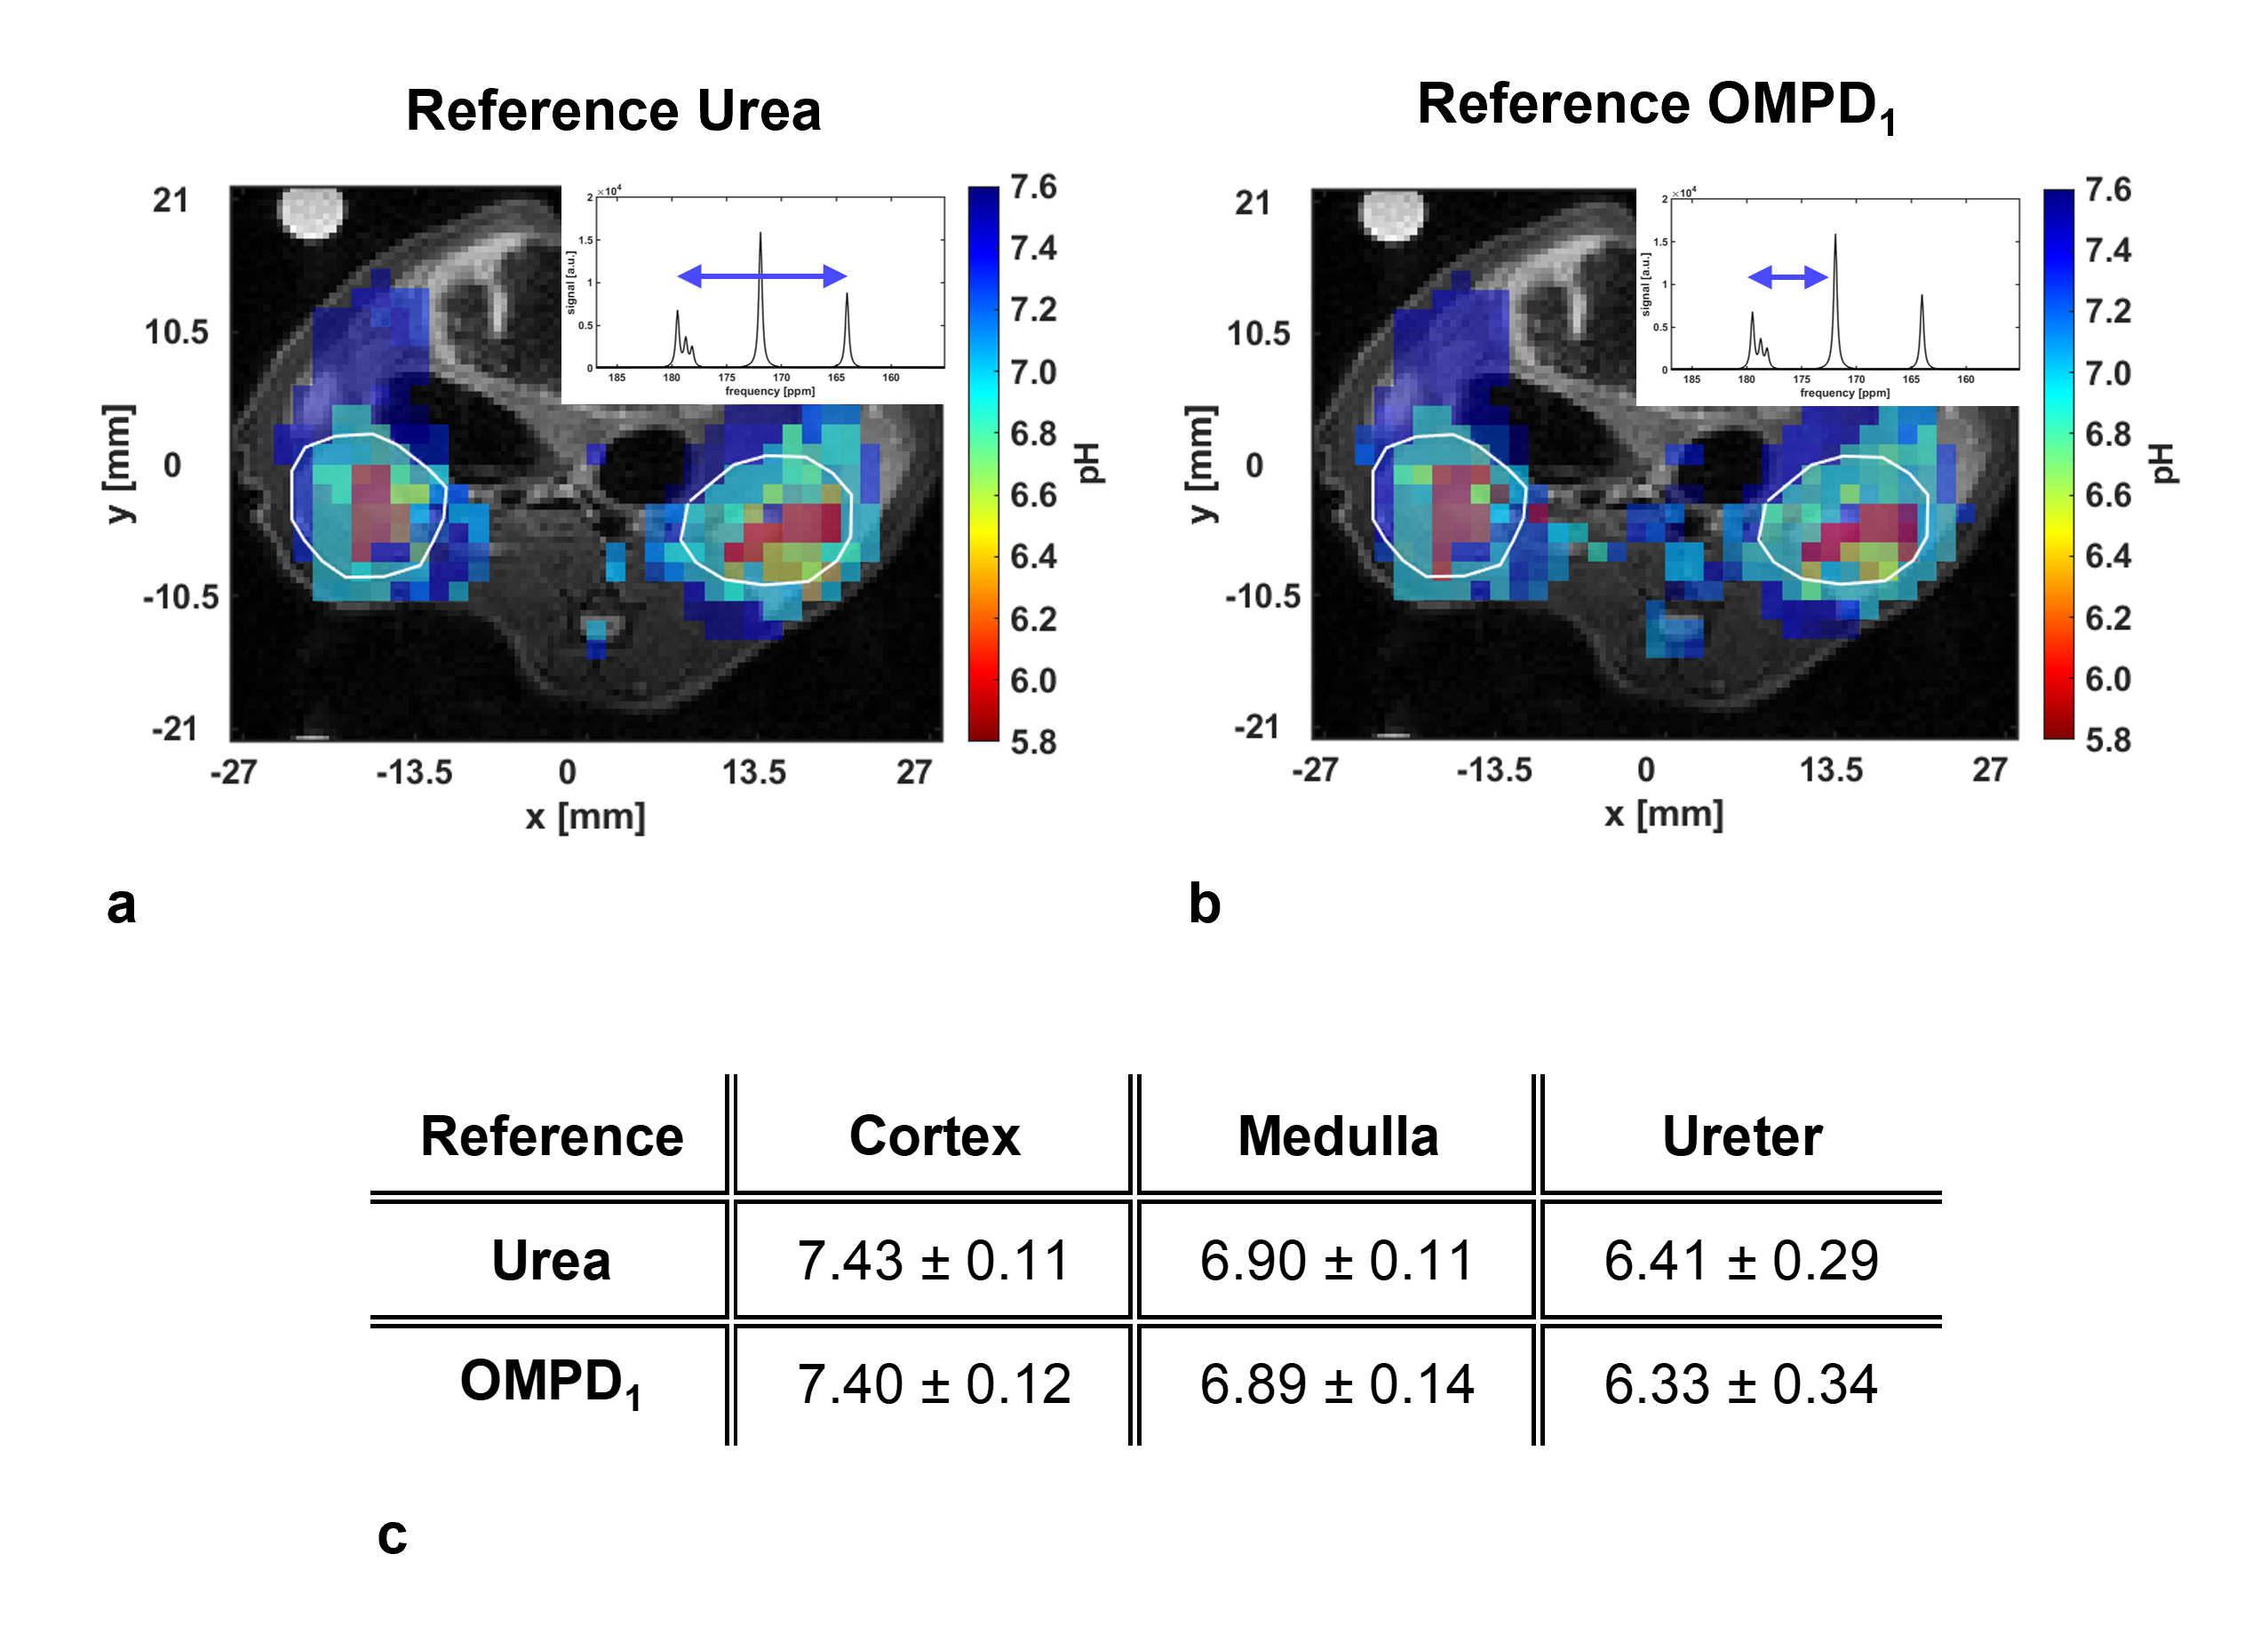
a: Three overlaid pH maps, generated from the three detected pH-compartments of the kidney (white ROIs), using urea as a reference.
b: Three overlaid pH maps, generated from the three detected pH-compartments of the kidney (white ROIs), using OMPD1 as a reference.
c: pH values of the macroscopic pH compartments in the kidney, calculated by taking urea or OMPD1 as a reference.