0571
Methodological advances in serial hyperpolarized carbon-13 (HP-13C) metabolic imaging of patients with glioma1Department of Radiology and Biomedical Imaging, University of California San Francisco, San Francisco, CA, United States, 2Department of Neurological Surgery, University of California San Francisco, San Francisco, CA, United States, 3Department of Neurology, University of California San Francisco, San Francisco, CA, United States, 4Department of Bioengineering and Therapeutic Sciences, University of California San Francisco, San Francisco, CA, United States
Synopsis
This study aimed to improve hyperpolarized carbon-13 (HP-13C) metabolic imaging methodologies for serial monitoring of patients with malignant brain tumors. Several analyses were pursued among 29 patients diagnosed with gliomas and 7 volunteers. Implementation of atlas-based prescription of echo-planar imaging (EPI) demonstrated consistent volumetric coverage (dice:0.967-0.978) and improved hemispheric symmetry in modeled kinetics(p=0.006), which helped highlight tumor. A 2s versus 5s acquisition delay post injection of tracer increased the capture of [1-13C]pyruvate inflow dynamics(p=0.04), while reducing simulated kinetic modeling error. Post-acquisition FID-CSI spectra demonstrated improved referencing of [1-13C]pyruvate f0 using water versus a coil-embedded urea phantom(p=0.00003), thereby maximizing EPI excitation.
Introduction
Gliomas comprise a family of malignant brain tumors whose response to treatment is often challenging to assess amid a background of nonspecific changes on conventional anatomical imaging. With the recent success in using hyperpolarized carbon-13 (HP-13C) MRI techniques to probe glioma metabolism1-4, there has been a drive toward improving capabilities for monitoring disease serially. In this work, we implemented an automated atlas-based prescription5 of HP-13C echo-planar imaging (EPI) to ensure consistent volumetric coverage across exams and match 1H spectroscopy orientation, alongside other methodological advances.Methods
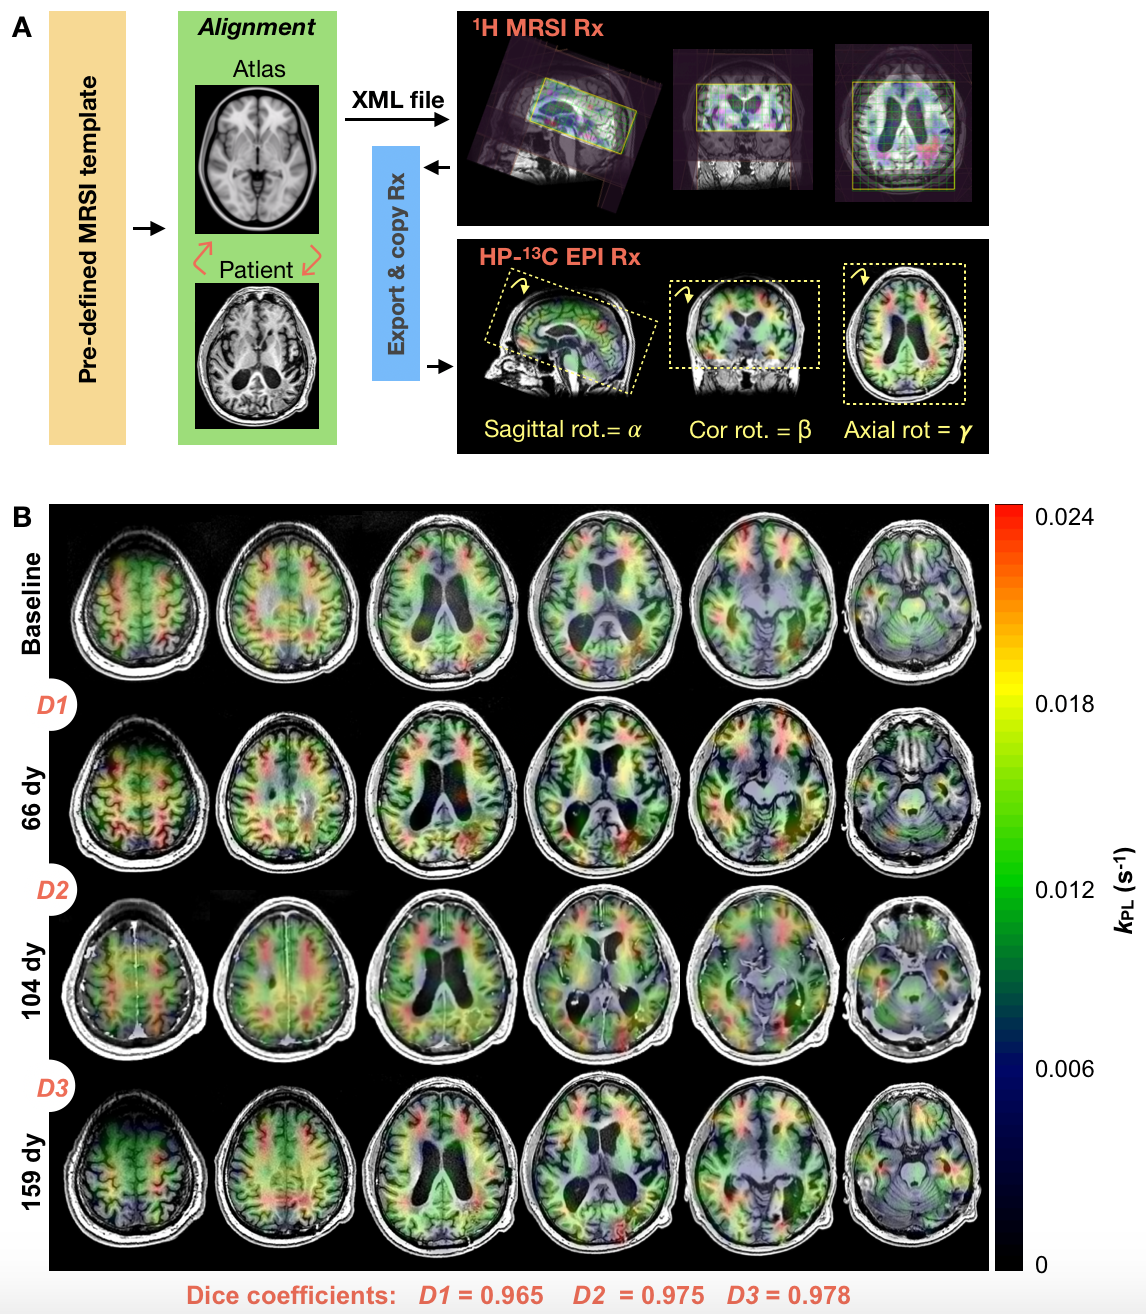
Study Overview. Analysis of 29 patients previously diagnosed with glioma and 7 healthy volunteers included: atlas-based versus manual/axial HP-13C EPI prescription (3 patients; 14 exams); 2s versus 5s EPI acquisition delays triggered post HP tracer injection (31 subjects; 82 exams); and comparison of pyruvate frequency referencing methods5 (36 subjects; 106 exams).Atlas-based HP-13C EPI. Dynamic HP-13C imaging was performed on a 3T MR750 scanner with a dual-tuned 24/8-channel 13C/1H phased-array receiver. Data were acquired using a frequency-specific 2-D multislice EPI sequence7 (TR/TE=62.5ms/21.7ms, 8 slices, 20 timepoints, 3s temporal resolution) that featured 1.5cm isotropic resolution and constant 𝛼pyruvate/𝛼lactate/𝛼bicarbonate = 20o/30o/30o flip angle scheme. Automated prescription entailed 1) registering T1 pre-contrast images to the MNI1525 brain atlas, 2) transforming pre-defined 1H point-resolved spectroscopy (PRESS) coverage templates back to patient space; 3) exporting the 3-plane oblique orientation as an XML file5; and 4) extracting the center/orientation for EPI (Fig. 1A). A SPINlab system provided dynamic nuclear polarization of [1-13C]pyruvate; 0.43mL/kg was intravenously injected at 5mL/s, followed by 20mL saline2.
HP-13C Post-processing. EPI data were prewhitened8, channel-combined using complex weights from the fully sampled pyruvate signal9, phased and denoised10. Combined kinetic modeling of pyruvate-to-lactate (kPL) and pyruvate-to-bicarbonate (kPB) conversion was performed on dynamic data using an inputless model11.
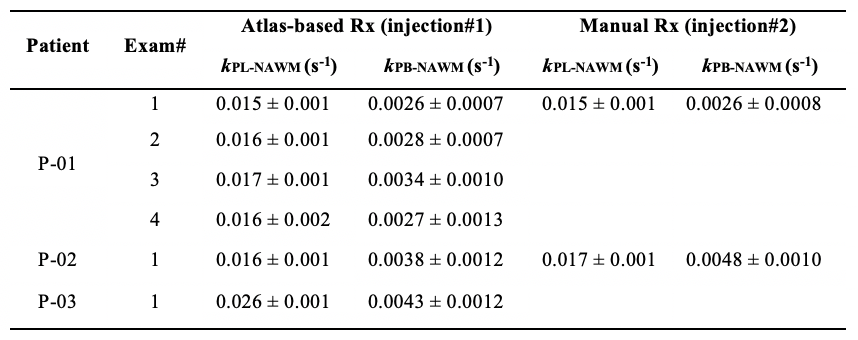
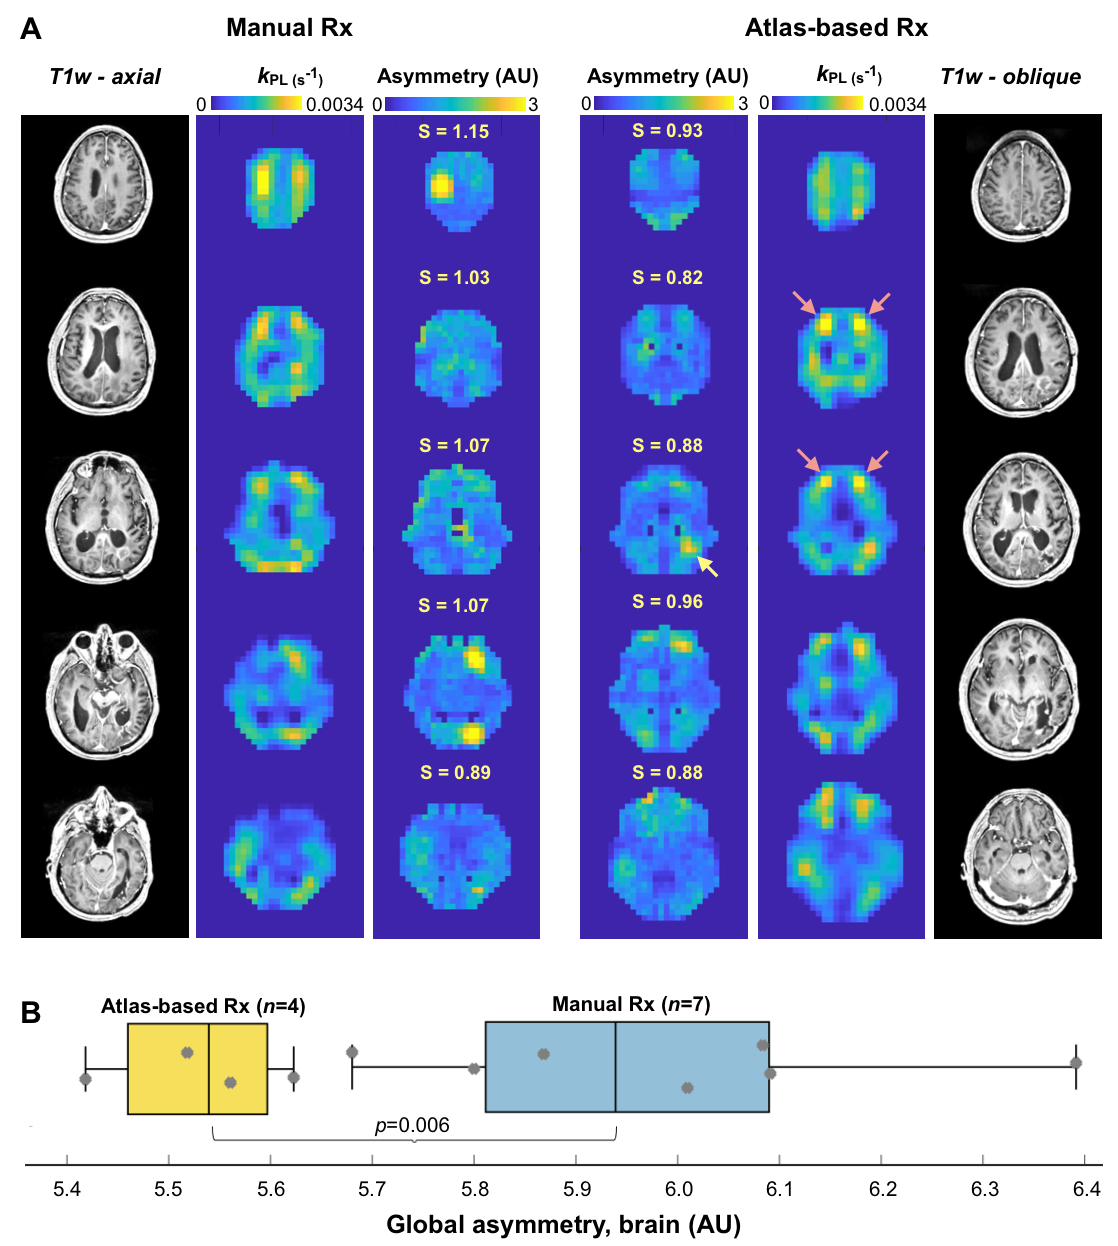
Atlas-based Analysis. Consistency of volumetric coverage for serial atlas-based EPI was measured using VolumePRESS Dice coefficients: $$Dice = \frac{2\mid{Volume1_{PRESS} \cap }Volume2_{PRESS}\mid}{{\mid{Volume1_{PRESS}}}\mid + \mid{Volume2_{PRESS}}\mid}$$ Kinetic data from manual and atlas-based prescriptions acquired within the same exam were qualitatively compared for consistency within voxels containing >30% normal-appearing white matter (NAWM). Since atlas-based EPI was hypothesized to improve hemispheric data symmetry, asymmetry maps12 were generated for normalized kPL data with zero mean and unit standard deviation. Given the set of points PL (p∈PL) and PR (q∈PR) that are perfectly mirrored about a left-right line of symmetry l, local asymmetry12 s was defined as $$s(p;l) = {\min_{q\epsilon P_{R}}} K(f(p), f(q))$$, where K is the Euclidean distance between vectors $$ f(p)= \binom{f_{patch}(p)}{wf_{coord}(p)}, f(q)= \binom{f_{patch}(q)}{wf_{coord}(q)}$$ , which contain the elements of 3x3 patches with central points p/q and coordinates that are empirically weighted by w (and mirrored about l). Global asymmetry S was calculated as $$S =\frac{1}{N}\sum_{p\epsilon P_L\cup P_R} s(p;l)$$ , where N is the number of data samples, and was compared for 11 total manual versus atlas-based serial EPI scans in patient P-01 (Wilcoxon ranked-sum).
Frequency reference. Pyruvate f0 referenced using a coil-embedded 1mL 8M-urea phantom2 versus water with empirical correction factor (0.251491899) was evaluated via FID-CSI with non-selective excitation (Wilcoxon).
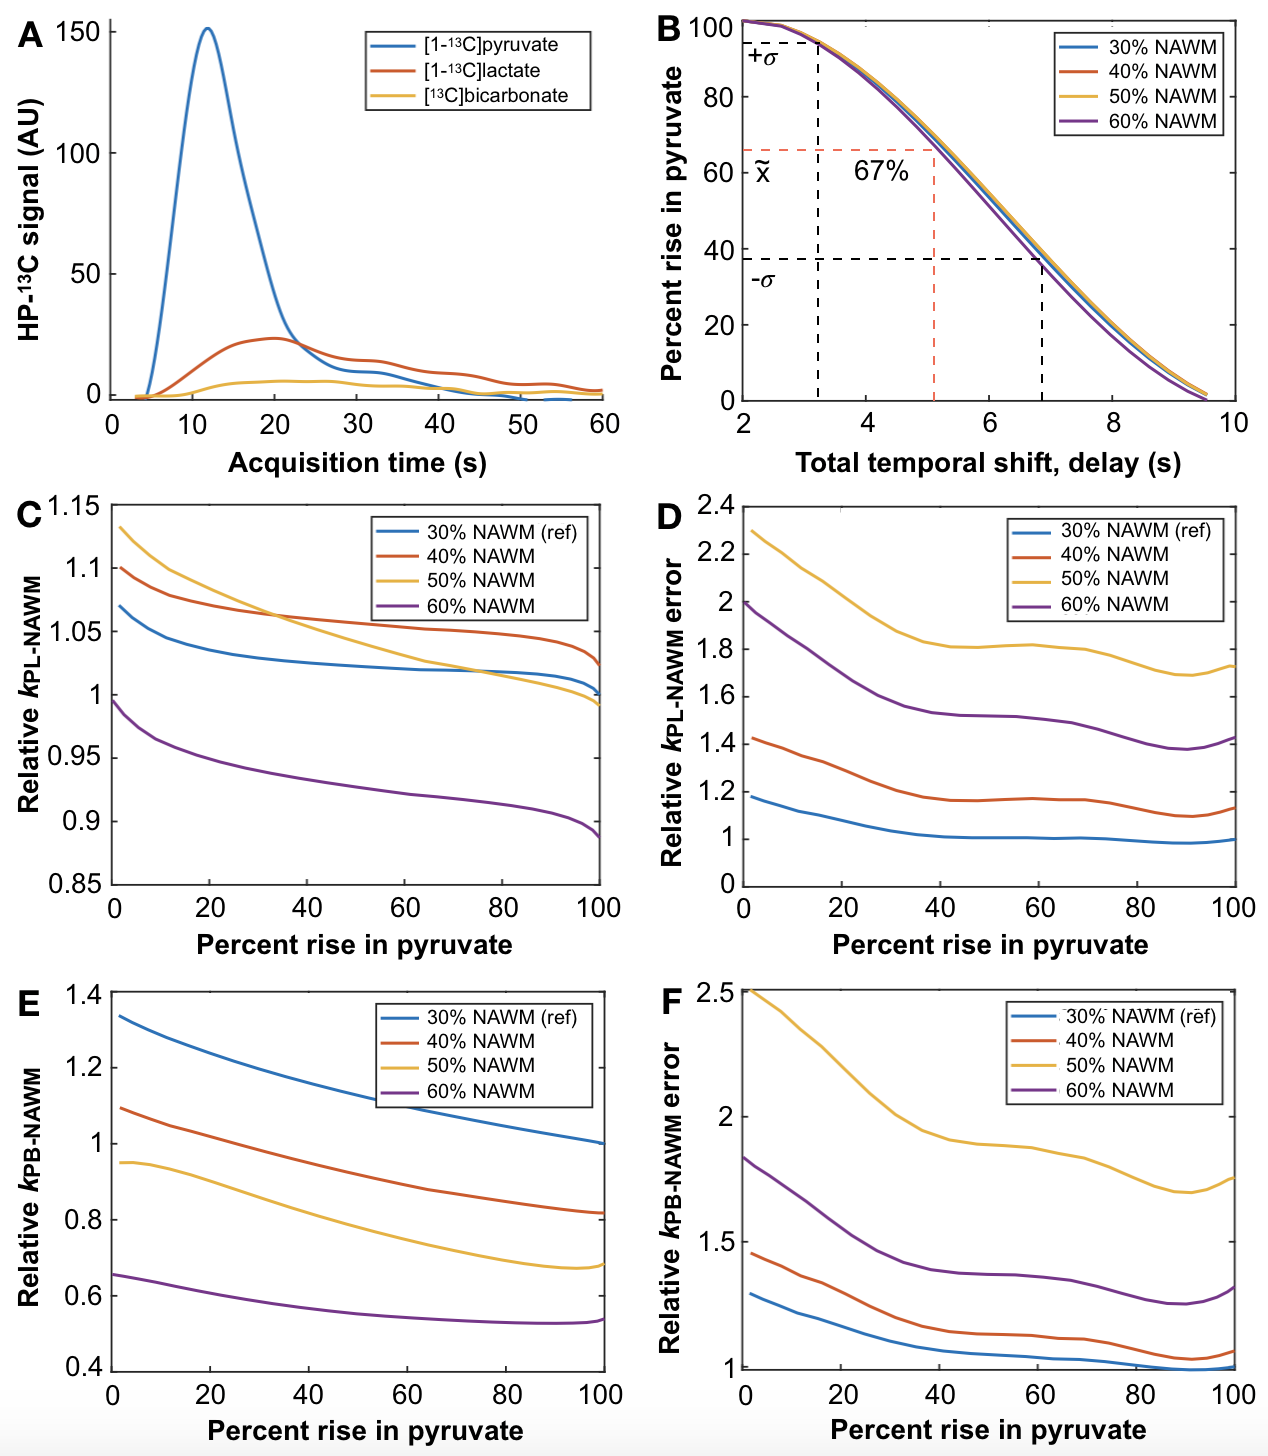
Acquisition delay. EPI data acquired with 5s versus 2s delays triggered following injection were compared according to how much of the initial rise in pyruvate was captured (Wilcoxon). Spline-interpolated dynamic traces were temporally shifted and resampled back to 3s resolution to simulate the effects of delaying acquisition >2s on capturing the rise in pyruvate and kinetic analysis.
Results
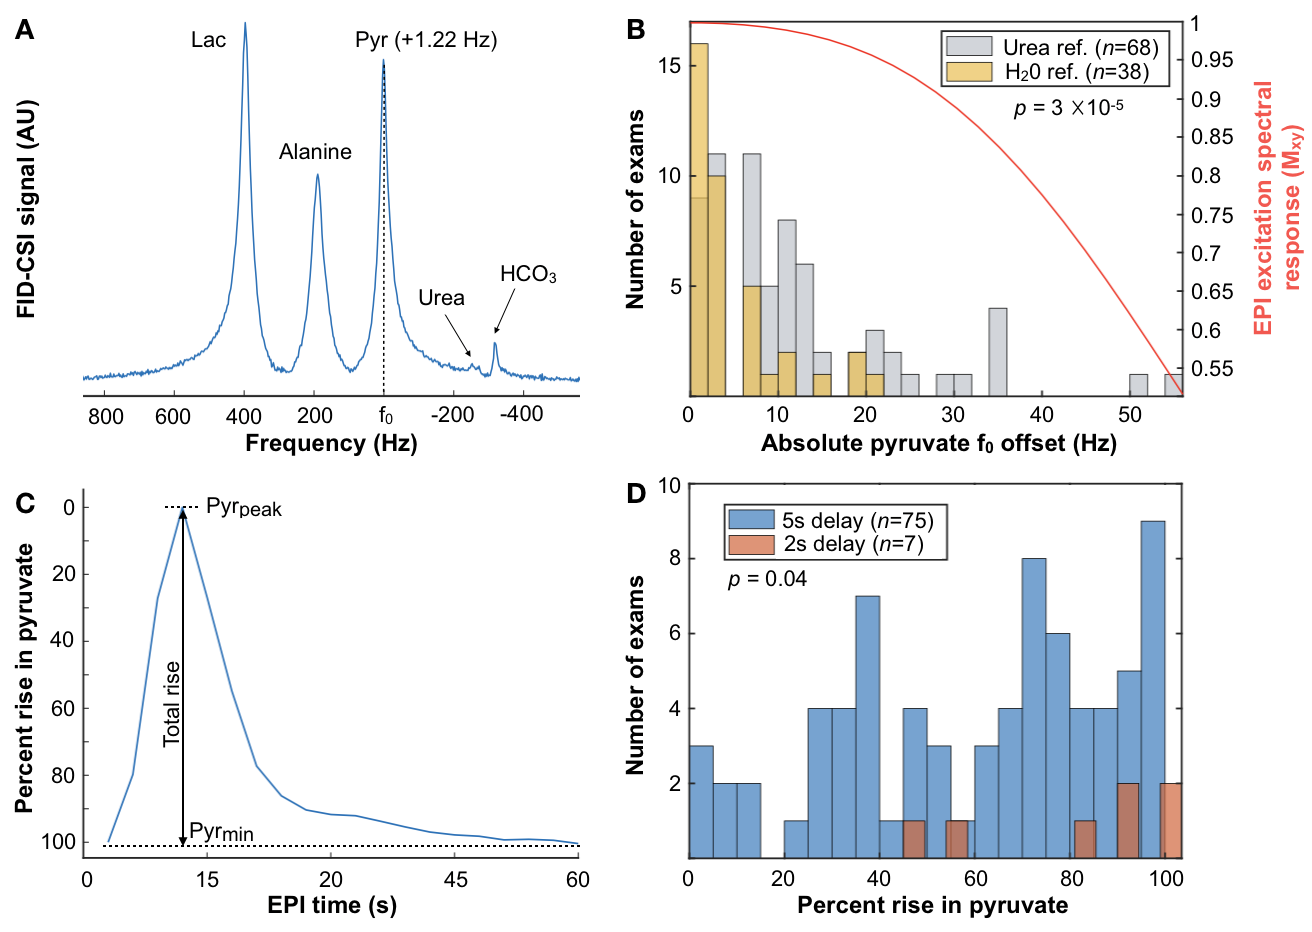
Atlas-based EPI. A diagrammatic description of atlas-based HP-13C EPI is provided in Figure 1, along with example serial data from patient P-01, whose 4 scans spanning 159 days demonstrate consistent volumetric coverage based on dice scores ranging 0.965-0.978. Values of kPL-NAWM and kPB-NAWM are shown in Figure 2 to be consistent across atlas-based EPI exams (P-01) and comparable to manually-prescribed EPI exams acquired for second injections in select patients (P-01, P-02). Atlas-based EPI (n=4) also showed greater hemispheric symmetry in kPL for patient P-01 (Fig. 3A) versus manual prescription (n=7, p=0.006; Fig. 3B), which helped distinguish tumor from non-pathologic kPL elevation.Frequency reference. Absolute pyruvate f0 offsets for urea/water references (8.5±11.6/3.7±5.4Hz; median±SD; n=68/38; p=0.00003) are shown with EPI excitation spectral response in Fig. 4A,B.
Acquisition delay. Figure 4C,D defines percent rise in pyruvate and shows a histogram for 5s (67±28%; median±SD) versus 2s (90±22%) acquisition delays, with the 2s delay enabling the capture of additional inflow dynamics (p=0.04). In Figure 5, the simulated effects of acquisition delay in a patient replicate the 67% median %rise in pyruvate captured among exams with ~5s delay. The relative effects on kPL and kPB modeling are presented in Fig. 5C-F for different thresholds of NAWM, and show that error estimates increase most prominently with <40% capture of pyruvate rise.
Discussion
This work demonstrated methodological improvements in serial HP-13C metabolic imaging of patients with glioma. Atlas-based EPI prescription achieved >96% consistency in volumetric coverage across serial scans, enabling voxel-wise comparisons between exams, while matching the 3-plane oblique orientation of 1H spectroscopy. Besides offering similar NAWM kinetics, the atlas-based prescription showed improved hemispheric symmetry in kPL that helped highlight tumor. The pyruvate center frequency was best estimated using a water reference and the 2s acquisition delay ensured adequate capture of pyruvate inflow to reduce potential kinetic modeling error.Acknowledgements
This work was supported by NIH Grants P01 CA118816, P41 EB0341598, P50 CA097257, and T32 CA151022 (AA).References
1. Autry AW, Gordon JW, Chen, HY, et al. Characterization of serial hyperpolarized 13C metabolic imaging in patients with glioma. Neuroimage Clinical, 2020; 27:102323
2. Park I, Larson PEZ, Gordon JW, et at. Development of methods and feasibility of using hyperpolarized carbon-13 imaging data for evaluating brain metabolism in patient studies. Magn Reson Med. 2018; 80(3):864-873
3. Miloushev VZ, Granlund KL, Boltyanskiy R, et al. Metabolic Imaging of the Human Brain with Hyperpolarized C13 Pyruvate Demonstrates C13 Lactate Production in Brain Tumor Patients. Cancer Res. 2018; 78(14):3755-3760
4. Grist JT, McLean Mary, Riemer Frank, et al. Quantifying normal human brain metabolism using hyperpolarized [1-13C]pyruvate and magnetic resonance imaging. NeuroImage 2019; 189:171-179
5. Bian W, Li Y, Crane JC, Nelson SJ. A fully automated atlas based method for prescribing 3D PRESS MR spectroscopic imaging: towards robust and reproduceable metabolite measurements in human brain. Magn. Reson. Med. 2018; 79(2):636-642
6. Grist JT, Hansen ESS, Sanchez-Heredia JD, et al. Creating a clinical platform for carbon-13 studies using sodium-23 and proton resonances. Magn. Reson. Med. 2020; 84(4):1817-1827
7. Gordon JW, Vigneron DB, and Larson PEZ. Development of a Symmetric Echo Planar Imaging Framework for Clinical Translation of Rapid Dynamic Hyperpolarized 13C Imaging. Magn Reson Med. 2017; 77:826–832
8. Hansen MS. Parallel Imaging Reconstruction I: Cartesian. Proc. Intl. Soc. Mag. Reson. Med. 18 (2010
9. Zhu Z, Zhu X, Ohliger M, Cao P, et al Coil combination methods for multi-channel hyperpolarized 13C imaging data from human studies. JMR 2019; 301:73-39
10. Kim Y, Chen HY, Autry AW, et al. Denoising of hyperpolarized 13C MR images of the human brain using patch-based higher-order singular value decomposition. Magn. Reson. Med. 2021; 86:2497-2511
11. Larson PEZ., Chen HY, Gordon, et al. Investigation of analysis methods for hyperpolarized 13C-pyruvate metabolic MRI in prostate cancer patients. NMR Biomed. 2018; 31(11):e3997
12. Hogeweg L, Sanchez CI, Maduskar P, et al. Fast and effective quantification of symmetry in medical images for pathological detection: application to chest radiography. Med. Phys. 2017; 44(6):2242-2256
Figures