0567
Fast high-resolution Electric Properties Mapping using three-dimensional MR Fingerprinting based water fraction estimation (MRF-EPT)1IRCCS Stella Maris, Pisa, Italy, 2Imago7 Foundation, Pisa, Italy, 3Università di Pisa, Pisa, Italy, 4GE Healthcare, Munich, Germany, 5Istituto Nazionale di Ricerca Metrologica (INRiM), Torino, Italy
Synopsis
MR-EPT aims to non-invasively assess the electrical properties (EP) of the tissues. However, conventional methods based on second-order derivatives of the transmit field are hampered by high noise amplification and boundary errors. Here, we propose to rely on the correlation between electrical properties and water content, which in turn is correlated to tissue T1, in order to extract EP maps from MR Fingerprinting based T1 estimation. We demonstrate whole-brain high-resolution EP mapping of healthy human volunteers and consistent results with both theoretical predictions and standard MR-EPT estimations.
Introduction
Magnetic Resonance Electric Properties Tomography (MR-EPT) is a relatively recent technique aiming to non-invasively map the distribution of conductivity and permittivity in tissues1. Common approaches to MR-EPT rely on the effect of the electrical properties on the transmit field distribution. However, processing often involves second-order derivatives of the transmit phase map2, resulting in noise amplification and region boundaries error, hampering quantification in convoluted regions, e.g., gray matter (GM) and cerebrospinal fluid (CSF) in brain MRI.An alternative approach, proposed by Michel et al3., relies on the fact that cell membranes exhibit low impedance at RF frequencies, resulting in a high correlation between electrical properties and tissue water content, which in turn is related to the tissue T1 value. In their work, water content was estimated by the ratio of two T1-weighted images.
Here, we aim to use MR-Fingerprinting (MRF4) derived T1 maps to estimate the water content and the tissue’s electric properties. In fact, MRF has been shown to provide T1 (and T2) maps of tissue in a relatively short acquisition time, with high accuracy and reproducibility across systems and field strengths5. Therefore, we further expand the multiparametric capability of MRF to conductivity and permittivity quantification without any increase in scanning time.
Methods
Subject cohortSeven healthy subjects (4 males, 3 females, aged 29-43 years) were scanned on a GE Healthcare HDxt 1.5 T system. Acquisition protocol included a 3D FSPGR T1-weighted acquisition for alignment and segmentation.
MRF acquisition and reconstruction
A 3D SSFP-MRF6-8 with an inversion-prepared variable flip angle scheme and fixed TE (0.5 ms) and TR (8.5 ms; total scan time=7 min) was acquired. k-space sampling was performed using a 3D spiral projection trajectory8 (225 mm3 FOV; 1.1x1.1x1.1 mm3 isotropic resolution). Data was acquired using a quadrature-mode body coil for transmission and an 8-channel head coil for reception and reconstructed by zero-filled low rank back-projection8. PD, T1 and T2 inference was performed using a fully-connected neural network with individual pathways for each parameter7.
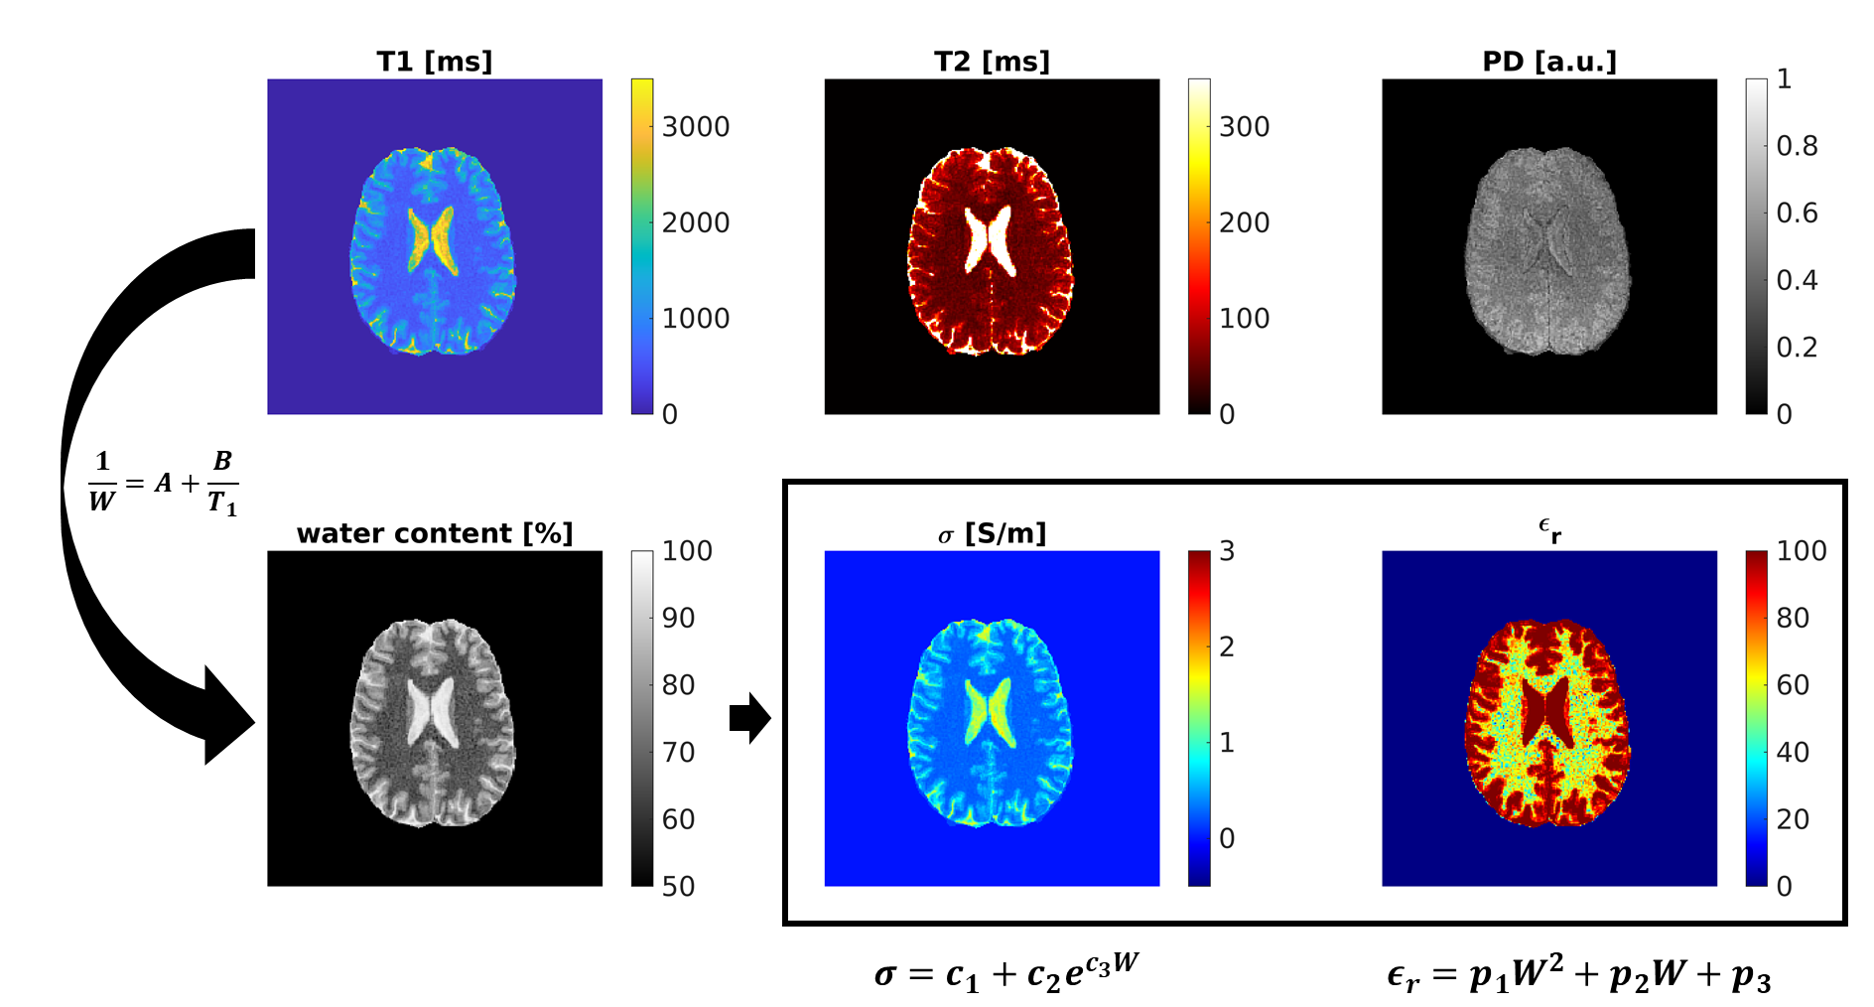
Conductivity and permittivity maps (σ, ε) were obtained from MRF-derived T1 maps as follows (Figure 1): first, water content W was obtained according to10
$$1/W = A + B/T1$$
where A=0.935 and B=0.341s10 are the fit constants, respectively. The electrical properties were then derived from the water content W via3
$$ \sigma^{MRF} = c_1 + c_2 e^{c_3 W}$$
$$ \epsilon^{MRF} = p_1 W^2 + p_2 W + p_3 $$
Calibration coefficients were estimated by fitting literature water content10 for white matter (WM), GM and CSF against their theoretical conductivity and permittivity calculated with a 4th order Cole-Cole model11.
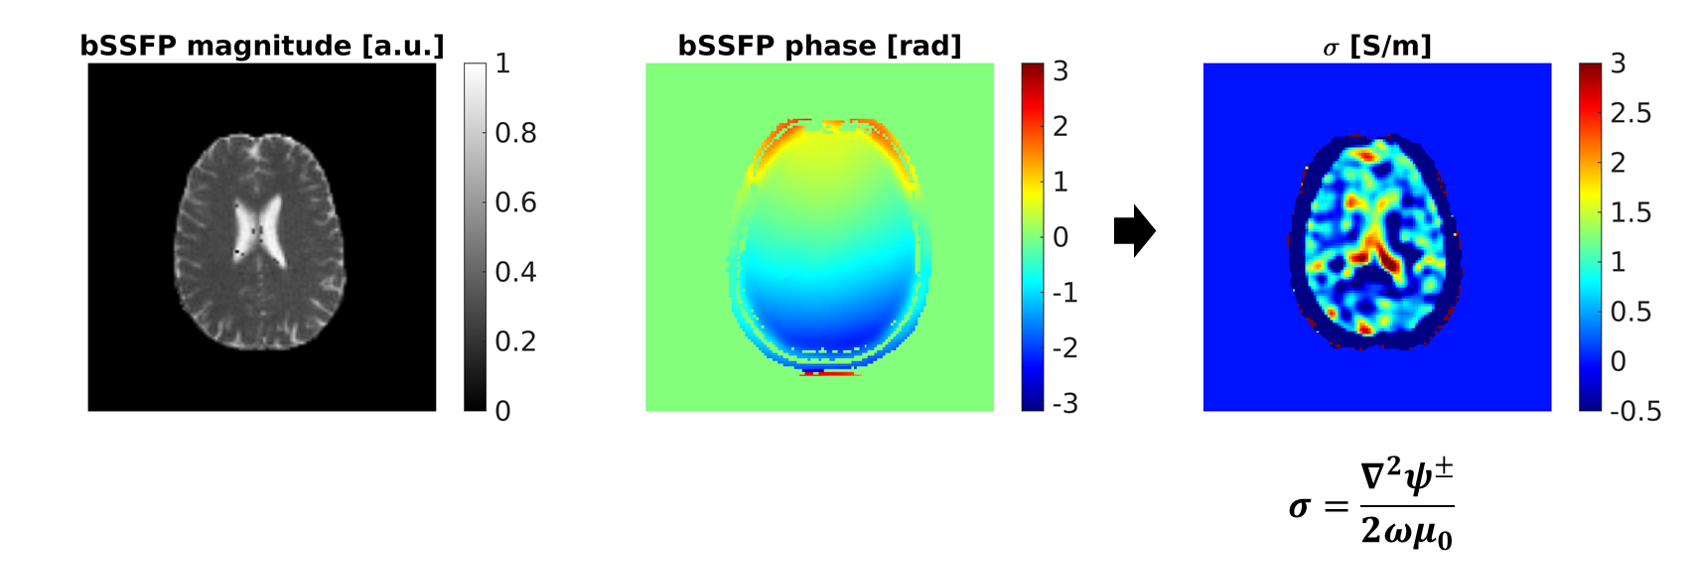
Standard EPT acquisition and reconstruction
As a reference, we acquired a 2x2x2 mm3 isotropic bSSFP (TE/TR=1.5 ms/5.3 ms, flip angle=30°; 4 averages) image using the scanner quadrature body coil for both transmission and reception. Complex data was stored to preserve the phase information. The conductivity map was obtained from bSSFP phase according to the following equation (Figure 2):
$$\sigma^{bSSFP} = \frac{\nabla^2 \psi}{2 \omega \mu_0}$$
i.e. phase-based Helmholtz EPT11. Gibbs ringing correction and Gaussian apodization (width=2) of the complex data were used to reduce noise in the conductivity map. Processing was performed using EPTlib12 using a cuboid-shaped kernel of 3 voxel isotropic size.
Analysis
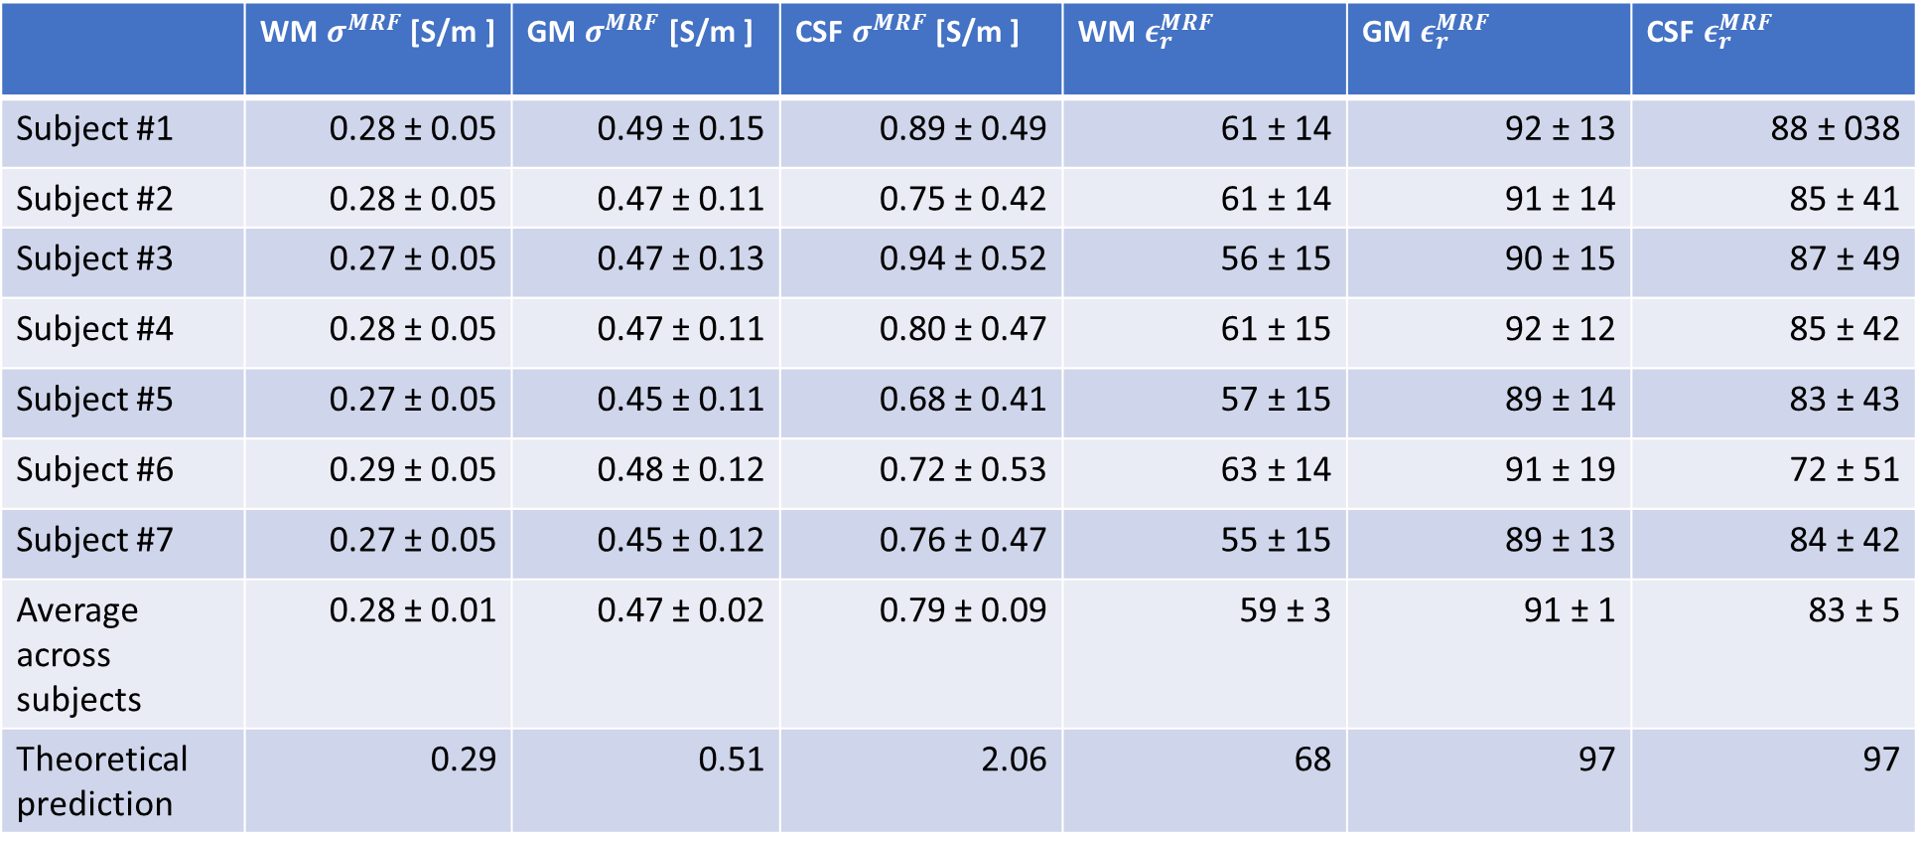
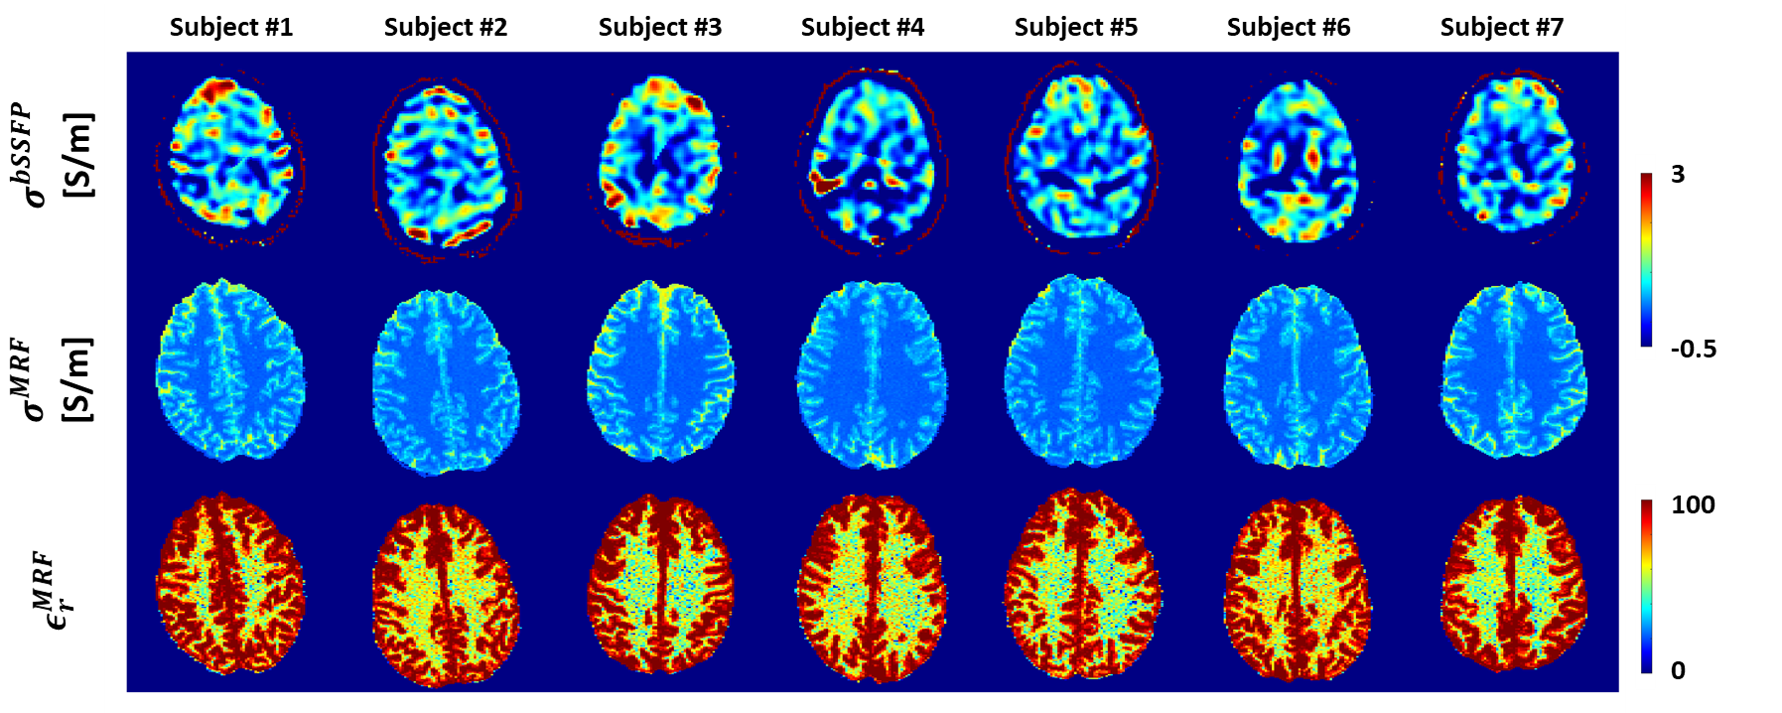
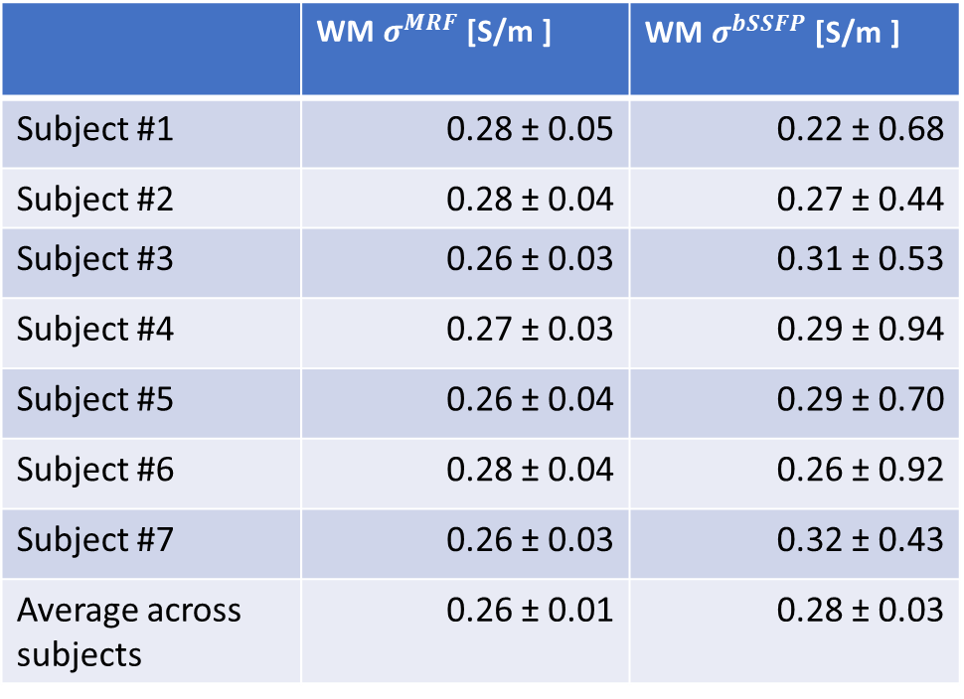
Probabilistic segmentations corresponding to WM, GM and CSF were obtained from 3D FSPGR using SPM12. Average MRF-EPT conductivity and permittivity values were measured in the voxels with a probability value > 0.9 and compared with 4th order Cole-Cole theoretical predictions. In addition, conductivity values were compared between MRF-EPT and bSSFP-EPT. The comparison was performed in a slab of 5 slices in the upper part of the brain to avoid B0-induced artifacts in bSSFP maps due to air-tissue interfaces. To avoid the boundary effect, bSSFP-EPT masks were eroded with a spherical kernel of 4 voxels radius and the comparison was limited to WM.
Results and Discussion
As shown in Figure 1, MRF-EPT successfully provided high resolution conductivity and permittivity maps of the tissues in addition to T1, T2 and PD. Measured electrical properties were in agreement with theoretical predictions within the experimental error (Table 1), except for the CSF region where T1 was underestimated, as also observed in other studies using similar MRF acquisitions5. Standard bSSFP-based EPT was also able to provide conductivity maps of the brain tissues, as shown in Figure 2. While WM, GM and CSF were identifiable in the reconstructed maps, the results were heavily affected by boundary error and noise from the derivative kernel. This was also confirmed by the comparison of EPT maps between bSSFP and MRF shown in Figure 3. Table 2 shows a quantitative comparison between MRF-EPT and bSSFP-EPT conductivity values in WM. While both techniques provided consistent estimations, bSSFP-EPT values were affected by a high uncertainty. MRF-EPT provided more robust estimations.Conclusions
We demonstrated that MRF is able to robustly map electrical properties of healthy brain tissue in addition to T1, T2 and PD within a short and therefore clinically feasible scan time. Importantly, while phase-based EPT only provides conductivity values, MRF also enables permittivity estimation. Future work will be devoted to assessing MRF-EPT in pathological subjects.Acknowledgements
The results here presented have been developed in the framework of the 18HLT05 QUIERO Project. This project has received funding from the EMPIR Programme co-financed by the Participating States and from the European Union’s Horizon 2020 Research and Innovation Programme. This work has been partially supported also by grants “RC 2018-2020” funded by the Italian Ministry of Health.References
1. Haacke EM, Petropoulos LS, Nilges EW, Wu DH. Extraction of conductivity and permittivity using magnetic resonance imaging. Phys Med Biol. 1991;36(6):723-734. doi:10.1088/0031-9155/36/6/002
2. Voigt T, Katscher U, Doessel O. Quantitative conductivity and permittivity imaging of the human brain using electric properties tomography. Magn Reson Med. 2011;66(2):456-466. doi:10.1002/mrm.22832
3. Michel E, Hernandez D, Lee SY. Electrical conductivity and permittivity maps of brain tissues derived from water content based on T1-weighted acquisition. Magn Reson Med. 2017;77(3):1094-1103. doi:10.1002/mrm.26193
4. Ma D, Gulani V, Seiberlich N, et al. Magnetic resonance fingerprinting. Nature. 2013;495(7440):187-192. doi:10.1038/nature11971
5. Buonincontri G, Kurzawski JW, Kaggie JD, et al. Three dimensional MRF obtains highly repeatable and reproducible multi-parametric estimations in the healthy human brain at 1.5T and 3T. NeuroImage. 2021;226:117573. doi:10.1016/j.neuroimage.2020.117573
6. Jiang Y, Ma D, Seiberlich N, Gulani V, Griswold MA. MR fingerprinting using fast imaging with steady state precession (FISP) with spiral readout. Magn Reson Med. 2015;74(6):1621-1631. doi:10.1002/mrm.25559
7. Gómez PA, Cencini M, Golbabaee M, et al. Rapid three-dimensional multiparametric MRI with quantitative transient-state imaging. Sci Rep. 2020;10(1):13769. doi:10.1038/s41598-020-70789-2
8. Kurzawski JW, Cencini M, Peretti L, et al. Retrospective rigid motion correction of three-dimensional magnetic resonance fingerprinting of the human brain. Magn Reson Med. 2020;84(5):2606-2615. doi:10.1002/mrm.28301
9. McGivney DF, Pierre E, Ma D, et al. SVD Compression for Magnetic Resonance Fingerprinting in the Time Domain. IEEE Trans Med Imaging. 2014;33(12):2311-2322. doi:10.1109/TMI.2014.2337321
10. Fatouros PP, Marmarou A. Use of magnetic resonance imaging for in vivo measurements of water content in human brain: method and normal values. J Neurosurg. 1999;90(1):109-115. doi:10.3171/jns.1999.90.1.0109
11. De Geeter N, Crevecoeur G, Dupré L, Van Hecke W, Leemans A. A DTI-based model for TMS using the independent impedance method with frequency-dependent tissue parameters. Phys Med Biol. 2012;57(8):2169-2188. doi:10.1088/0031-9155/57/8/2169
12. Arduino A. EPTlib: An Open-Source Extensible Collection of Electric Properties Tomography Techniques. Appl Sci. 2021;11(7):3237. doi:10.3390/app11073237
Figures