0566
Tissue classification of cerebral gliomas using MR fingerprinting signal and deep learning1Radiology, Case Western Reserve University, Cleveland, OH, United States, 2Physics, Case Western Reserve University, Cleveland, OH, United States, 3Radiology, University Hospitals Cleveland Medical Center, Cleveland, OH, United States
Synopsis
In this pilot study, we aim to analyze MR Fingerprinting (MRF) signal using deep learning network to assess the performance of tissue classification in gliomas. A U-Net based convolutional neural network was trained to learn glioma grades based on the SVD-compressed fingerprint acquired using MRF. Based on data acquired from a 5-minute MRF scan, the method shows great potential to accurately classify glioma grades without the need of image registration and contrast administration.
Introduction
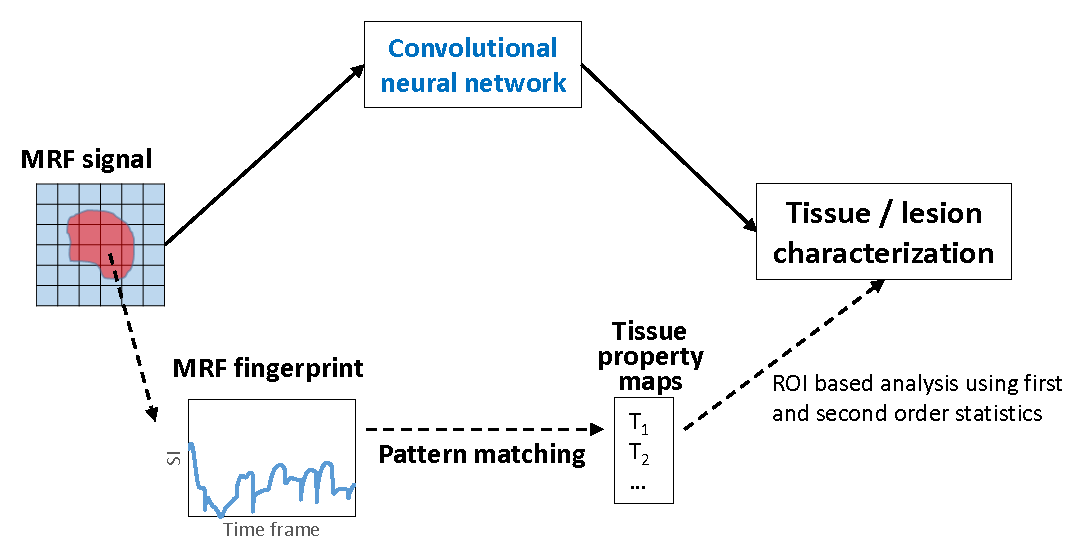
Gliomas are the most common primary brain tumors and are classified as Grade I-IV based on the World Health Organization (WHO) grade criteria. Accurate classification of glioma grade is essential for complete diagnosis, prognostication and treatment planning. Assessment of clinical images can provide clues on glioma grade, however final diagnosis is always based on tissue sampling. The advanced imaging analyses used for glioma classification also utilize multiple qualitative clinical images including T1, T2, FLAIR, and post-contrast T1-weighted images. While promising, these methods have drawbacks such as need for multiple sequences, heavy reliance on contrast enhanced images, susceptibility to patient motion, lack of reproducibility, to name a few.MR Fingerprinting is a quantitative imaging tool which can provide multiple co-aligned quantitative tissue maps in one scan (1). Our previous results have shown that MRF map based analyses can differentiate between various glioma (2). However, these analyses methods do not fully utilize the enriched tissue/lesion specific information that is embedded in the raw MRF signal, which could potentially enable more accurate tissue classification (Fig 1). Extraction and analysis of this MRF signal, however, poses challenges in terms of scale and complexity of signal as well as complexity of the classification problem and can be best tackled by implementing deep learning methods. Previously, we have used deep learning methods for accelerating 2D and 3D MRF scans (3-4). In this pilot study, our aim is to assess the tissue classification performance of a U-net based model applied to MRF signal in a cohort of glioma patients.
Methods
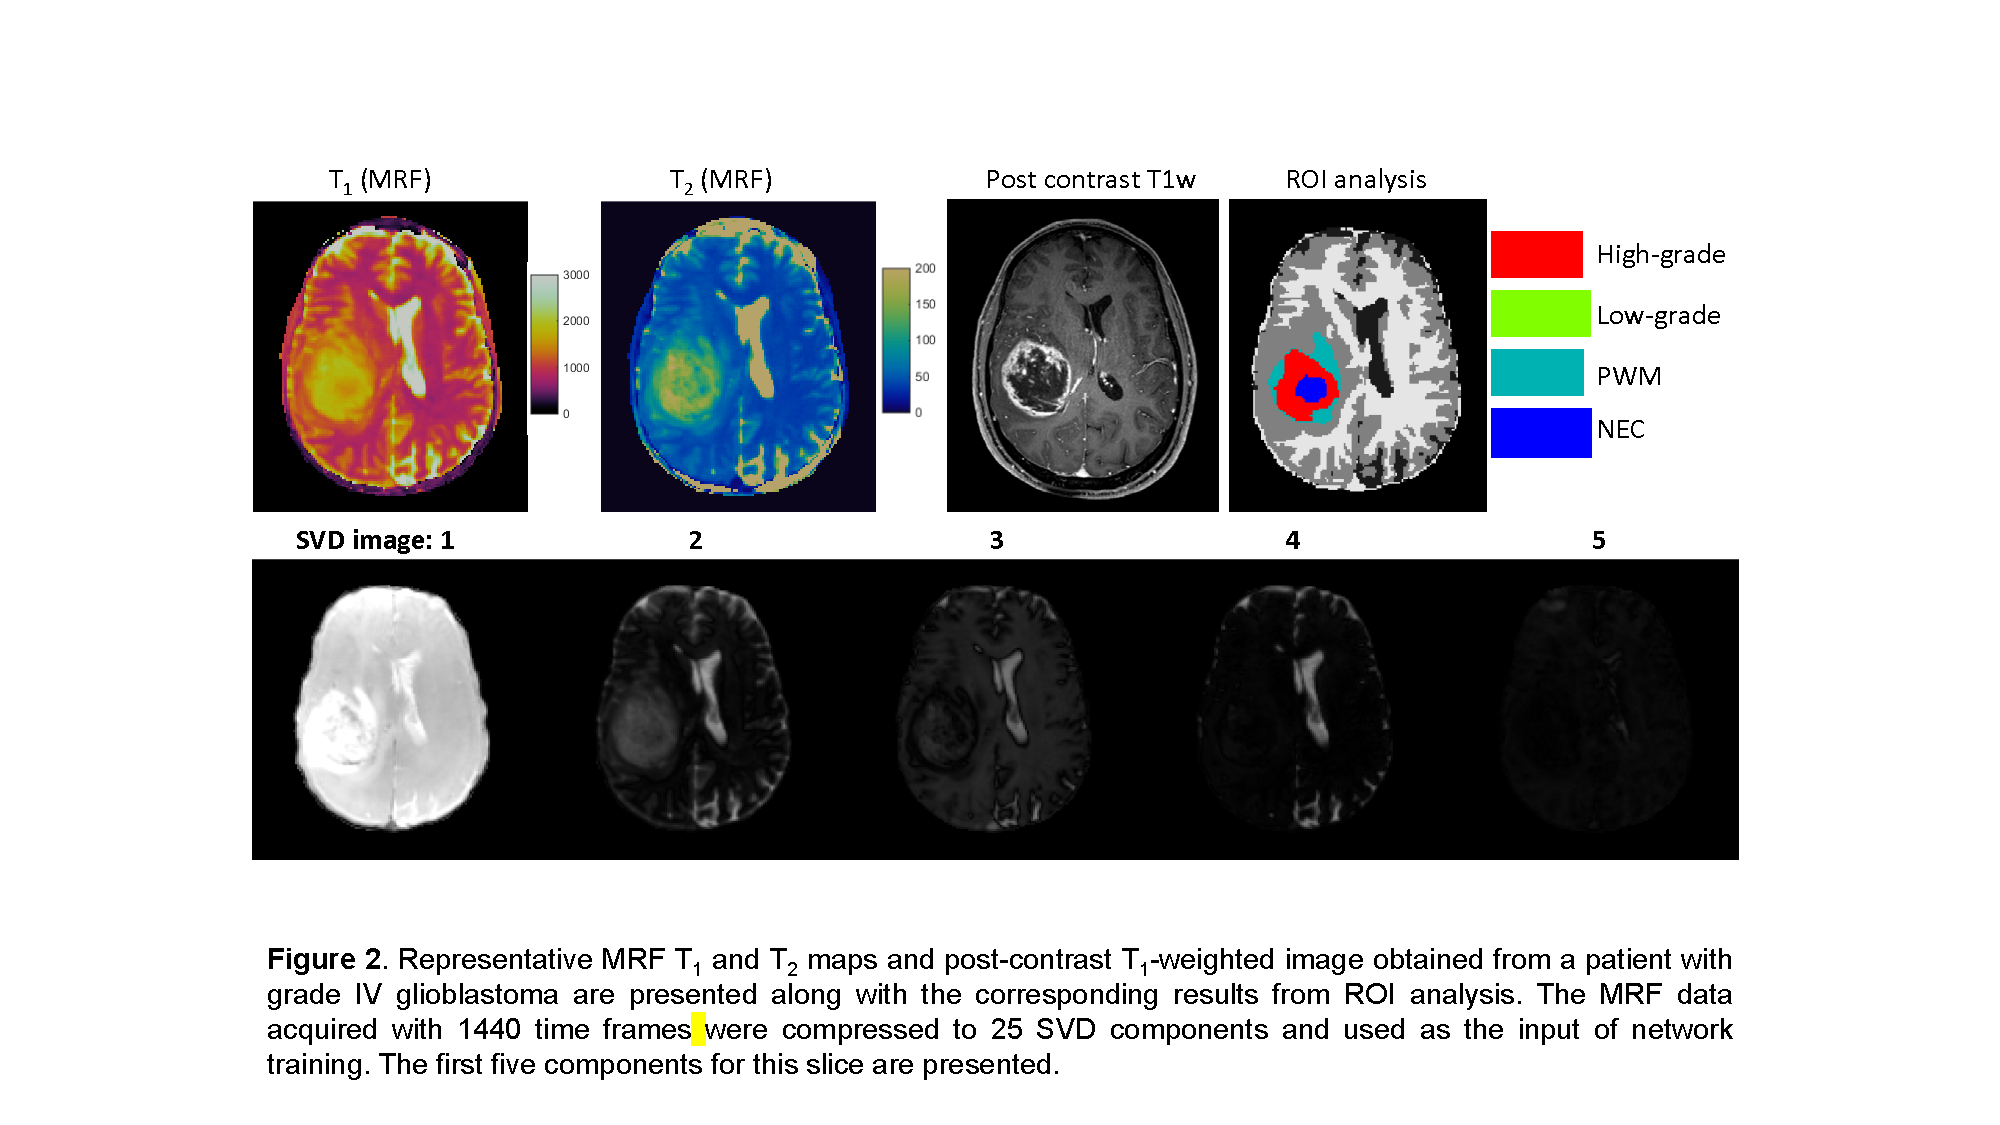
The study was performed on MRF data acquired from 43 adult patients with brain tumors, including 28 subjects with grade-4 gliomas (GBM), 5 subjects with grade-3 gliomas, and 10 subjects with grade-2 gliomas under an IRB approved protocol. Final diagnosis was based on the 2003 WHO classification. For each subject, 3D MRF acquisitions were performed at initial presentation (pre-surgery) before contrast administration. The image parameters included FOV, 30×30 cm; matrix size, 256×256; slice thickness, 3 mm; time frame, 1440; scan time, 4.6 min. MRF was acquired as a part of a routine presurgical clinical scan (5). All patients were scanned on Skyra 3T with a 20-channel head coil. The brain tumor MRF maps were labeled by a neuroradiologist based on the clinical images (Fig 2). Four tumor-related classes were labeled, including high-grade gliomas (grade 3+4), low-grade gliomas (grade 2), peritumor white matter (PWM), and necrosis (NEC). Partial volume (PV) analysis was further performed on normal brain tissues and three classes including white matter (WM), gray matter (GM) and cerebrospinal fluid (CSF) were segmented (6). A total of seven classes were labeled for all the subjects.Next, U-Net was applied to extract useful information from MRF signal (3-4). To reduce the number of parameters in the network, SVD compression (7) was applied to compress MRF data to 25 SVD components and used as the input of the training (Fig 2). The neuroradiologist generated labels and tissue segmentation labels from PV analysis were used as the reference. A patch-based approach (32x32) was applied to further utilize spatial correlation in the MRF data to enhance tissue characterization. The training was conducted with 100 epochs. Ten-fold cross validation was performed for all 43 subjects.
Results
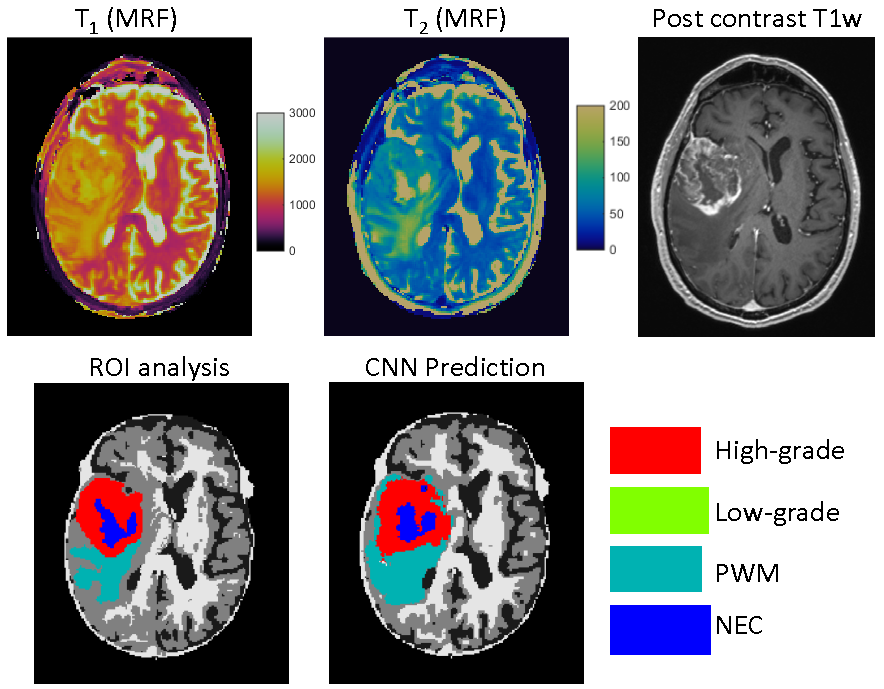
Figs 3&4 show representative results obtained from a GBM patient and a grade-2 glioma patient with accurate tissue classification. When analyzed on a pixel-by-pixel basis, the method demonstrates high accuracy in separating abnormal pixels from normal pixels with a sensitivity of 93% and a specificity of 98%. The sensitivity and specificity to differentiate low-grade vs high-grade gliomas across all the subjects was 85% and 70%, respectively. The accuracy to predict high-grade, low-grade gliomas, PWM, and NEC on a pixel basis was 48%, 60%, 48%, and 60%, respectively. Fig 5 shows the results from another patient with GBM. The network predicted presence of tumor well beyond the small area of enhancement. The patient underwent 5-ALA guided resection which confirmed presence of glioblastoma extending beyond enhancing margins. Note the larger post-surgical cavity as compared to area of enhancement.Discussion and Conclusion
This study explores the potential of MRF signal analysis using deep learning for direct brain tissue classification. The results show accurate separation between normal and abnormal brain tissues on a pixel-by-pixel basis and excellent performance for glioma grading from a single 5-minute MRF acquisition without contrast. While the performance, especially for the pixel-based segmentation, can be further improved, the classification results also need to be interpreted in light of lack of actual ground truth. The proposed approach presents a novel methodology to extract tissue specific information directly from the MRF signal without any dictionary-based constraints.Acknowledgements
No acknowledgement found.References
1. Ma D, et al. Nature, 2013; 187–192.
2. Badve C, et al. ASNR, 2017; 492-499.
3. Fang Z, et al. TMI, 2019; 2364-2374.
4. Chen Y, et al. NeuroImage, 2020; 116329.
5. Ma D, et al. MRM, 2015; 2190-2197.
6. Deshmane A, et al. NRM in Biomed, 2019; 1-17.
7. McGivney DF, et al. TMI, 2014; 2311-2322.
Figures