0564
Simultaneous mapping of T1, T2, and T2* at 0.55T with Rosette MR Fingerprinting1Biomedical Engineering, University of Michigan, Ann Arbor, MI, United States, 2Radiology, University of Michigan, Ann Arbor, MI, United States
Synopsis
In this work, Rosette MRF was modified and deployed to simultaneously map T1, T2, and T2*. Mapping is demonstrated on the ISMRM/NIST phantom for verification of quantitative accuracy, and on four healthy volunteers to demonstrate potential feasibility in vivo.
Introduction
The goal of this work is to rapidly and simultaneously acquire T1, T2, and T2* maps on a 0.55T MRI system using MR Fingerprinting with a rosette trajectory. T2* mapping is increasingly used in the heart and liver to monitor iron concentration in patients with hereditary hemochromatosis, thalassemia major, or sickle cell disease1,2. These maps are commonly collected at 1.5T and 3T, but may be more challenging to collect at lower field strengths due to the increase in T2* values3,4. While longer T2* values can be beneficial in some applications, T2* mapping becomes more difficult, as longer readouts are required to capture the longer decays. This is particularly challenging in liver and cardiac applications, where there is a limited amount of data that can be collected within a single breathhold.MR Fingerprinting5,6 is an efficient technique for multiparametric mapping using a non-steady state pulse sequence, and simultaneous T1, T2, and T2* mapping has been demonstrated at 1.5T using a Dixon MRF technique7. The rosette trajectory has recently been examined as a readout for MRF, as it repeatedly crosses the center of k-space8, and can be used to separate fat and water signals for more accurate T1 and T2 quantification in the heart9. Additionally, rosettes have been used for T2* mapping outside of the MRF framework10. In this work, the feasibility of collecting accurate T1, T2, and T2* maps in the liver in a single breathhold at 0.55T is explored.
Methods
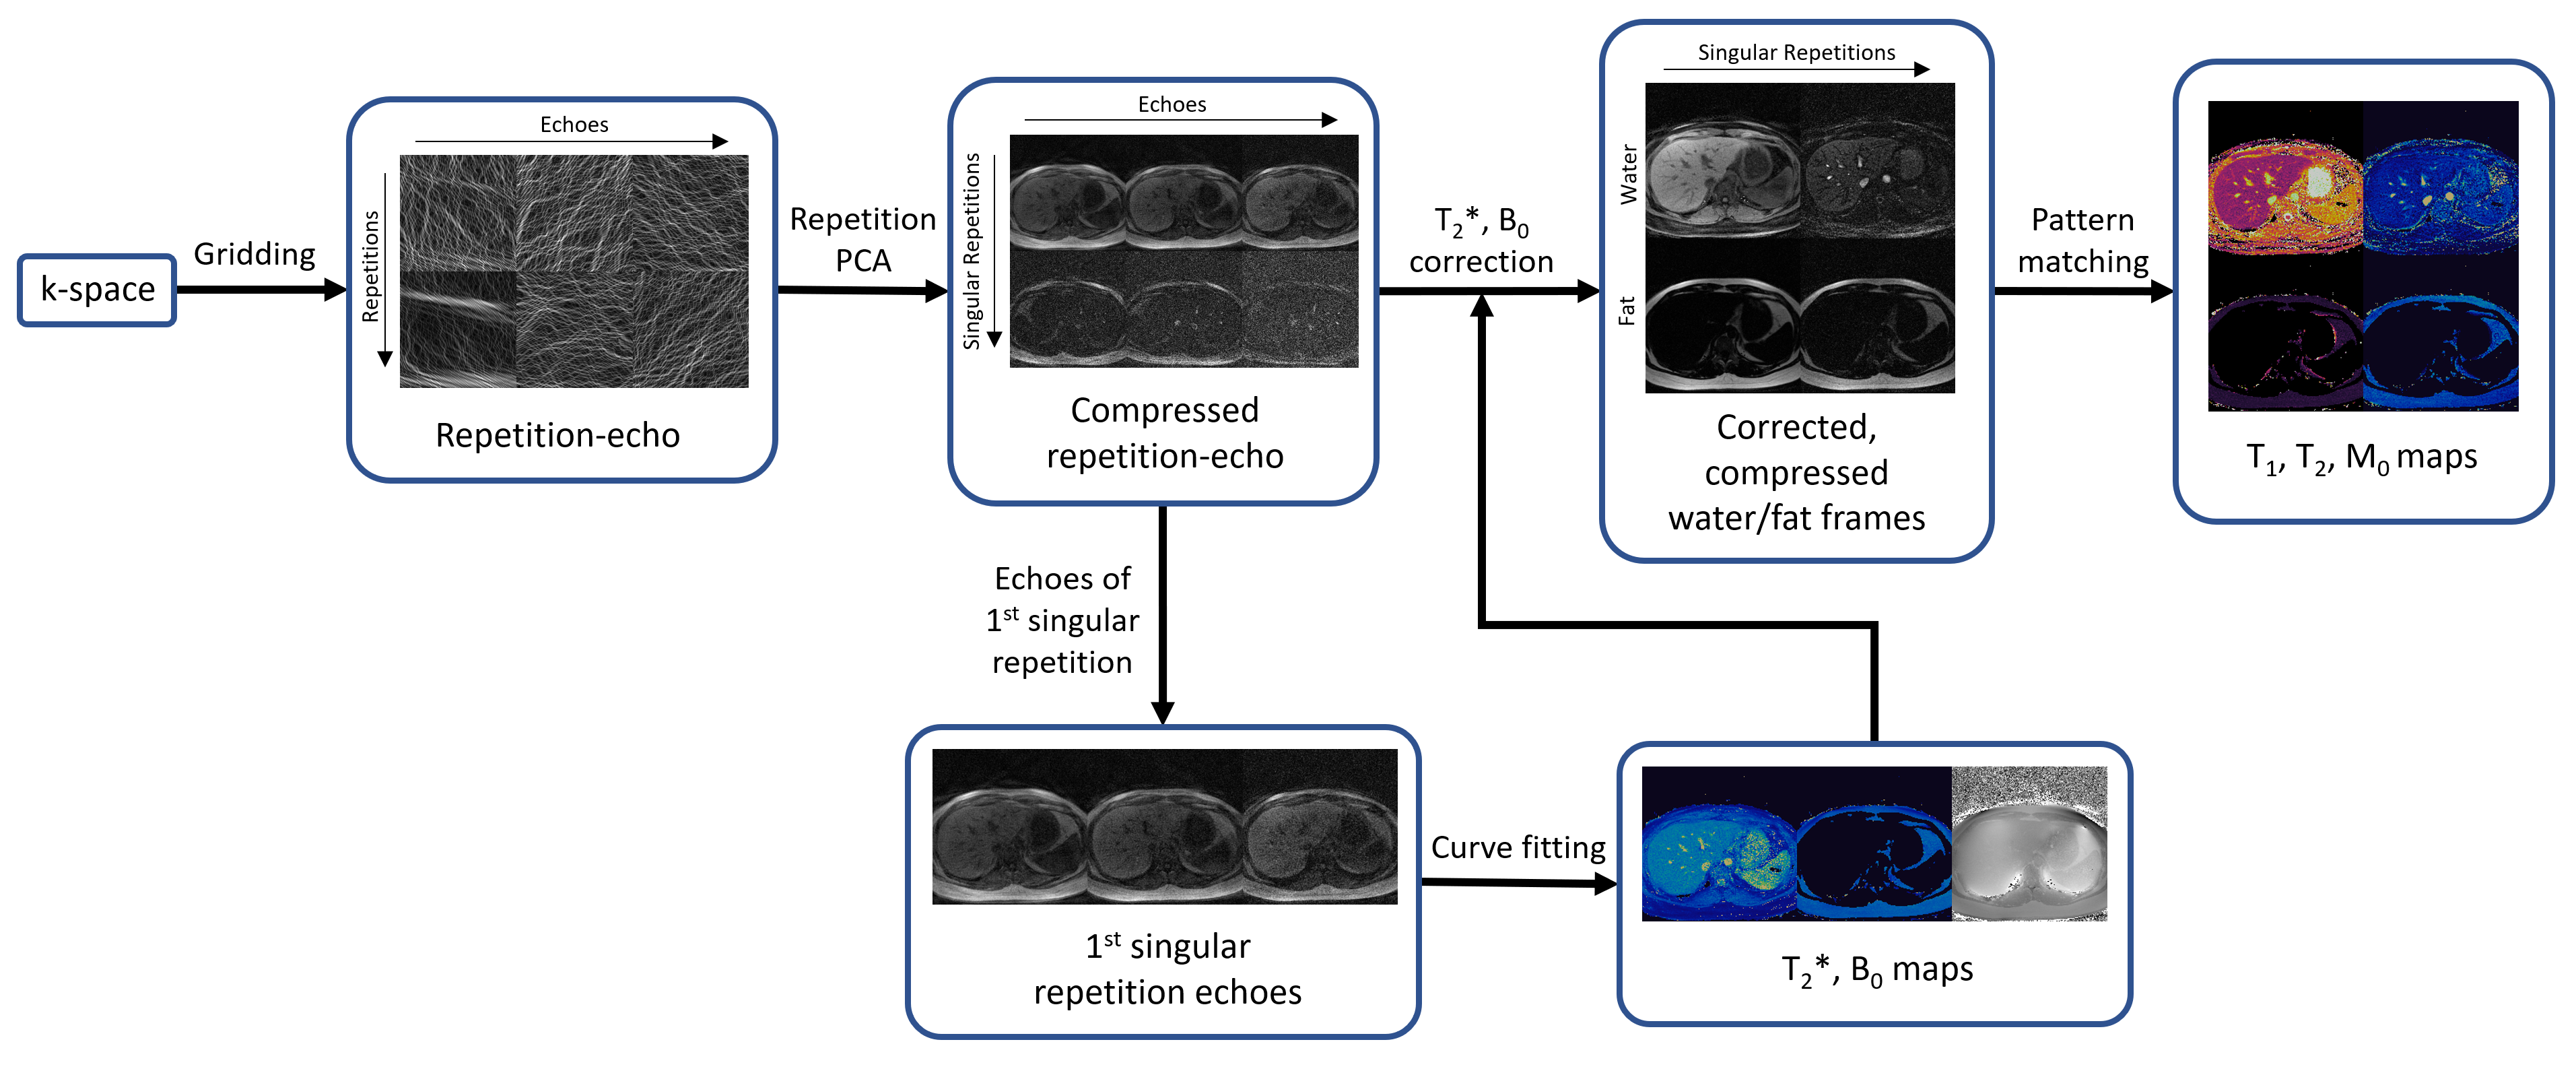
All data were collected on a 0.55T FreeMax scanner (Siemens Healthineers, Erlangen, Germany). Scans were performed on the ISMRM/NIST phantom as well as four healthy volunteers using a 6-channel body receiver coil array in this IRB-approved study. Reference T1 values for the ISMRM/NIST phantom were acquired using an inversion recovery spin echo sequence, and reference T2 values were acquired using a spin echo sequence. Reference T2* maps were generated from a gradient echo sequence with the following parameters: TR=150ms, 12 echoes spaced between 4.06 and 48.28 ms, FA=25°, 128x128 matrix, 300 mm2 FOV, 8 mm slice thickness. Rosette MRF data were collected using an 18-lobe rosette with the following parameters: TR=41.4 ms, TE=1 ms, 37.0 ms readout duration, 336 excitations, 14.1 s total scan duration, FA ranged between 0° and 75°, 192x192 matrix, 300 mm2 FOV, 8 mm slice thickness. Inversions were used every 72 repetitions.The reconstruction process for these maps is shown in Figure 1. The rosette trajectory is split into multiple echoes for each TR10, and the NUFFT11 is used to generate 36 highly accelerated single echo images for each repetition. PCA is then applied to compress these images over the repetitions to form a set of five singular images. The single echo images from the first singular image are used to generate T2* and B0 maps via a dual exponential fit. The T2* and B0 maps are used to solve for the initial water and fat contrasts at the beginning of rosette acquisition for each singular image. The initial water and fat contrasts are then used in the MRF pattern matching process to generate separate water and fat T1 and T2 maps. The MRF dictionary was generated with the following tissue property values: T1=[10:10:2000 2020:20:3000] and T2=[6:2:100 105:5:300 310:10:500 540:40:1200], and was corrected for slice profile and inversion efficiency effects12.
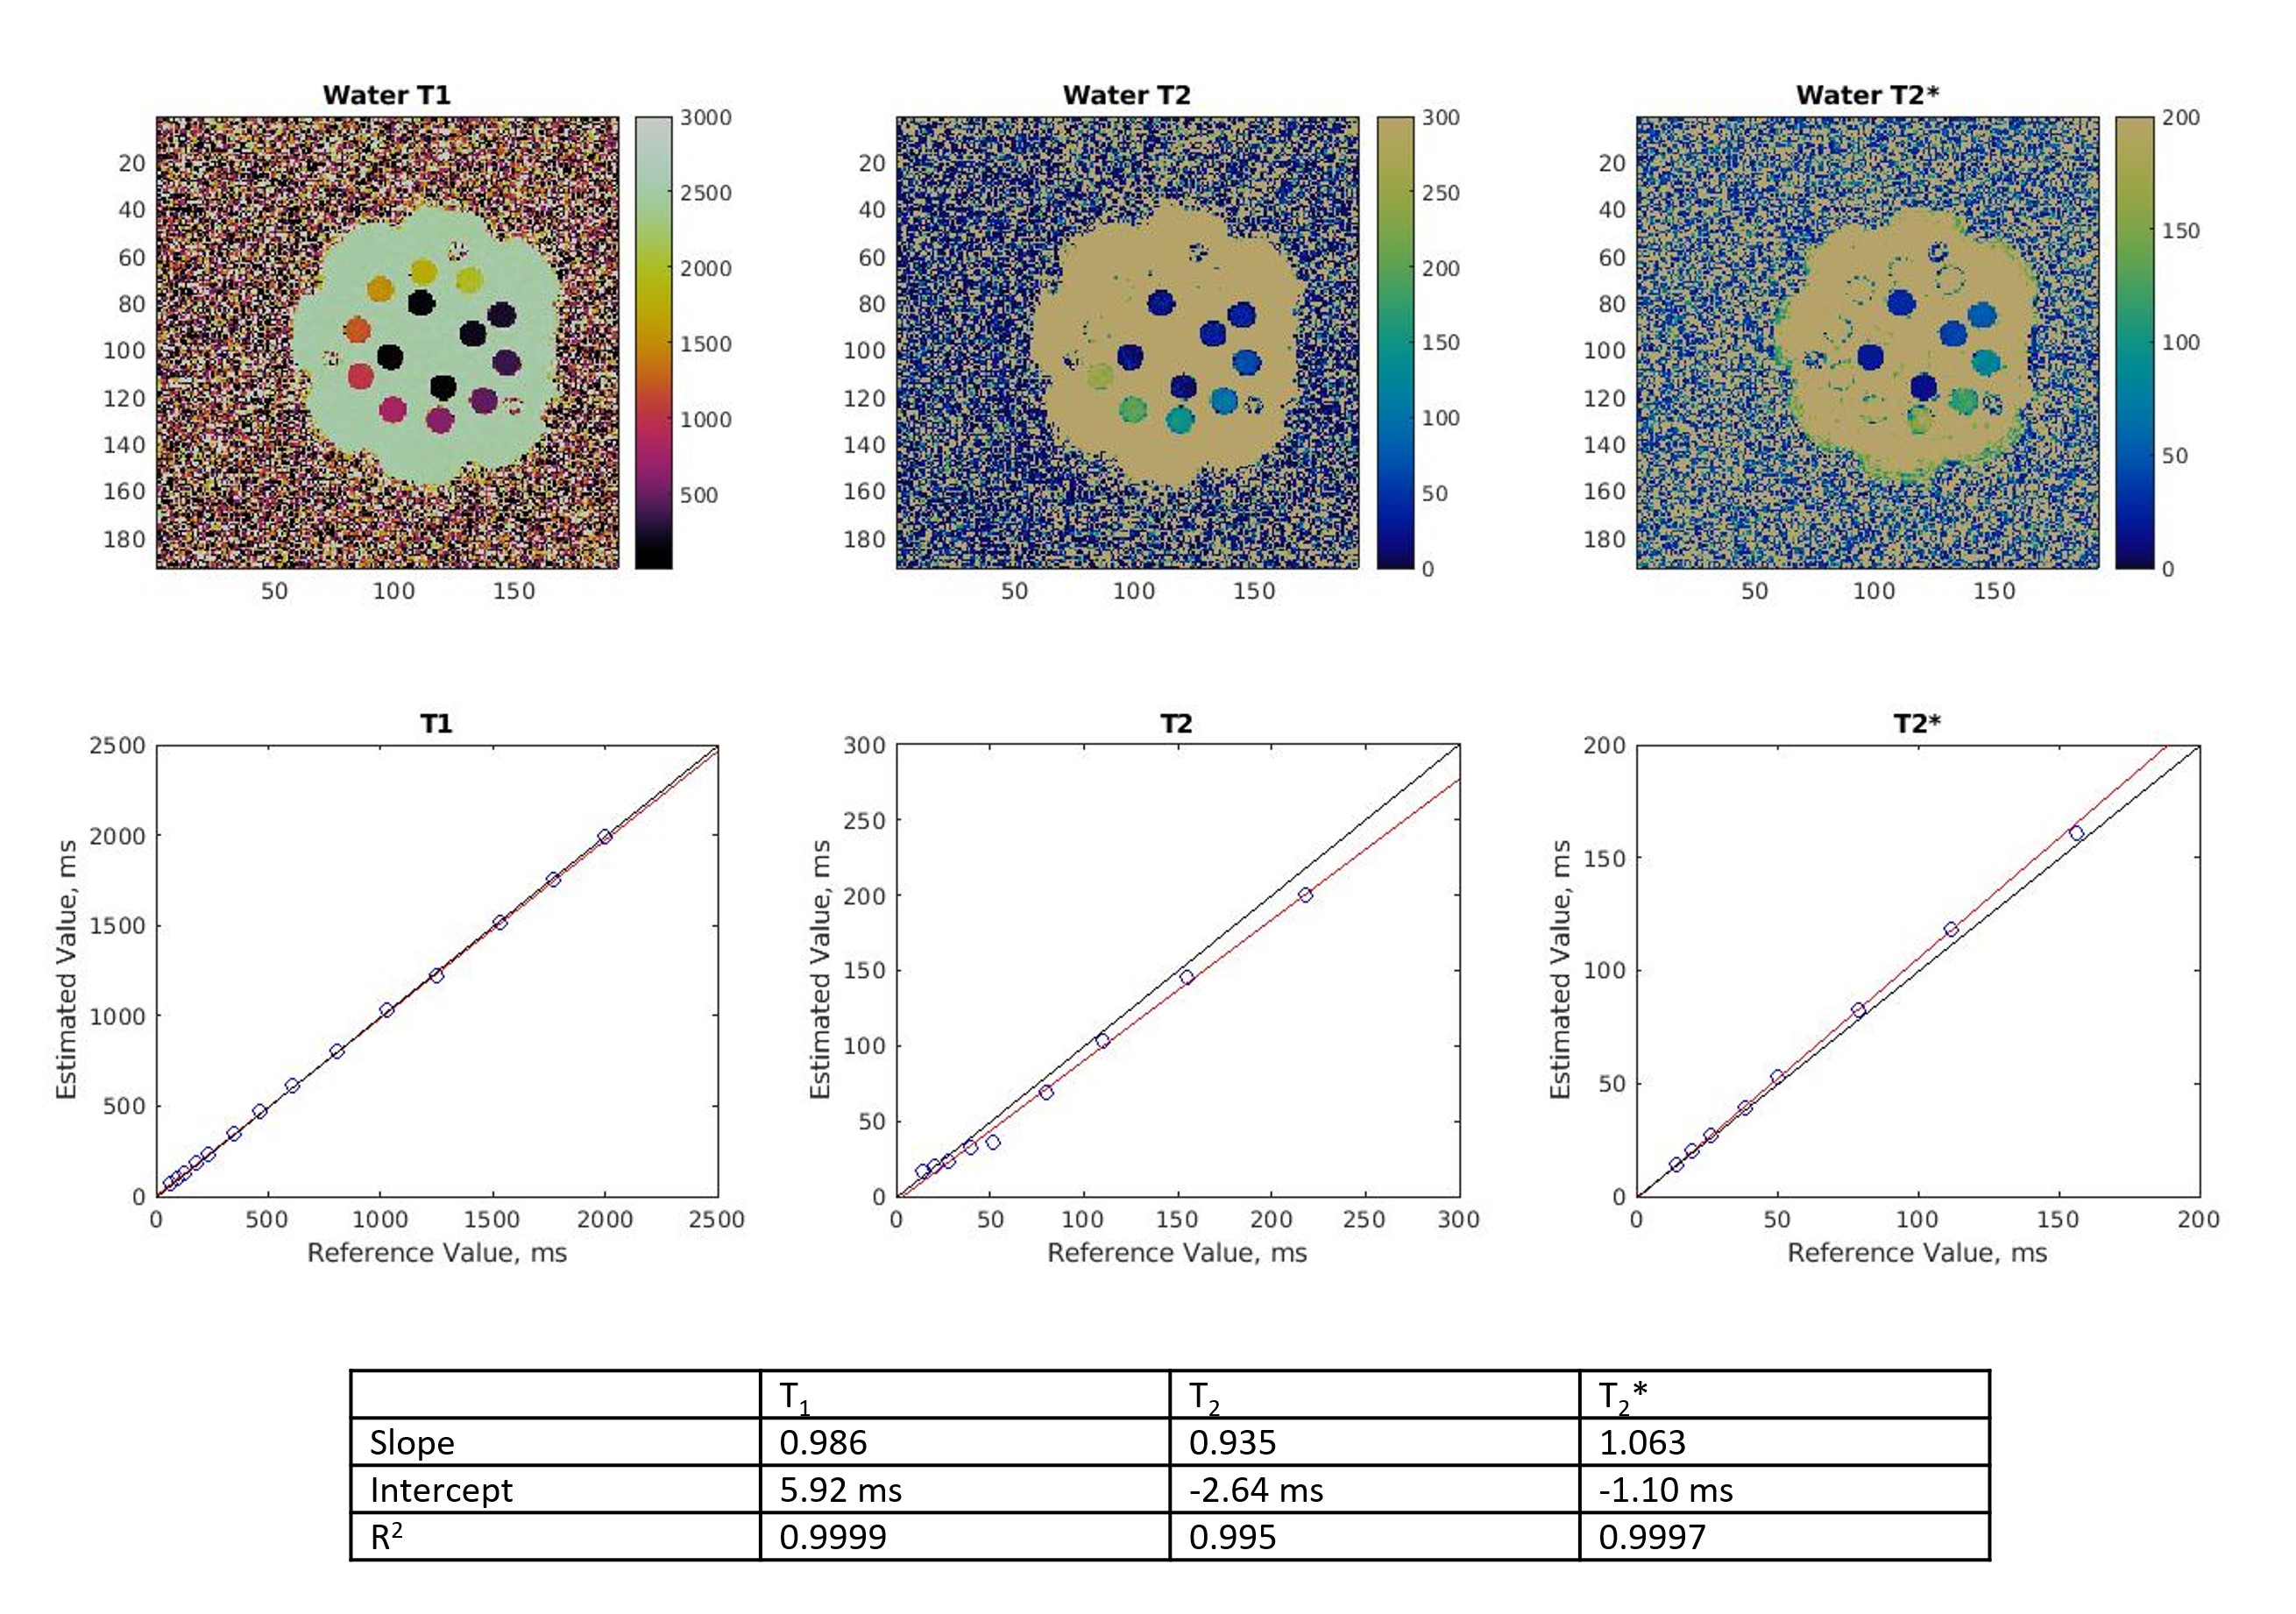
Linear regression was performed on the reconstructed parameter maps of the ISMRM/NIST phantom to determine the accuracy of the method. T2 values greater than 300 ms and T2* values greater than 150 ms were excluded from the regression. Results from the volunteers were compared to the reference scans, as well as reported literature values3.
Results
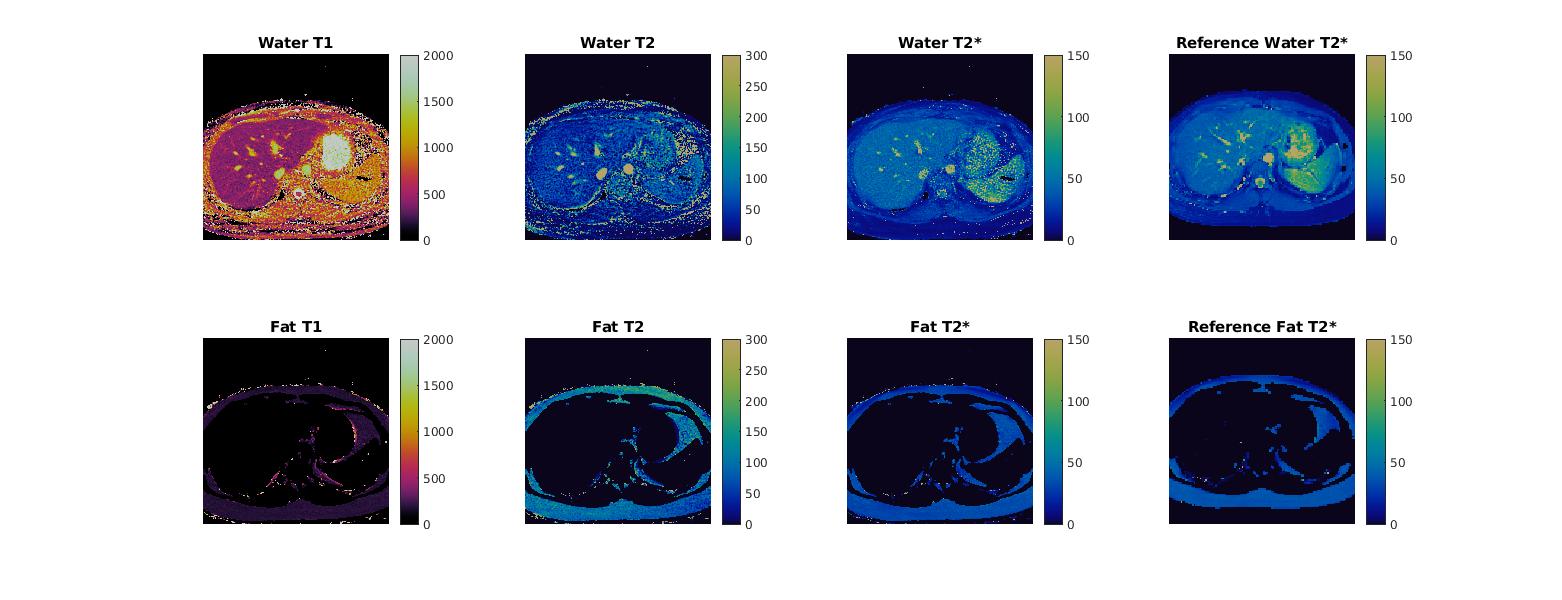
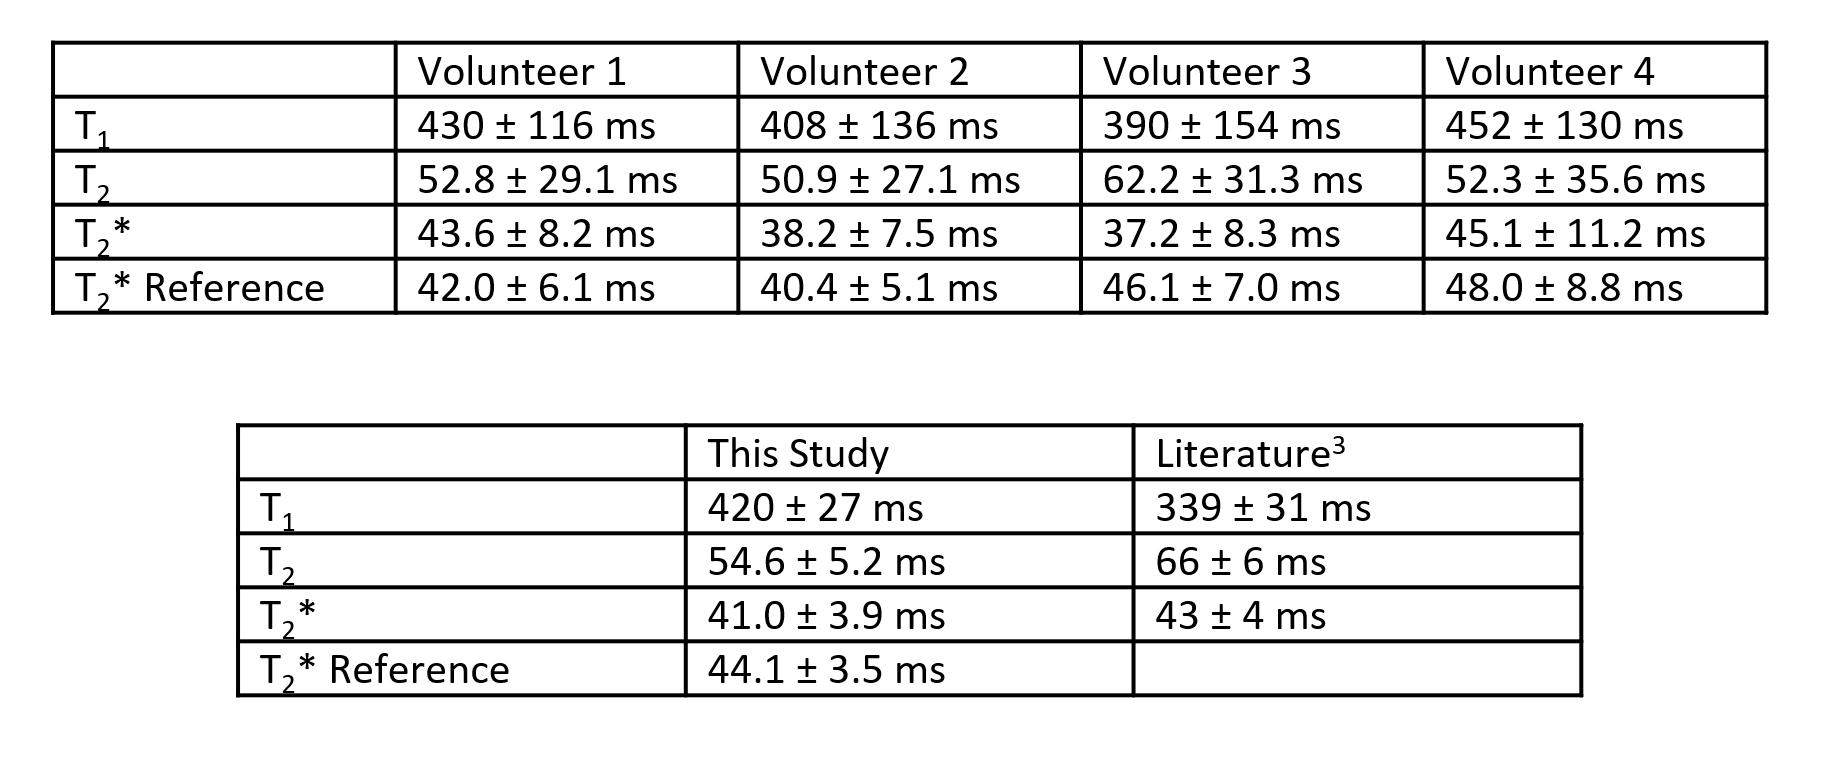
Reconstructed maps from the phantom experiment are shown in Figure 2, along with regression plots comparing experimental T1, T2, and T2* values to the reference values.Representative maps from one volunteer are shown in Figure 3, and quantitative data from all volunteers are shown in Figure 4. Mean T1 values for this study were 420 ms, mean T2 values for this study were 54.6 ms, and mean T2* values for this study were 41.0 ms. Rosette MRF, GRE, and literature3 were in agreement on T2* values.
Discussion
Overall, the phantom experiments show good agreement between the experimental and reference values in the ISMRM/NIST MRI system phantom. The rosette MRF T2* values measured in the liver agree with both the Cartesian GRE reference scans, as well as published literature values for healthy volunteers at 0.55T. T1 values measured with MRF were approximately 81 ms longer than those reported in the literature for liver at 0.55T, and T2 values were 11 ms lower. The differences between MRF measurements in this study and previous literature values are similar to the differences seen at higher field strengths7,9,13, and the variation between volunteers in this study is similar to the variation seen in literature3.Conclusion
T2* maps can be collected simultaneously with T1 and T2 using the rosette MRF technique, even at lower field strengths.Acknowledgements
NSF/CBET 1553441, NIH/NHLBI R01HL094557, Siemens HealthineersReferences
1. Sirlin CB, Reeder SB. Magnetic Resonance Imaging Quantification of Liver Iron. Magn Reson Imaging Clin N Am 2010; 18(3):359-381
2. Triadyaksa P, Oudkerk M, Sijens PE. Cardiac T2* Mapping: Techniques and Clinical Applications. J Magn Reson Imaging 2020; 52:1340-1351
3. Campbell-Washburn AE, Ramasawmy R, Resivo MC, et al. Opportunities in Interventional and Diagnostic Imaging by Using High-performance Low-Field-Strength MRI. Radiology 2019; 293(2):384-393
4. Campbell-Washburn AE, Mancini C, Conrey A, et al. Evaluation of Hepatic Iron Overload Using a Contemporary 0.55T MRI System. Journal Magn Reson Imaging. 2021;
5. Ma D, Gulani V, Seiberlich N, et al. Magnetic Resonance Fingerprinting. Nature 2013; 495:187-192
6. Hamilton JI, Jiang Y, Chen Y, et al. MR Fingerprinting for Rapid Quantification of Myocardial T1, T2, and Proton Spin Density. Magn Reson Med 2017; 1446-1458
7. Jaubert O, Arrieta C; Cruz G, et al. Multi-parametric liver tissue characterization using MR fingerprinting: Simultaneous T1, T2, T2*, and fat fraction mapping. Magn Reson Med 2020; 84:2625-2635
8. Noll DC. Multishot Rosette Trajectories for Spectrally Selective MR Imaging. IEEE Trans Med Imaging 1997; 16(4):372-377
9. Liu Y, Hamilton J, Eck B, et al. Myocardial T1 and T2 quantification and water-fat separation using cardiac MR fingerprinting with rosette trajectories at 3T and 1.5T. Magn Reson Med 2021; 85(1):103-119
10. Bush AM, Sandino CM, Ramachandran S, et al. Rosette Trajectories Enable Ungated, Motion-Robust, Simultaneous Cardiac and Liver T2* Iron Assessment. J Magn Reson Imaging 2020; 52(6):1688-1698
11. Fessler JA, Sutton BP. Nonuniform fast Fourier transforms using min-max interpolation. IEEE Trans Signal Processing. 2003; 51:560-574
12. Hamilton JI, Jiang Y, Ma D, et al. Investigating and reducing the effects of confounding factors for robust T1 and T2 mapping with cardiac MR fingerprinting. Magn Reson Imaging 2018; 53:40-51
13. Chen Y, Jiang Y, Pahwa S, et al. MR Fingerprinting for Rapid Quantitative Abdominal Imaging. Radiology. 2016; 279(1):278-286
Figures