0563
Fast CEST MR Fingerprinting with Increased Volumetric Coverage using Slice Permuted Acquisition and Deep Learning Reconstruction1Medical Physics, Memorial Sloan Kettering Cancer Center, New York, NY, United States, 2Radiology, Memorial Sloan Kettering Cancer Center, New York, NY, United States, 3Radiology, Athinoula A. Martinos Center, Charlestown, MA, United States
Synopsis
CEST imaging is a promising tool for diagnosis and evaluation of treatment response in tumors. However, conventional CEST is not quantitative and requires long acquisition times. A recently developed technique, CEST MR fingerprinting (CEST-MRF), overcomes many of the technical limitations of conventional CEST but still suffers from limited volumetric coverage. In this work, we propose a novel multi-slice CEST-MRF pulse sequence and deep learning reconstruction method to enable volumetric coverage without the need for additional scan time. Numerical simulations and in vivo experiments in a healthy subject are performed to demonstrate feasibility and utility of the proposed multi-slice CEST-MRF technique.
Introduction
Interest in Chemical Exchange Saturation Transfer (CEST) imaging for cancer has increased in recent years, due to its ability to differentiate true-progression from pseudo-progression in brain tumors[1], [2]. Yet conventional CEST suffers from a qualitative signal, long scan times and complicated analysis that have limited clinical adoption. To overcome these, CEST was recently combined with MR fingerprinting (CEST-MRF)[3] to yield rapid and quantitative exchange rates and volume fractions maps. CEST-MRF has been demonstrated on pre-clinical[3]–[5] and clinical systems[6], but with reduced volumetric coverage. The goal of this work is to demonstrate a proof-of-concept for a rapid multi-slice CEST-MRF (msCEST-MRF) pulse sequence and reconstruction method for whole head coverage with short scan time (< 2 minutes). The accuracy of the msCEST-MRF approach is evaluated with numerical simulations and its utility in vivo is demonstrated in a healthy human subject.Methods
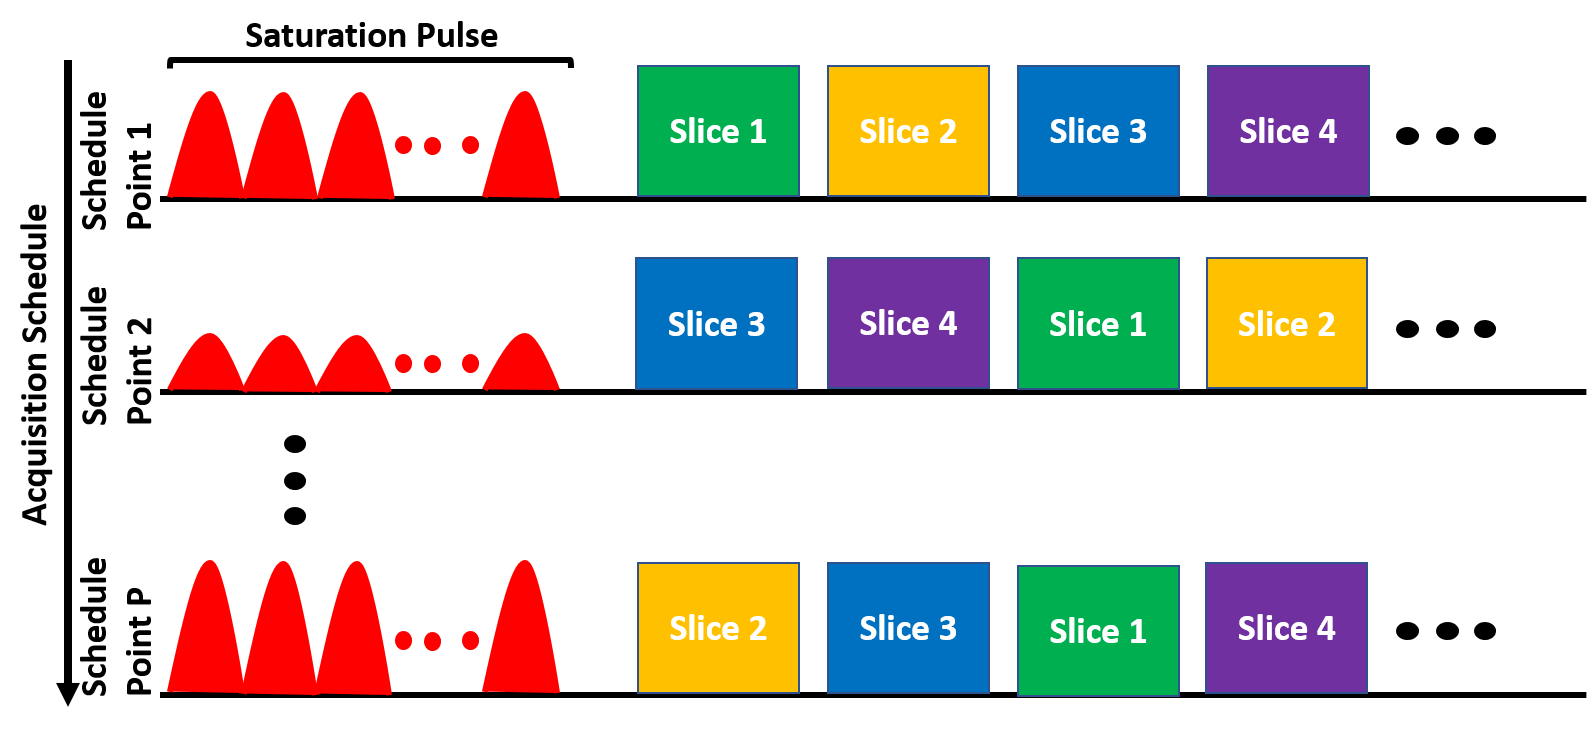
1. CEST-MRF with slice permuted acquisitionThe proposed pulse sequence diagram is shown in Figure 1. A gaussian-shaped saturation pulse train centered on the amide proton frequency (3.5 ppm) was used. The saturation power was varied according to a previously described schedule[3]. A set of N=14 slices were excited after the saturation pulse in each time point. Because the saturated magnetization undergoes T1 relaxation later slices will experience decayed magnetization and weaker signal. The slice excitation order was therefore varied for each schedule time point[7]. Here, a simple ‘skip-3’ circular shift ordering was used but optimized orderings will likely yield better results and are left for future work. The repetition time (TR), excitation flip angle (FA) and saturation duration (Tsat) were as follows: TR=3500 ms, FA=90°, Tsat=2560 ms. The signal from each slice was read with an EPI readout with partial Fourier factor of ~6/8, acceleration factor R=2 and an echo time (TE) of 24 ms. The matrix size was 224×224 with a FOV of 280 mm2 for an in-plane resolution of 1.25 mm2 and a slice thickness of 5 mm. The acquisition of each slice required ~64 ms and the total acquisition time for the 30 schedule time steps used was 105 seconds.
2. Tissue quantification
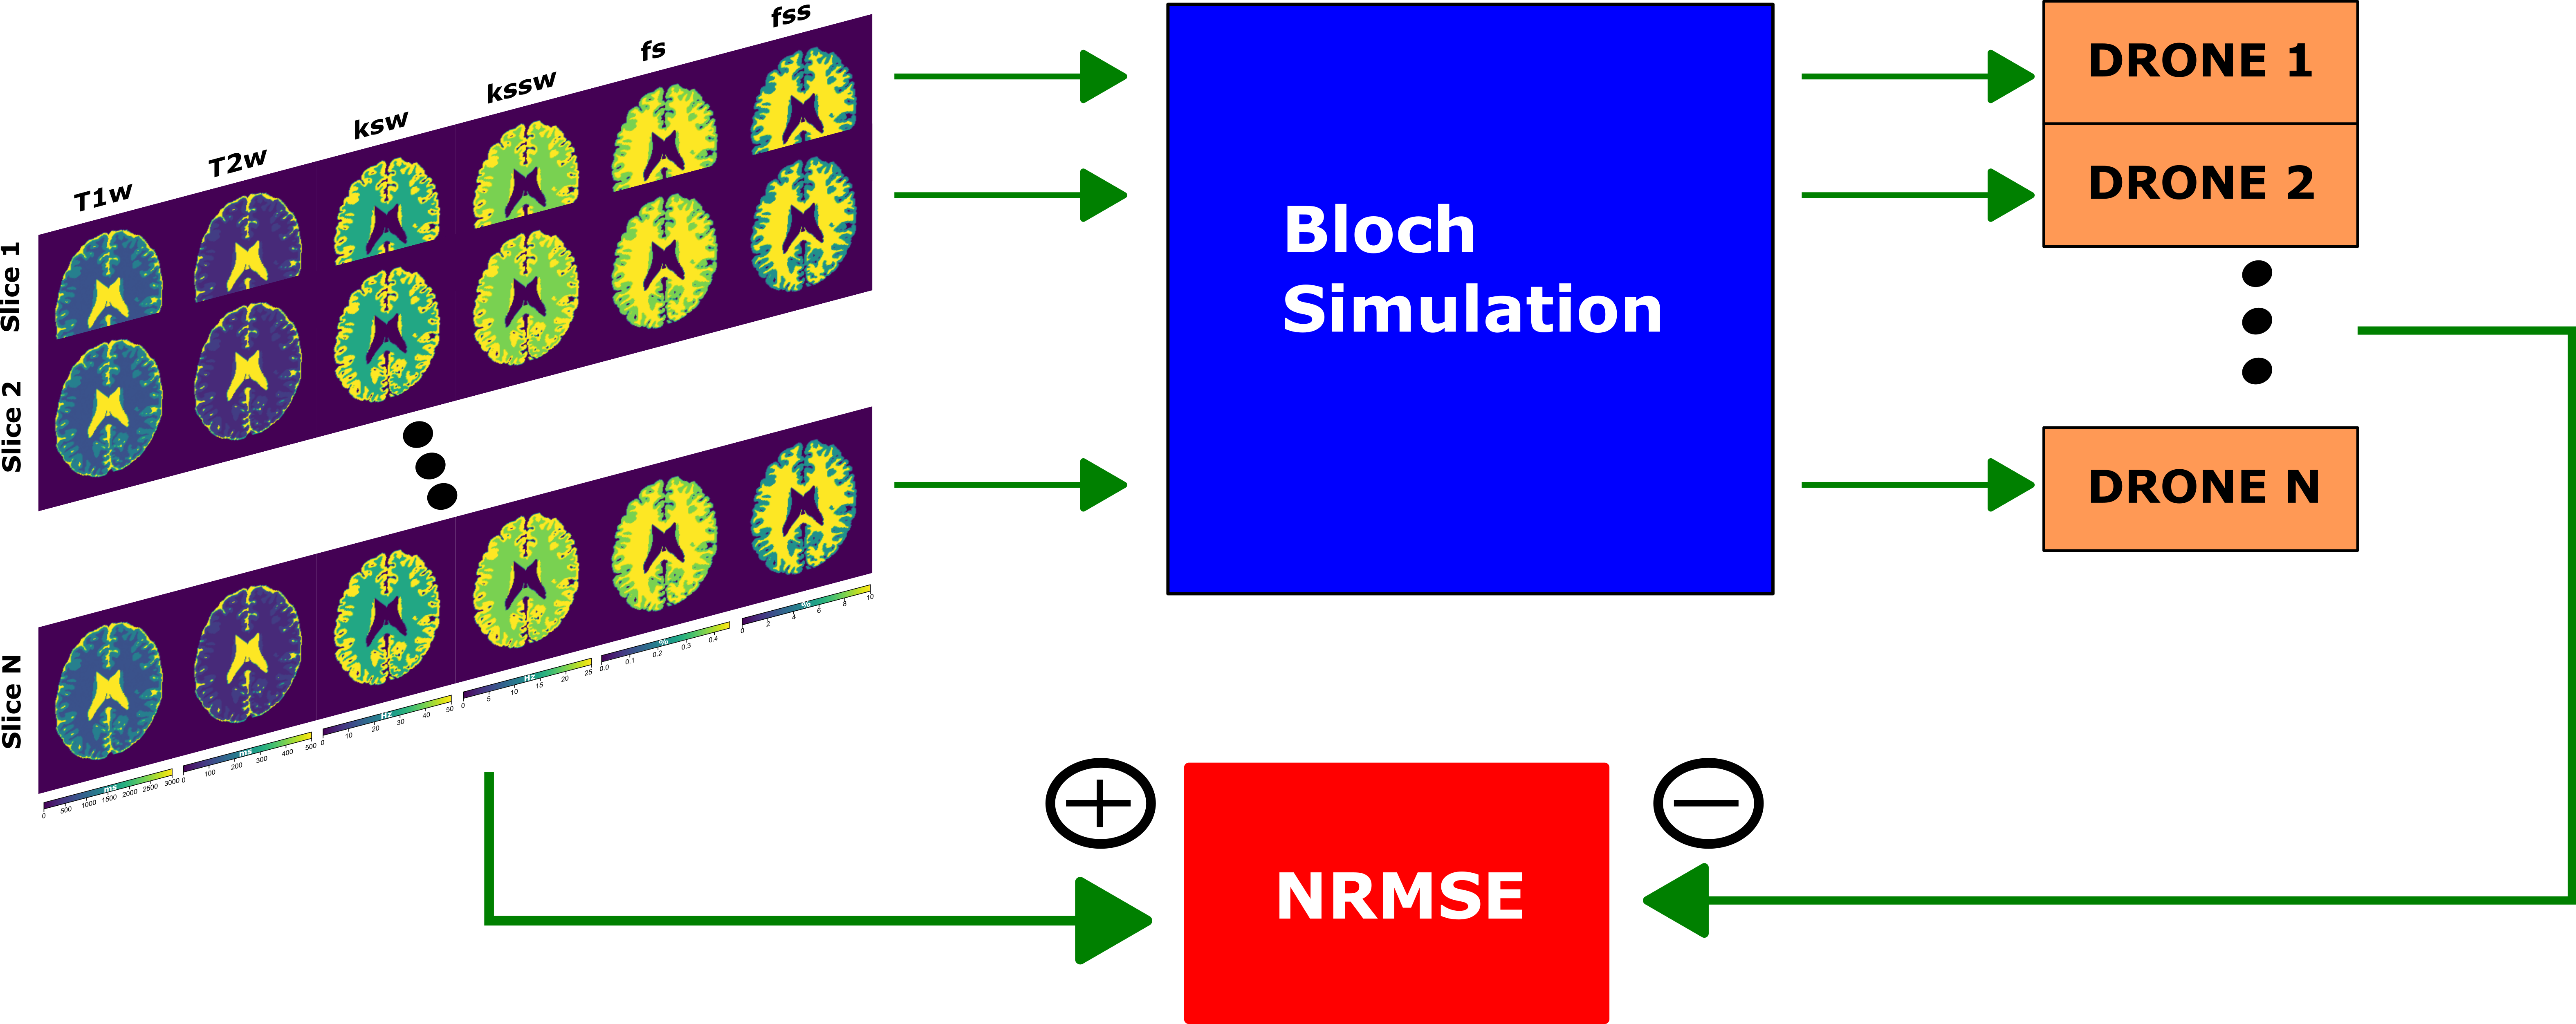
The tissue parameters were quantified with a 4-layer DRONE neural network[8] implemented in Pytorch. Since the signal from each slice undergoes a unique evolution based on its slice ordering, the data from each slice was reconstructed with a separately trained DRONE network. The training dataset consisted of 400,000 entries sampled from the ranges shown in Table 1.
3. Numerical simulations
The accuracy of the DRONE-reconstructed parameter maps was assessed in a modified Brainweb-based[9] digital phantom (Figure 2). A msCEST-MRF acquisition was simulated with the digital phantom and the normalized root-mean-square error (NRMSE) calculated. The same anatomical slice was used to simulate all slice orderings to eliminate confounds due to the different anatomy. White Gaussian noise was added to the data to obtain a range of signal-to-noise ratios (SNR) and the error calculated for each SNR. The msCEST-MRF error was compared to that of the single-slice CEST-MRF[6] sequence acquired with the same acquisition parameters.
4. In vivo human scan
A healthy, 31 years old female volunteer was recruited and gave informed consent in accordance with the institution IRB protocol. The subject was scanned with msCEST-MRF on a Signa Premier 3T scanner (GE Healthcare, Waukesha, WI) with a 48-channel head receiver coil. Raw data were extracted and reconstructed as described above.
Results
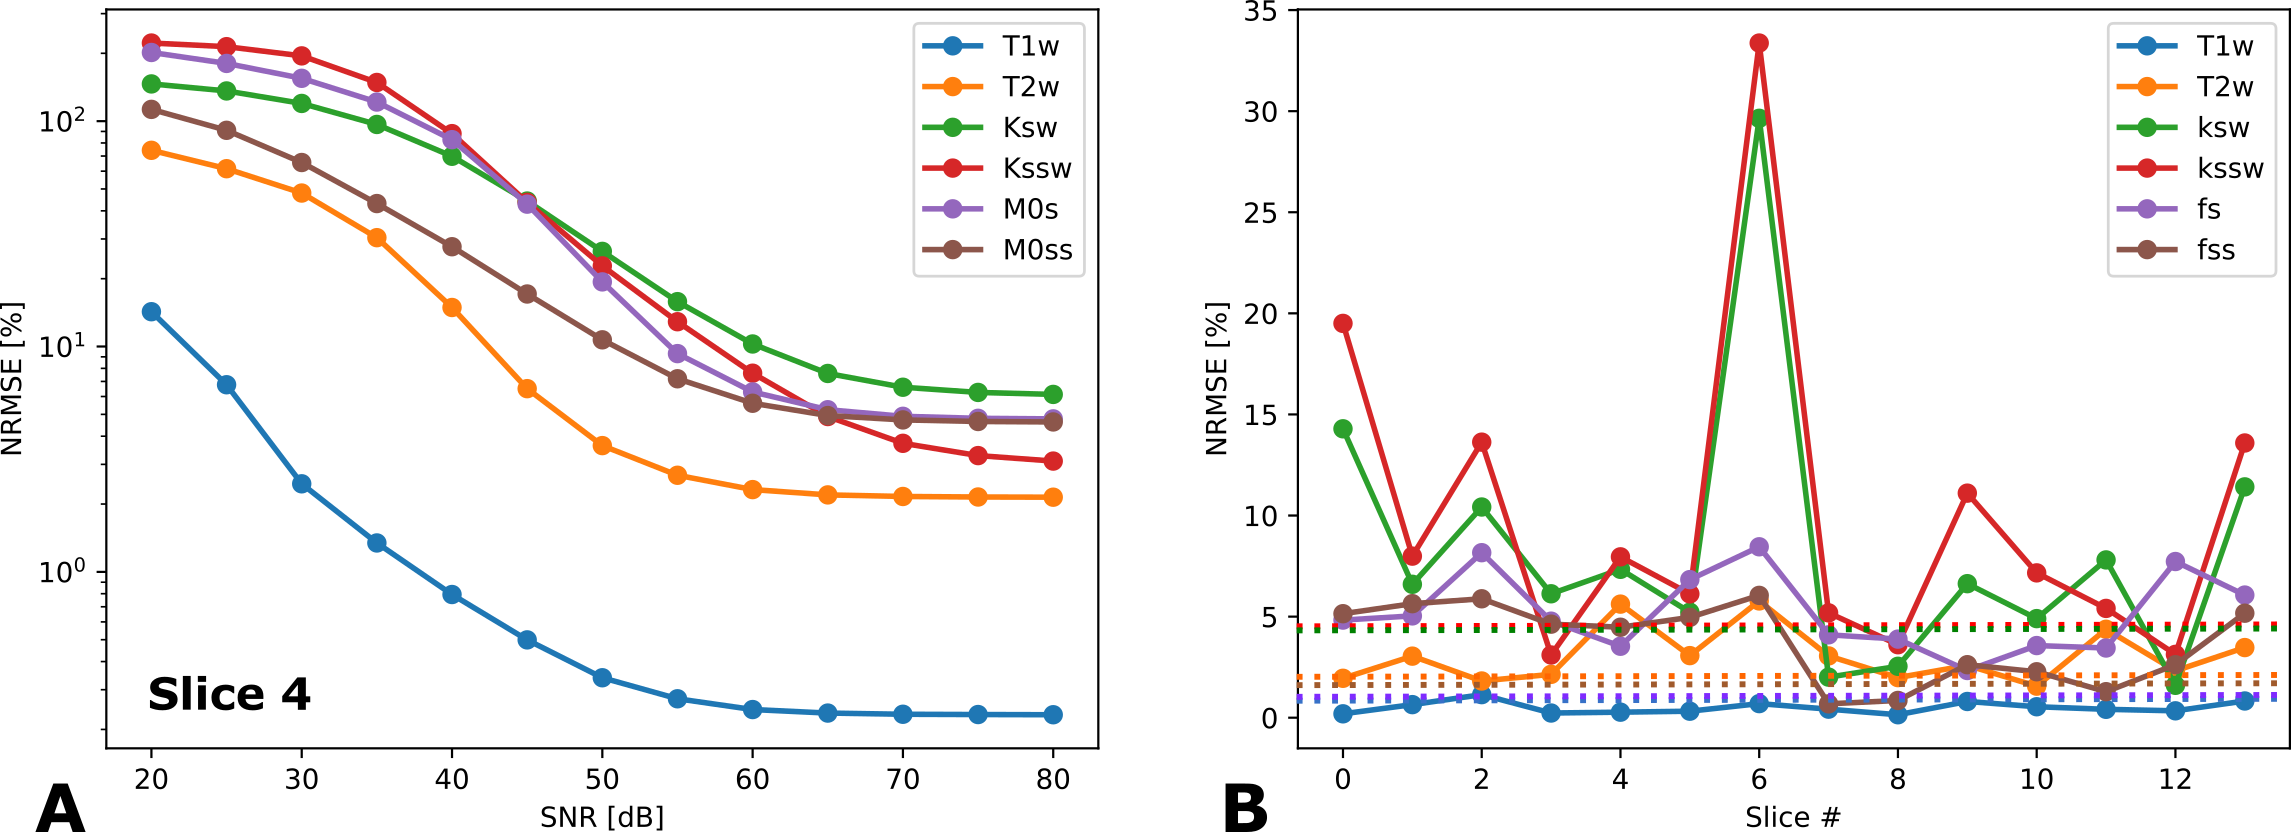
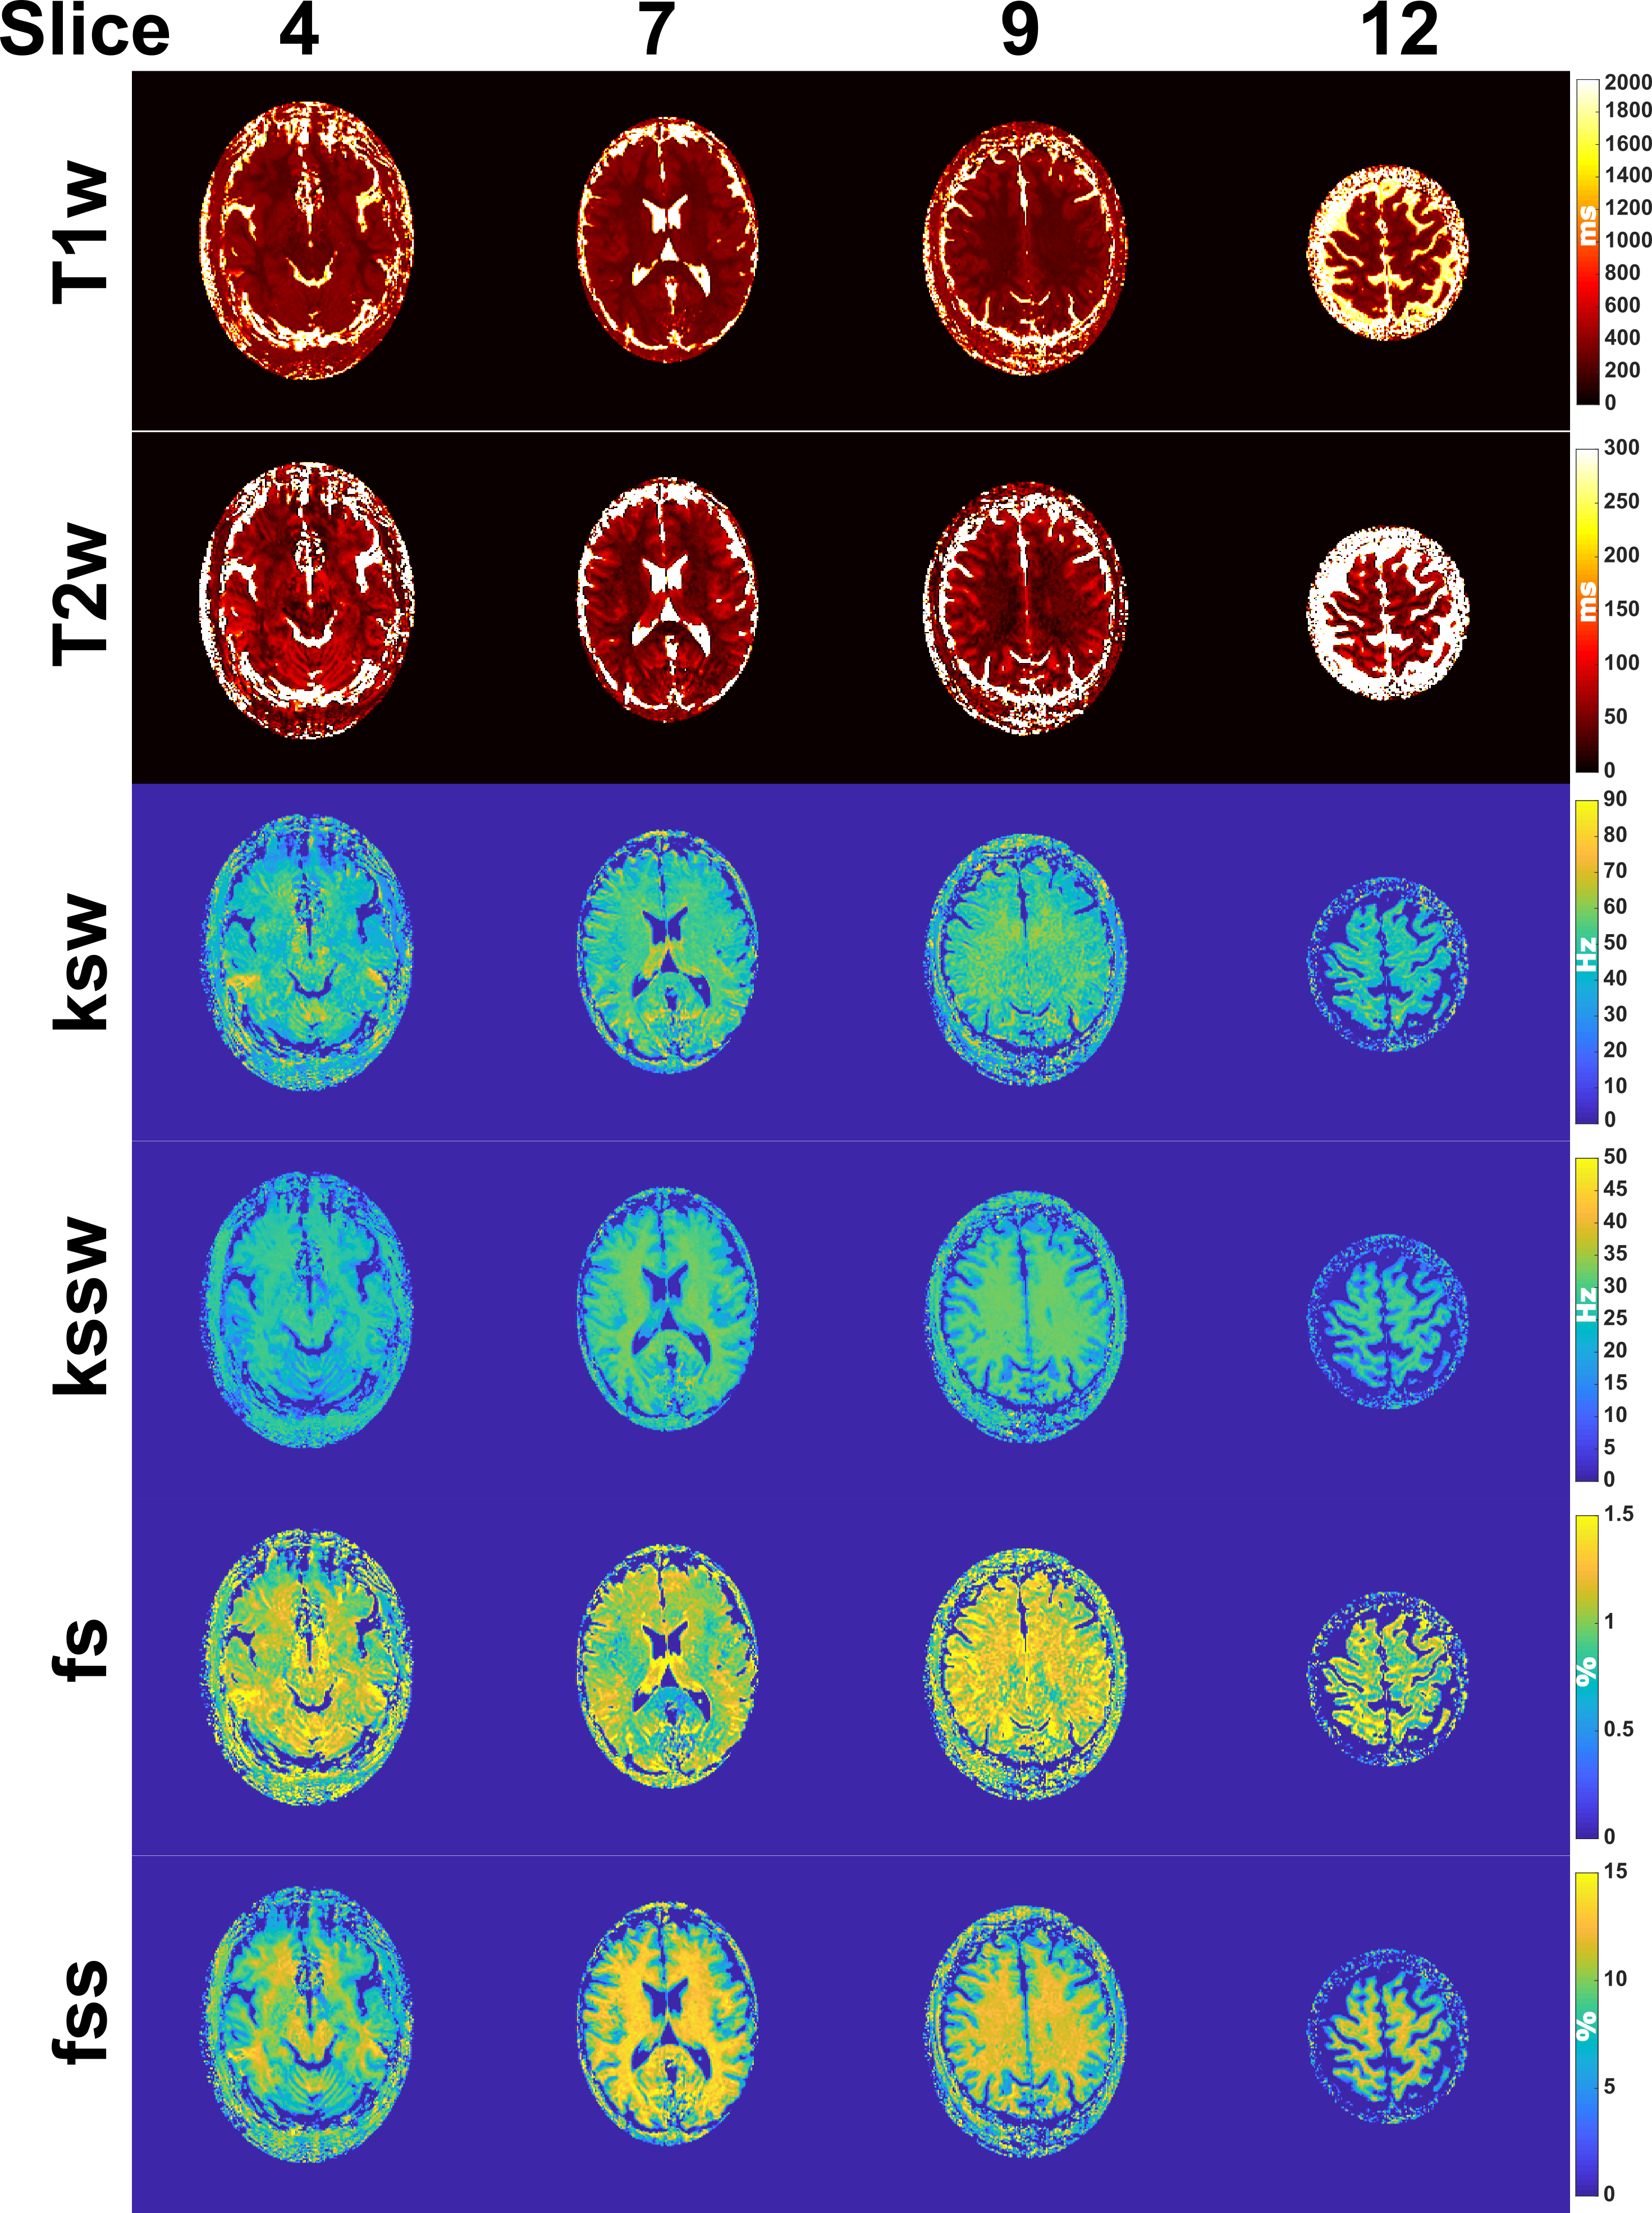
The NRMSEs for a single slice for a range of SNRs is shown in Figure 3A and that of all slices in Figure 3B in comparison to the single-slice error. The in vivo maps from the healthy volunteer for a subset of slices are shown in Figure 4. The CEST parameters were within the expected ranges while the water T1 and T2 were underestimated which resulted from the non-optimal slice ordering.Discussion/Conclusion
This work demonstrated a proof-of-concept for a novel volumetric CEST-MRF approach at no additional scan time. Several improvements can be made to the method to reduce the error and improve the spatial coverage. First, the slice ordering can be optimized. Optimizing the slice ordering and/or the acquisition schedule[4], [7], [10], [11] can reduce the error and a synergistic optimization of both may significantly improve tissue discrimination. Optimization over the space of permutations (orderings) is a difficult problem and finding a global optimum is impractical for all but a small number of slices. Nevertheless, various heuristics[12], [13] can be used to find a local minimum and reduce the error. Second, combining the pulse sequence with simultaneous multi-slice can multiply the spatial coverage and facilitate the slice ordering optimization while eliminating the need for training additional DRONE networks. Finally, the spatial coverage can also be increased by interleaving more slices in each TR at the cost of a modest (~30 seconds) increase in the total scan time. An important consideration for CEST-MRF imaging over a large volume is potential B0 and B1 inhomogeneities. This can be addressed with additional B0 and B1 scans or by inclusion of these parameters in the DRONE training dataset, as was done with B1 in this work, at the cost of increased training complexity. These improvements will be explored in future studies.Acknowledgements
This work was partially supported by the NIH/NCI Cancer Center Support Grant/Core Grant (P30 CA008748).References
[1] B. Ma et al., “Applying amide proton transfer-weighted MRI to distinguish pseudoprogression from true progression in malignant gliomas,” J. Magn. Reson. Imaging, vol. 44, no. 2, pp. 456–462, 2016. [2] J. Zhou et al., “Differentiation between glioma and radiation necrosis using molecular magnetic resonance imaging of endogenous proteins and peptides,” Nat. Med., vol. 17, no. 1, pp. 130–134, 2011. [3] O. Cohen, S. Huang, M. T. McMahon, M. S. Rosen, and C. T. Farrar, “Rapid and quantitative chemical exchange saturation transfer (CEST) imaging with magnetic resonance fingerprinting (MRF),” Magn. Reson. Med., vol. 80, no. 6, pp. 2449–2463, 2018.
[4] O. Perlman, K. Herz, M. Zaiss, O. Cohen, M. S. Rosen, and C. T. Farrar, “CEST MR-Fingerprinting: practical considerations and insights for acquisition schedule design and improved reconstruction,” Magn. Reson. Med., vol. 83, no. 2, pp. 462–478, 2020.
[5] O. Perlman et al., “Quantitative imaging of apoptosis following oncolytic virotherapy by magnetic resonance fingerprinting aided by deep learning,” Nat. Biomed. Eng., 2021, doi: 10.1038/s41551-021-00809-7.
[6] O. Cohen, R. J. Young, O. Perlman, C. T. Farrar, and R. Otazo, “Development of a Clinical Chemical Exchange Saturation Transfer MR fingerprinting (CEST-MRF) Pulse Sequence and Reconstruction for Brain Tumor Quantification,” ArXiv Prepr. ArXiv210808333, 2021.
[7] O. Cohen and J. R. Polimeni, “Optimized inversion-time schedules for quantitative T1 measurements based on high-resolution multi-inversion EPI,” Magn. Reson. Med., vol. 79, no. 4, pp. 2101–2112, 2018.
[8] O. Cohen, B. Zhu, and M. S. Rosen, “MR fingerprinting deep reconstruction network (DRONE),” Magn. Reson. Med., vol. 80, no. 3, pp. 885–894, 2018.
[9] D. L. Collins et al., “Design and construction of a realistic digital brain phantom,” IEEE Trans. Med. Imaging, vol. 17, no. 3, pp. 463–468, 1998.
[10] O. Cohen, “MR Fingerprinting Schedule Optimization Network (MRF-SCONE),” in Proceedings of the International Society of Magnetic Resonance in Medicine, Montreal, May 11-May 16, p. 4531.
[11] O. Perlman, C. T. Farrar, and O. Cohen, “Deep Learning Global Schedule Optimization for Chemical Exchange Saturation Transfer MR Fingerprinting (CEST-MRF),” in Proceedings of the International Society of Magnetic Resonance in Medicine, Virtual Conference, Aug. 2020, p. 3576.
[12] S. Lin and B. W. Kernighan, “An effective heuristic algorithm for the traveling-salesman problem,” Oper. Res., vol. 21, no. 2, pp. 498–516, 1973. [13] K. L. Hoffman, M. Padberg, G. Rinaldi, and others, “Traveling salesman problem,” Encycl. Oper. Res. Manag. Sci., vol. 1, pp. 1573–1578, 2013.
Figures