0559
MR fingerprinting and complex-valued neural network for quantification of brain amyloid burden1Department of Radiology, Juntendo University, Tokyo, Japan, 2Department of Radiology, The University of Tokyo, Tokyo, Japan, 3Milliman Inc, Tokyo, Japan, 4Plusman LLC, Tokyo, Japan, 5Siemens Healthcare Japan KK, Tokyo, Japan, 6Siemens Healthcare GmbH, Erlangen, Germany, 7Department of Neurology, Juntendo University, Tokyo, Japan, 8Medical Center for Dementia, Juntendo University, Tokyo, Japan, 9Department of Neurosurgery, Juntendo University, Tokyo, Japan, 10Division of Nuclear Medicine, Department of Radiology, Juntendo University, Tokyo, Japan
Synopsis
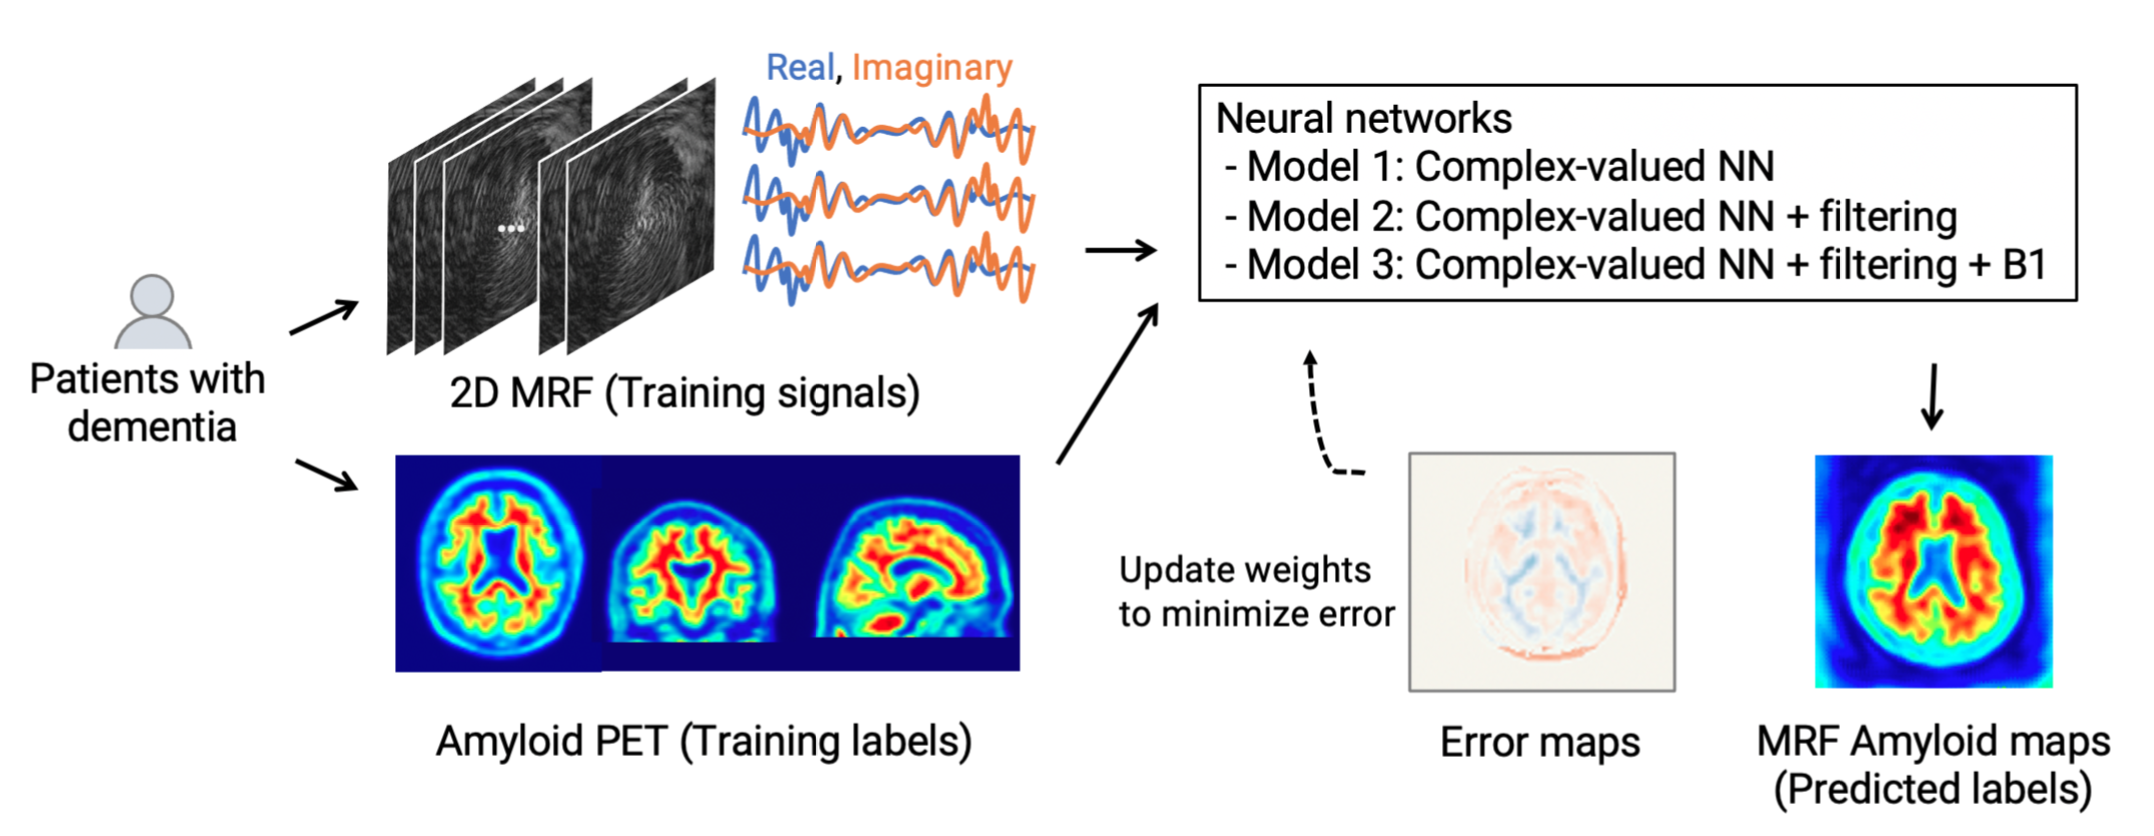
We developed a framework utilizing MR fingerprinting and a complex-valued neural network to detect brain amyloid burden. The tailored neural network was trained on real amyloid-PET imaging data and MR fingerprinting acquisitions to estimate PET-derived amyloid deposition from the MR fingerprinting signal evolutions. This complex-valued neural network architecture, designed to increase sensitivity to amyloid-related signals, showed a subject-level amyloid positivity classification with AUC = 0.87 in patients with cognitive decline. The proposed method enables non-invasive amyloid burden mapping, T1 and T2 mapping in a single scan, and is suitable not only for diagnosis but also for monitoring amyloid-reducing treatments.
Introduction
In vivo measurement of amyloid burden using PET is important for the early detection and definitive diagnosis of Alzheimer’s disease1,2. However, limited access, high cost, undesirable injections, and radiation exposure restrict the applicability of amyloid-PET scans. A recent study estimated brain amyloid burden using conventional contrast-weighted images3, suggesting the presence of subtle information in the MR signal associated with amyloid deposition. Although the original MR fingerprinting (MRF)4 was designed for T1 and T2 mapping, we hypothesized that amyloid-related information is encoded in the MRF time-course signal and using it would enable MRF-based amyloid detection.We developed a framework that quantifies voxel-level amyloid burden in the brain without undesirable exposure or injection with MR fingerprinting and neural networks. The complex-valued neural networks5 were trained using actual amyloid-PET data enabling it to decode the “hidden” amyloid-related information encoded in the MRF signal evolutions.
Methods
Data acquisitionThe study overview is shown in Figure 1. This prospective study in compliance with the local IRB included 23 patients with cognitive decline who had undergone amyloid-PET imaging within the previous year (13 men and 10 women; age, 78.5 ± 4.4 [73–88]; MMSE, 22.9 ± 3.4 [17–29]). PET scans were performed on a PET-CT scanner (Biograph mCT Flow, Siemens Healthcare, Erlangen, Germany) with a standard protocol after florbetapir F18 injection (Amyvid, FUJIFILM Toyama Chemical, Tokyo, Japan)6,7. Subject-wise amyloid positivity was determined using an established cortical-to-cerebellar standard uptake value ratio (SUVr)8. MRF data were acquired on a 3T MRI system (MAGNETOM Skyra, Siemens Healthcare, Erlangen, Germany) using a 20-channel head coil with a prototype MRF 2D FISP sequence9 with 3000 spiral readouts and B1 correction10. Fourteen equally spaced slices covering the entire brain were acquired in 9.5 min. MRF spatial resolution was set to 2×2 mm in-plane, and matched to that of amyloid-PET, to reduce under-sampling artifacts and increase the extraction efficiency of amyloid-related signals.
Image preprocessing
MRF T1, T2, and B1 maps were reconstructed on the console. PET images were co-aligned to the MRF space using brain imaging software (SPM12, UCL) on MATLAB (MATLAB2019a, Mathworks) using MRF T1 maps as inputs. MRF masks, based on T1 and B1 thresholding, were used to mask the extra-cranial regions for subsequent analysis.
Network architecture
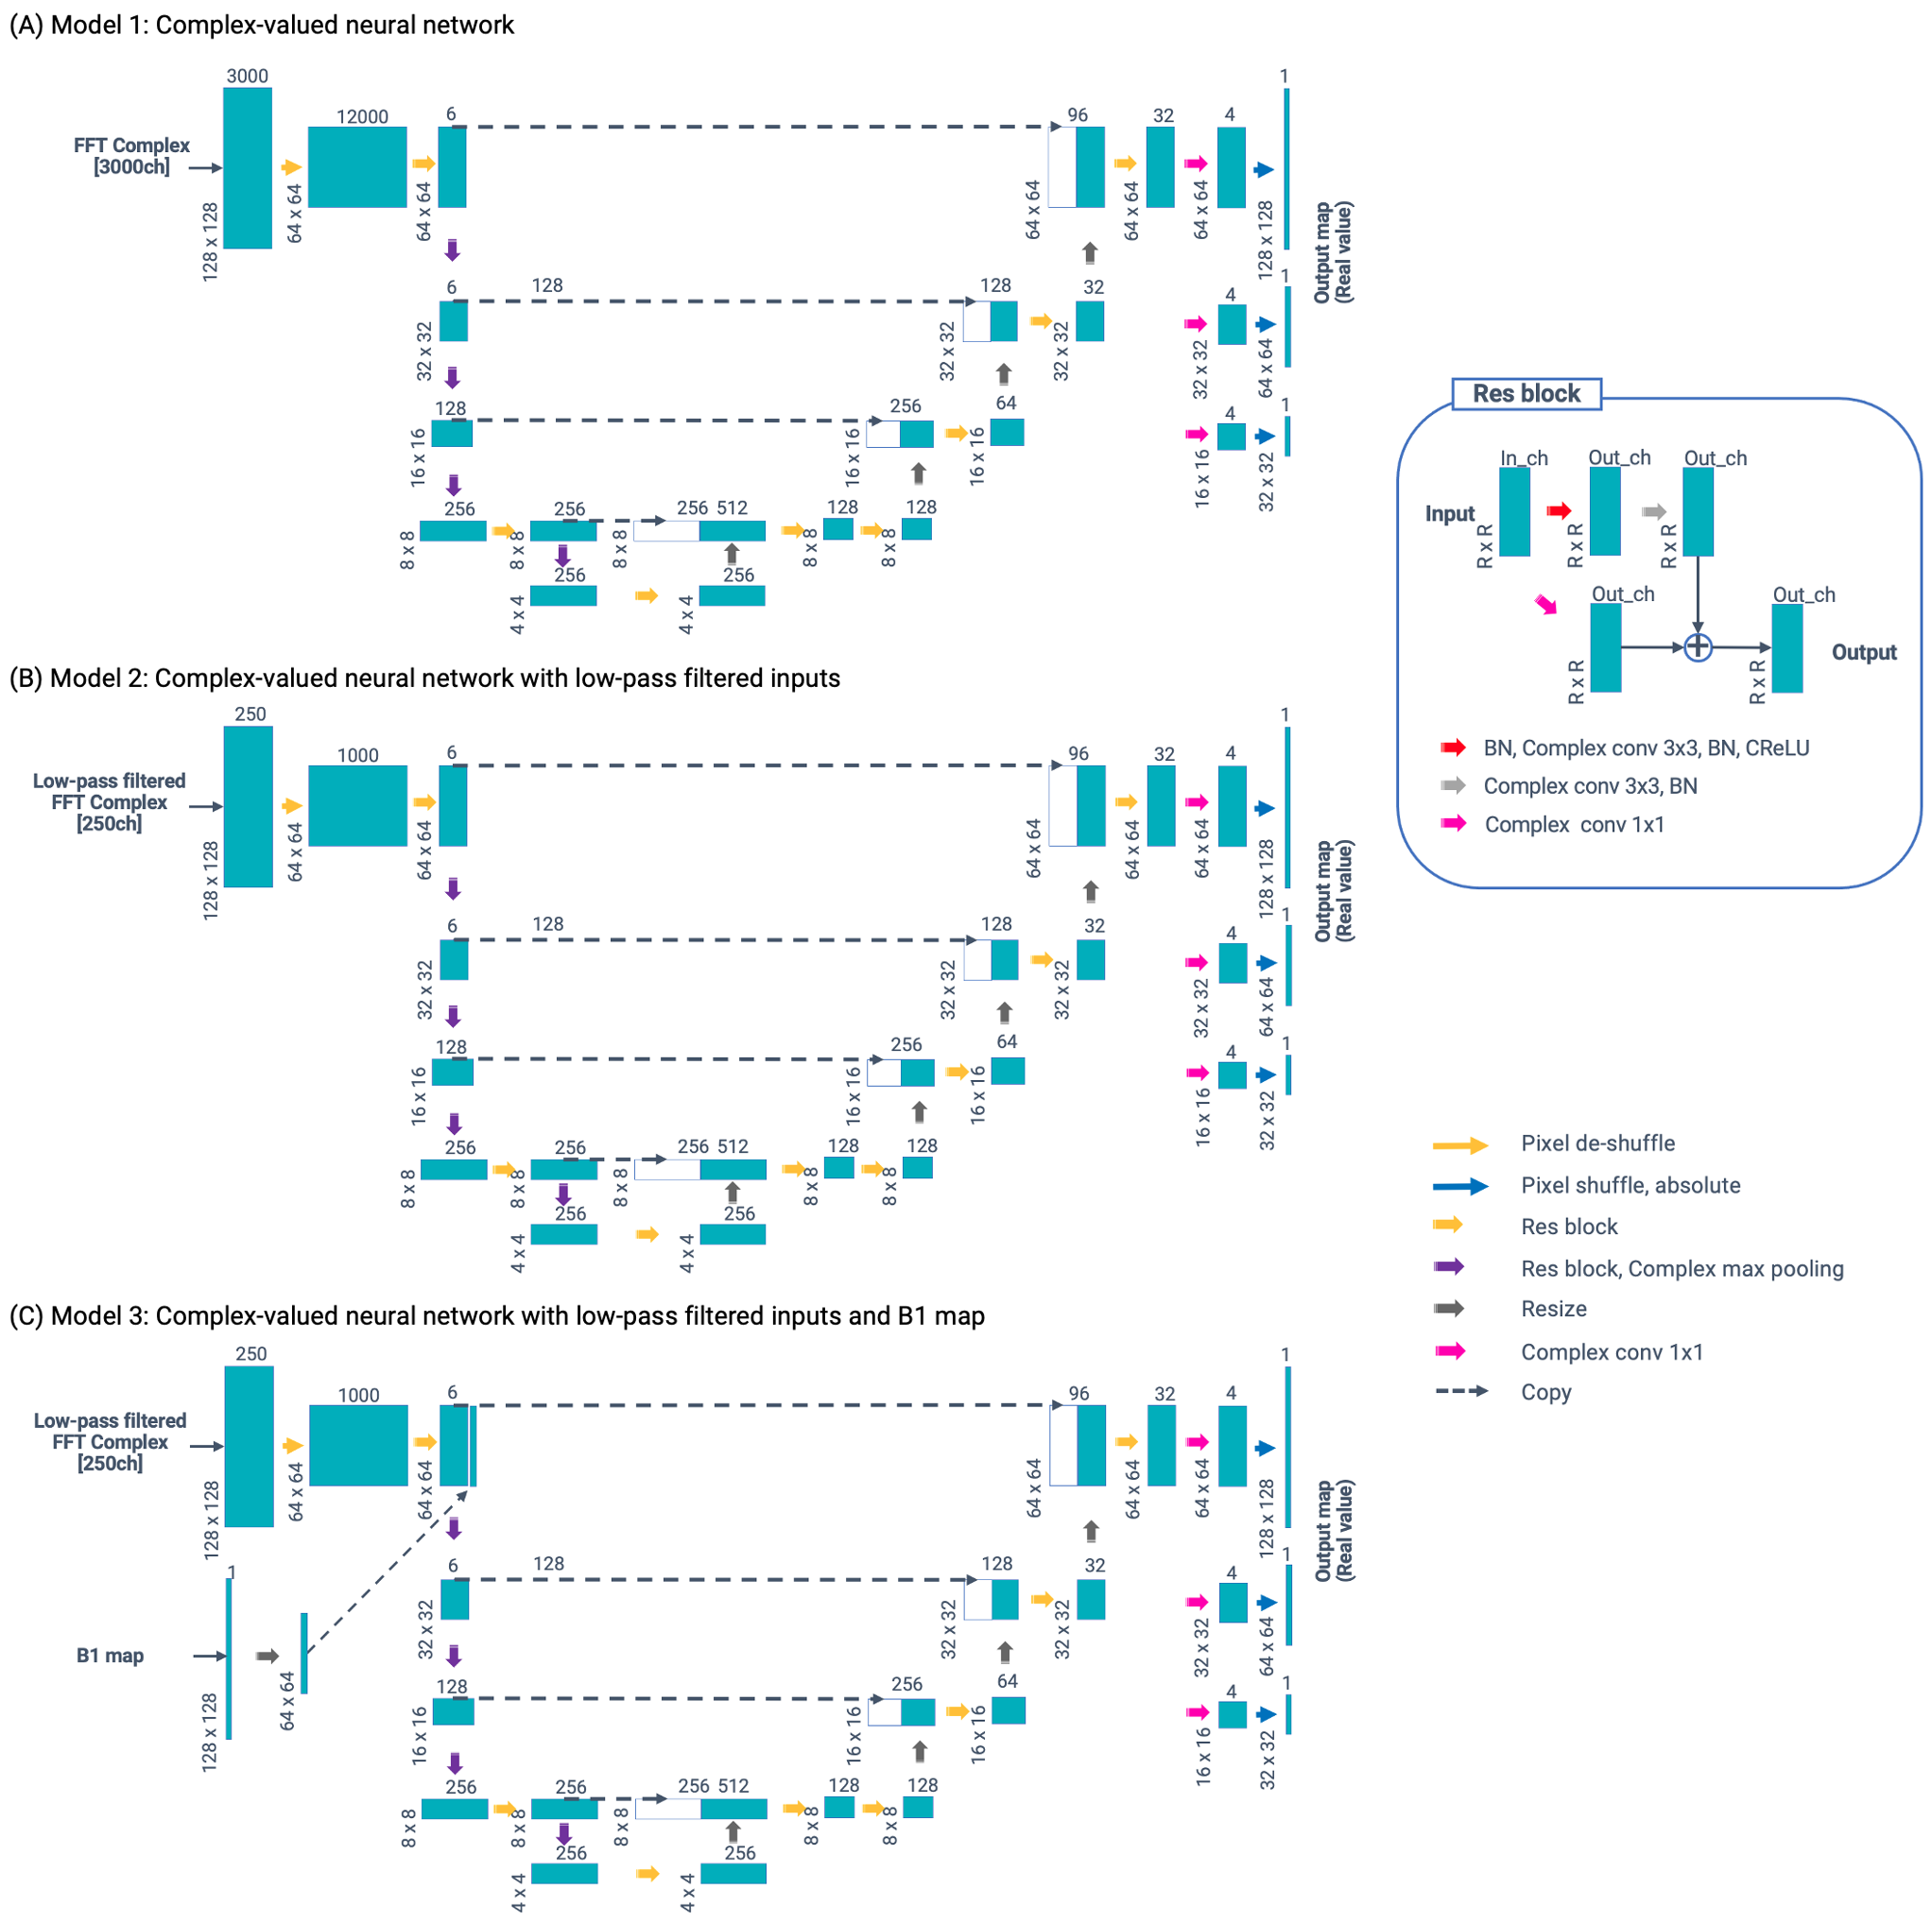
The network architecture is illustrated in Figure 2. We utilized a modified U-net model11 to design an inverse mapping function to convert the MRF signals to their corresponding amyloid burden. To include the phase information in the MRF time-course signal, complex-valued neural networks were used instead of common 2-channel real-value networks12. The following three models were prepared:
- Model 1: Complex-valued neural network
- Model 2: Complex-valued neural network with time-domain low-pass filtering
- Model 3: Complex-valued neural network with time-domain low-pass filtering + B1 map
Network Training Procedure
Each model was trained by feeding PET image slices with the corresponding MRF data from each training subject slice-by-slice. The weighted mean squared error with the corresponding amyloid-PET images was calculated as the loss function. Pixels whose SUVr was lower than the established threshold (i.e., SUVr = 1.2) were weighted 10 times larger than the others. As a preferred model selection strategy, we calculated the area under the curve (AUC) from receiver operating characteristic analysis on validation data by using the mean SUVr value of cerebral gray matter. The number of training epochs was 200, and the optimizer was Ada-belief13 with the default parameter set. The model’s performance was evaluated using the Youden index and AUC with 6-fold cross-validation using PET data as reference standard.
Results
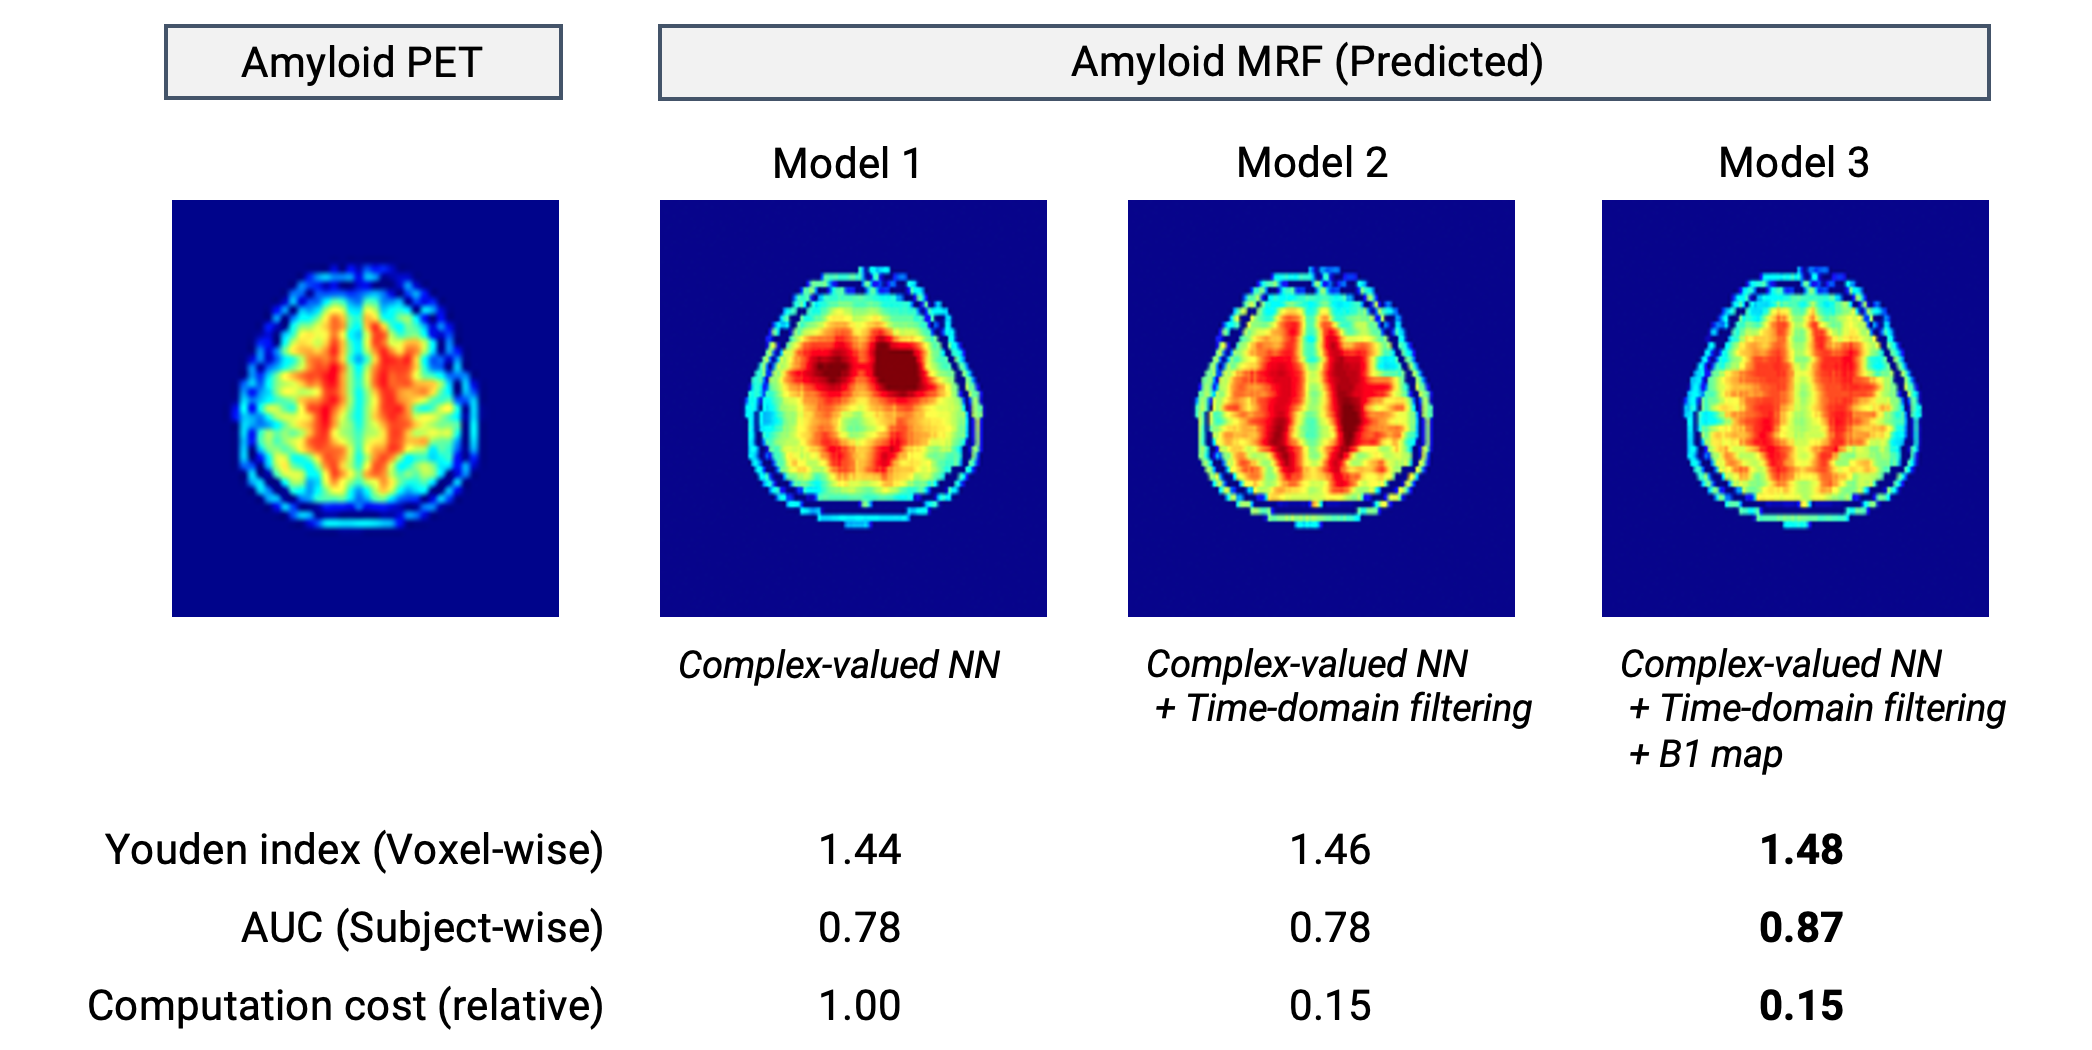
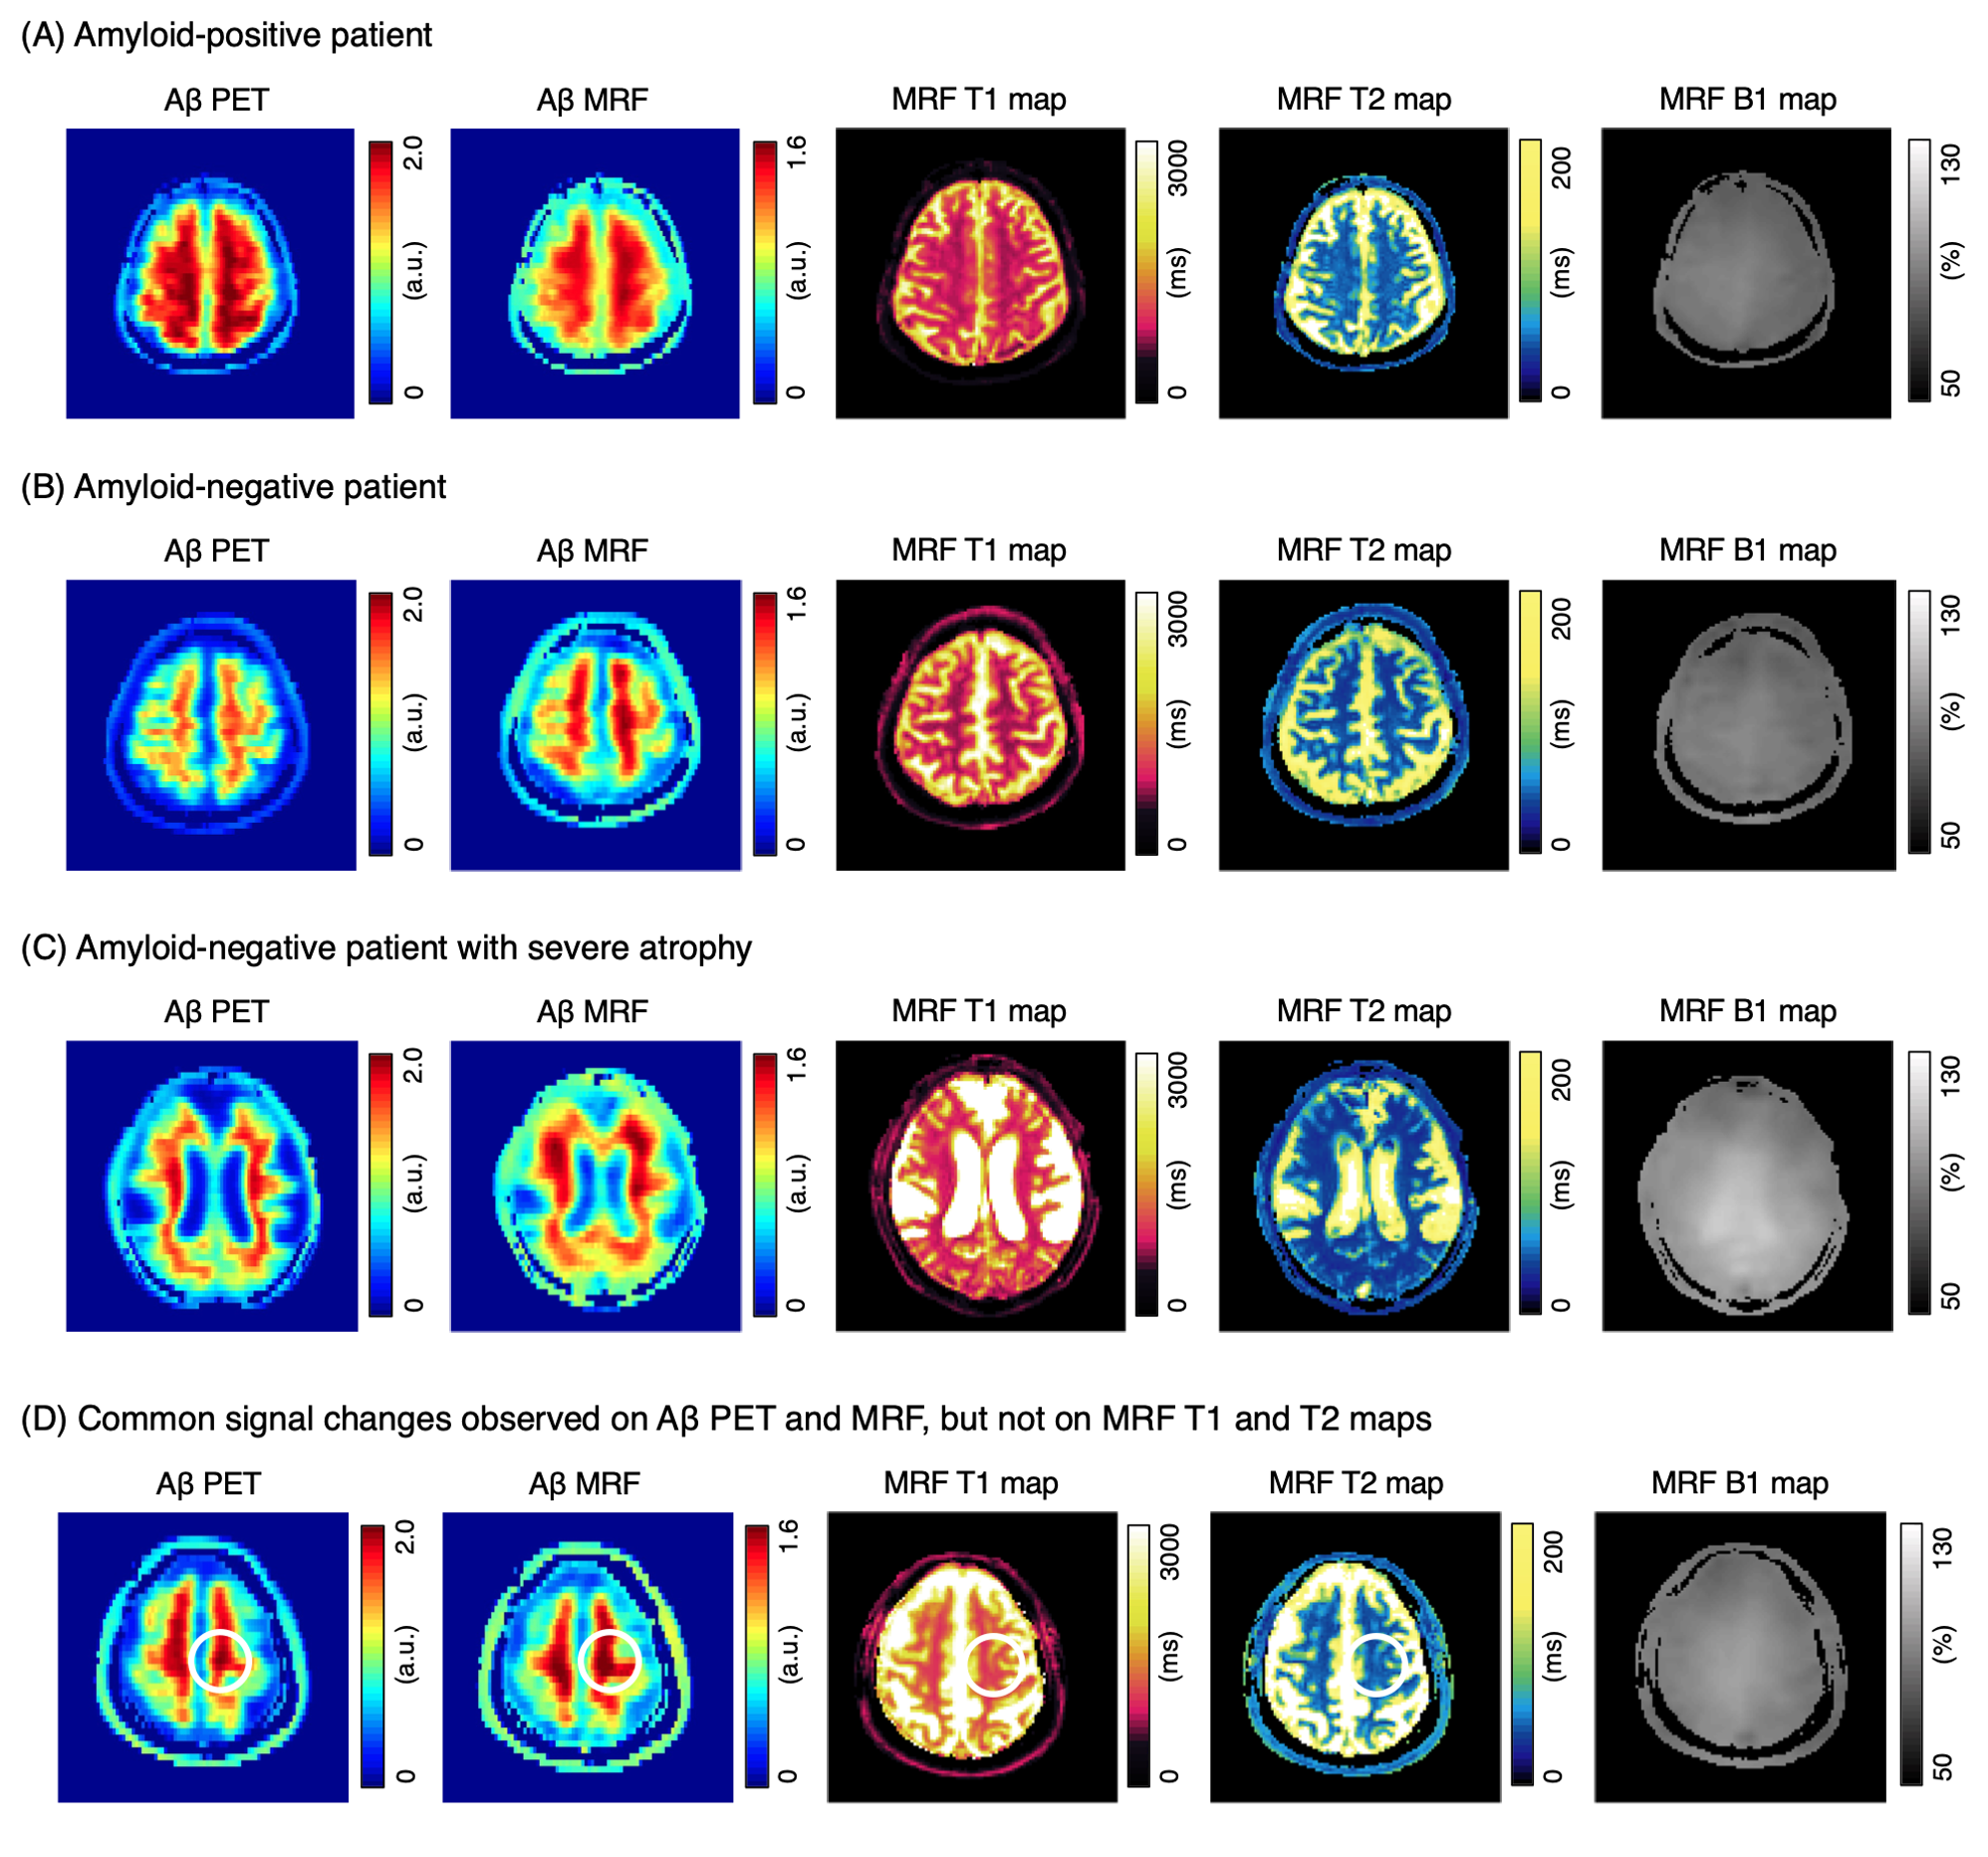
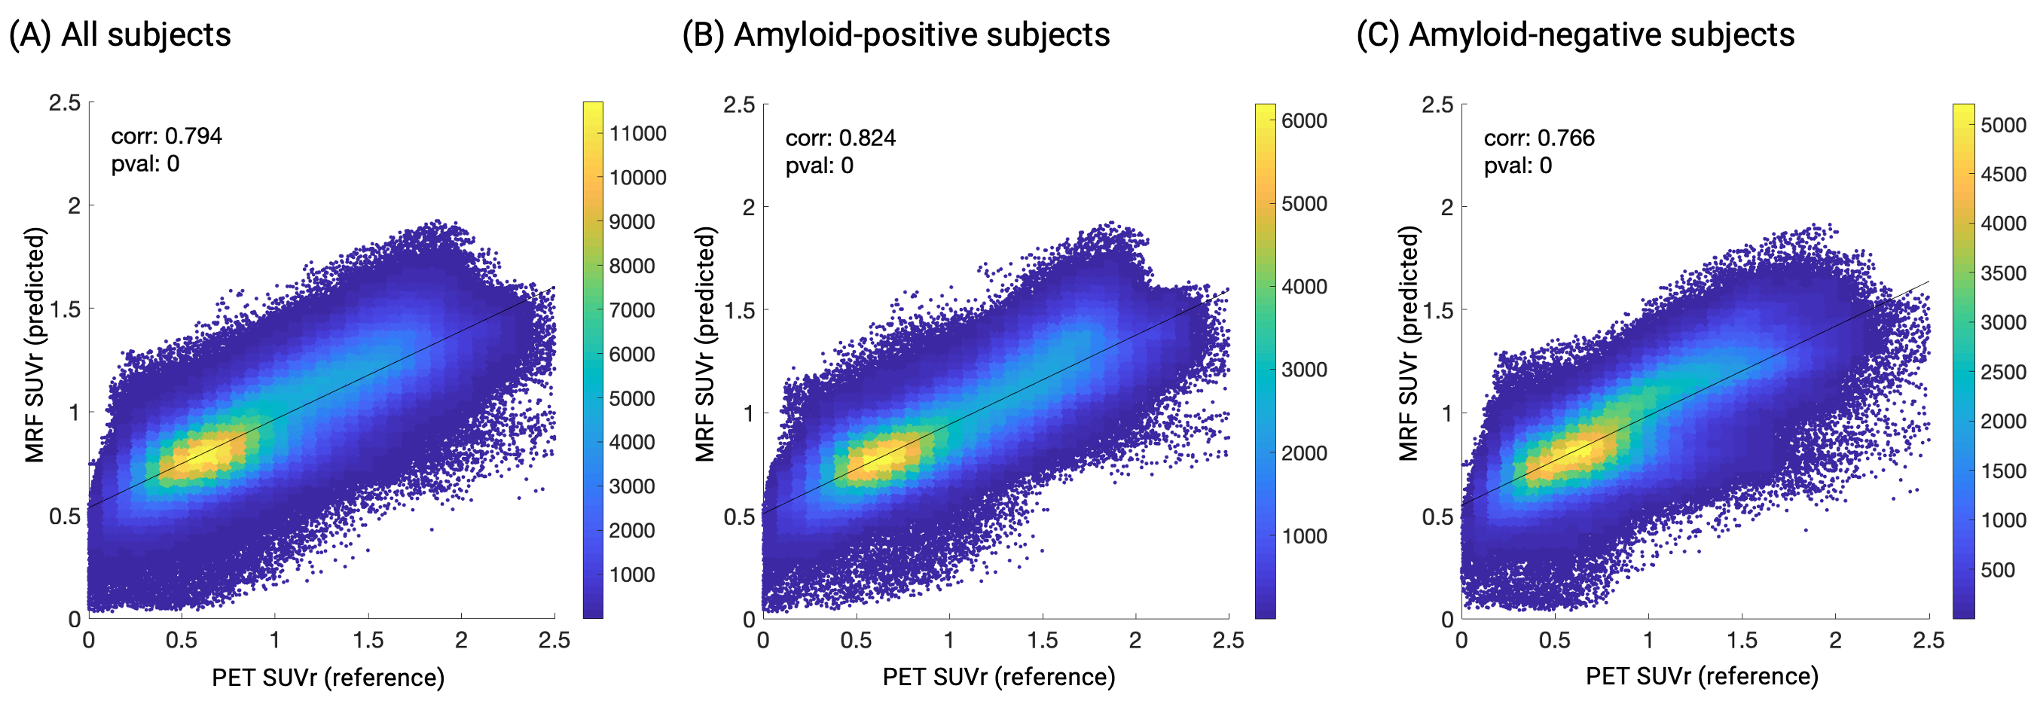
Representative outputs and a comparison of performance metrics among the models are shown in Figure 3. The outputs were visually similar to those of the acquired PET images. Both low-pass filtering in the time domain and including B1 maps improved model performance. Model 3 showed the highest performance with a subject-wise AUC of 0.87 for distinguishing amyloid-negative and amyloid-positive subjects defined by PET imaging. Representative cases are shown in Figure 4. A PET-proven amyloid positive and negative could be visually distinguished using MRF-amyloid maps. High linearity was observed (correlation coefficient of 0.79) between PET- and MRF-derived SUVr values (Figure 5).Discussion
Owing to the single-site and prospective study design, the number of subjects with both MRF and amyloid PET data was limited. A multi-center study is required to further evaluate the generalizability of the framework. The performance reported in this study was achieved using an MRF sequence,9 originally developed for T1 and T2 quantification. Higher performance may be achieved by designing tailored sequences with increased sensitivity to amyloid deposition.Conclusion
In this pilot proof-of-concept study, we developed a framework that utilizes efficient MRF data acquisition and neural network-based decoding to detect amyloid burden. The proposed framework could be useful in the stratification of patients with cognitive decline and reduce unnecessary PET scans. The non-invasive approach allows for repetitive scans to monitor brain amyloid burden longitudinally, making it suitable to monitor patients taking amyloid-reducing antibody treatment (e.g., aducanumab).Acknowledgements
We thank Keiko Tanimoto for handling the data.
References
- Jack CR Jr, Knopman DS, Jagust WJ, et al. Hypothetical model of dynamic biomarkers of the Alzheimer's pathological cascade. Lancet Neurol. 2010;9(1):119-128.
- Duygu Tosun, Detection of β-amyloid positivity in Alzheimer’s Disease Neuroimaging Initiative participants with demographics, cognition, MRI and plasma biomarkers, Brain Communications, Volume 3, Issue 2, 2021
- Anusha Rangarajan, Minjie Wu, Naomi Joseph, et al. Multimodal magnetic resonance imaging predicts regional amyloid-β burden in the brain. bioRxiv 2020.01.17.910984
- Ma D, Gulani V, Seiberlich N, et al. Magnetic resonance fingerprinting. Nature. 2013;495(7440):187-192.
- Hirose A. Complex-Valued Neural Networks: Advances and Applications. Wiley-IEEE Press; 1st edition. 2013
- Joshi AD, Pontecorvo MJ, Clark CM, et al. Performance characteristics of amyloid PET with florbetapir F 18 in patients with alzheimer's disease and cognitively normal subjects. J Nucl Med. 2012 Mar;53(3):378-84.
- Clark CM, Pontecorvo MJ, Beach TG, et al. Cerebral PET with florbetapir compared with neuropathology at autopsy for detection of neuritic amyloid-β plaques: a prospective cohort study. Lancet Neurol. 2012;11(8):669-678.
- Landau SM, Breault C, Joshi AD, et al. Amyloid-β imaging with Pittsburgh compound B and florbetapir: comparing radiotracers and quantification methods. J Nucl Med. 2013;54(1):70-77.
- Jiang Y, Ma D, Seiberlich N, Gulani V, Griswold MA. MR fingerprinting using fast imaging with steady state precession (FISP) with spiral readout. Magn Reson Med. 2015;74(6):1621-1631.
- Chung S, Kim D, Breton E, Axel L (2010) Rapid B1+ mapping using a preconditioning RF pulse with TurboFLASH readout. Magnet Reson Med 64:439-46.
- Ronneberger, Olaf; Fischer, Philipp; Brox, Thomas (2015). "U-Net: Convolutional Networks for Biomedical Image Segmentation". arXiv:1505.04597
- P. Virtue, S. X. Yu and M. Lustig, "Better than real: Complex-valued neural nets for MRI fingerprinting," 2017 IEEE International Conference on Image Processing (ICIP), 2017, pp. 3953-3957.
- Zhuang, J., Tang, T., Ding, Y., Tatikonda, S., Dvornek, N., Papademetris, X., Duncan, J."AdaBelief Optimizer: Adapting Stepsizes by the Belief in Observed Gradients", (NeurIPS'20)
Figures