0557
Simultaneous perfusion, diffusion, T2*, and T1 mapping with MR Fingerprinting (MRF-PDT)1Department of Biomedical Engineering, Johns Hopkins University School of Medicine, Baltimore, MD, United States, 2The Russell H. Morgan Department of Radiology & Radiological Science, Johns Hopkins University School of Medicine, Baltimore, MD, United States, 3Department of Neurology, Johns Hopkins University School of Medicine, Baltimore, MD, United States, 4Center for Magnetic Resonance Research and Department of Radiology, University of Illinois at Chicago, Chicago, IL, United States, 5F. M. Kirby Research Center for Functional Brain Imaging, Kennedy Krieger Institute, Baltimore, MD, United States
Synopsis
Quantitative mapping of brain perfusion, diffusion, T2*, and T1 has a broad range of clinical applications. The present work aims to develop a novel pulse sequence that can simultaneously map perfusion, diffusion, T2* and T1 with MR fingerprinting, dubbed MRF-PDT, with a total scan time of <6 minutes. This technique was first demonstrated on healthy volunteers, then on two patients with ischemic stroke. All maps derived from MRF-PDT exhibited the expected image contrasts with quantitative values consistent with those reported in literature. In addition, test-retest studies confirmed the reproducibility of the proposed technique.
INTRODUCTION
Quantitative mapping of brain perfusion, diffusion, T2*, and T1 has a broad range of clinical applications. In particular, in stroke, these parameters collectively provide a comprehensive triaging tool for diagnosis and treatment decisions. For example, T2* image allows differentiation of hemorrhagic versus ischemic stroke. Diffusion-perfusion mismatch provides an assessment of the tissue at risk, and can guide rtPA and/or thrombectomy treatments1. T1 is also useful in the evaluation of structural injury. At present, these sequences are performed separately and some may require the use of contrast agent. The present work aims to develop a novel pulse sequence that can simultaneously map perfusion (cerebral blood flow in ml/100g/min and bolus arrival time in ms), diffusion (apparent-diffusion-coefficient, ADC in mm2/s), T2*(in ms), and T1 (in ms) with MR fingerprinting, dubbed MRF-PDT, with a total scan time of <6 minutes without using contrast agent. Performance of this technique was first demonstrated on healthy volunteers, then on two ischemic stroke patients.METHODS
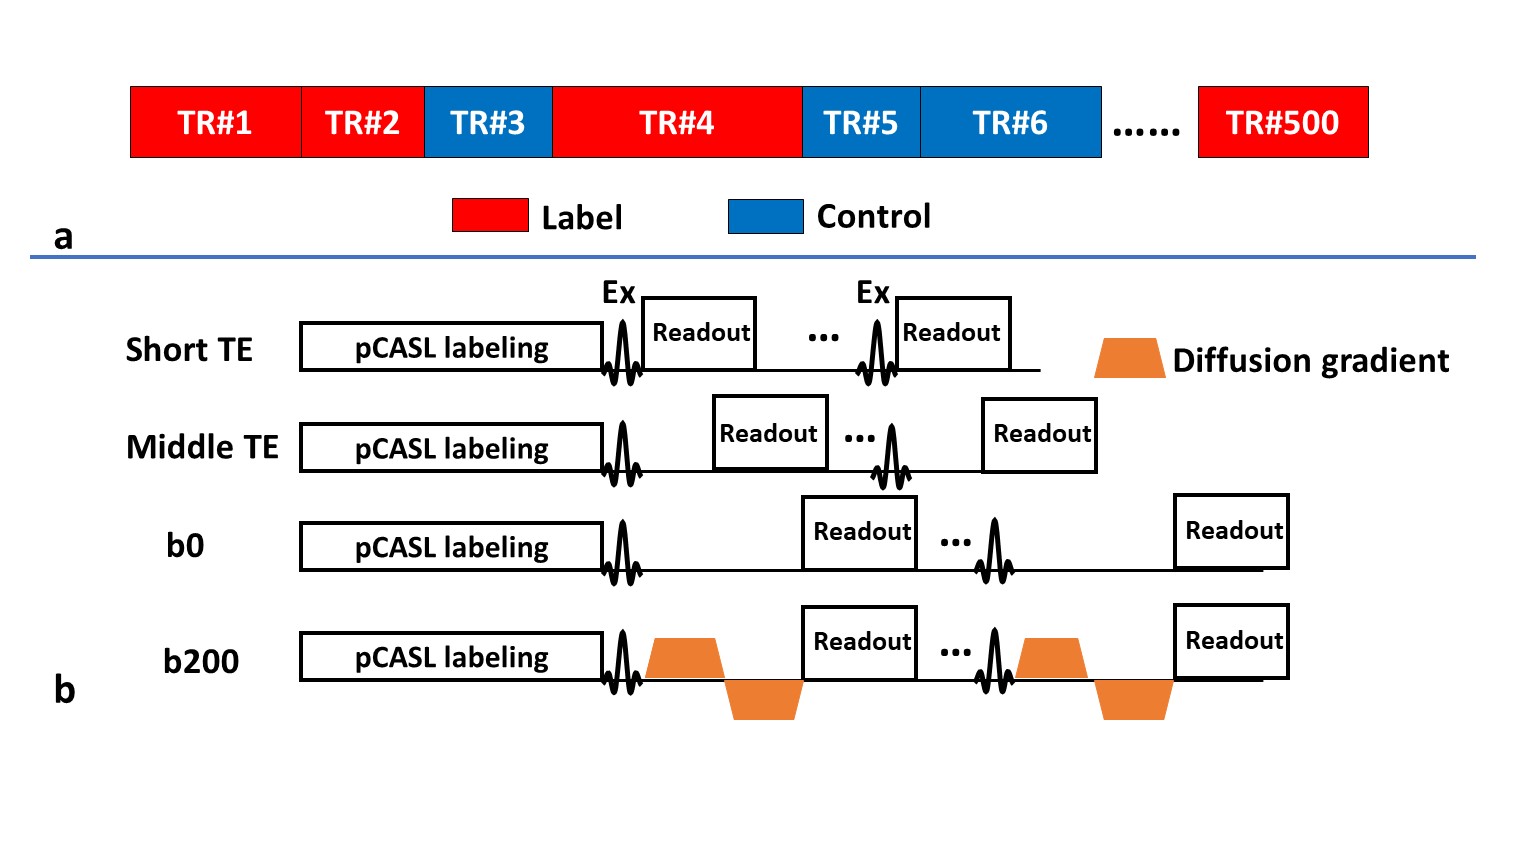
Sequence design and MR experiments:A sequence diagram of MRF-PDT is shown in Figure 1. The sequence was based on our previously reported MRF-ASL (arterial spin labeling) sequence2, but the acquisition module was modified to include different TE values and the presence/absence of bipolar diffusion gradients. Specifically, four different acquisition schemes (Figure 1b) were randomly used: 1) EPI readout without diffusion using the shortest TE possible, TE=9.8ms, labeled as “short TE” in Figure 1, 450 dynamics; 2) EPI readout without diffusion but using a moderate TE, TE=25ms, labeled as “middle TE”, 10 dynamics; 3) EPI readout without diffusion using a longer TE, TE=42.3ms, labeled as “b0”, 10 dynamics; and 4) EPI readout with bipolar diffusion gradients with a TE that matched “b0”, TE=42.3ms, labeled as “b200”, 30 dynamics (10 dynamics for each direction, i.e. x, y and z).
Two healthy subjects (26.5±2.1 years of age, 1 female) were scanned on a 3T Philips system. The imaging parameters were: matrix size=64×64×16; voxel size=2.8×2.8×4 mm3; field-of-view (FoV)=180×180×64 mm3; flip angle 40°; scan duration=5 min 45 sec; and b value=200 s/mm2. Each subject was scanned twice with reposition to examine the reproducibility of this technique.
In addition, MRF-PDT data were also collected on two subacute ischemic stroke patients to demonstrate the clinical performance of this technique. The acute MRI images acquired during a standard clinical session (without MRF-PDT) were also available for comparison.
Data processing:
MRF-PDT processing used standard dictionary matching methods.
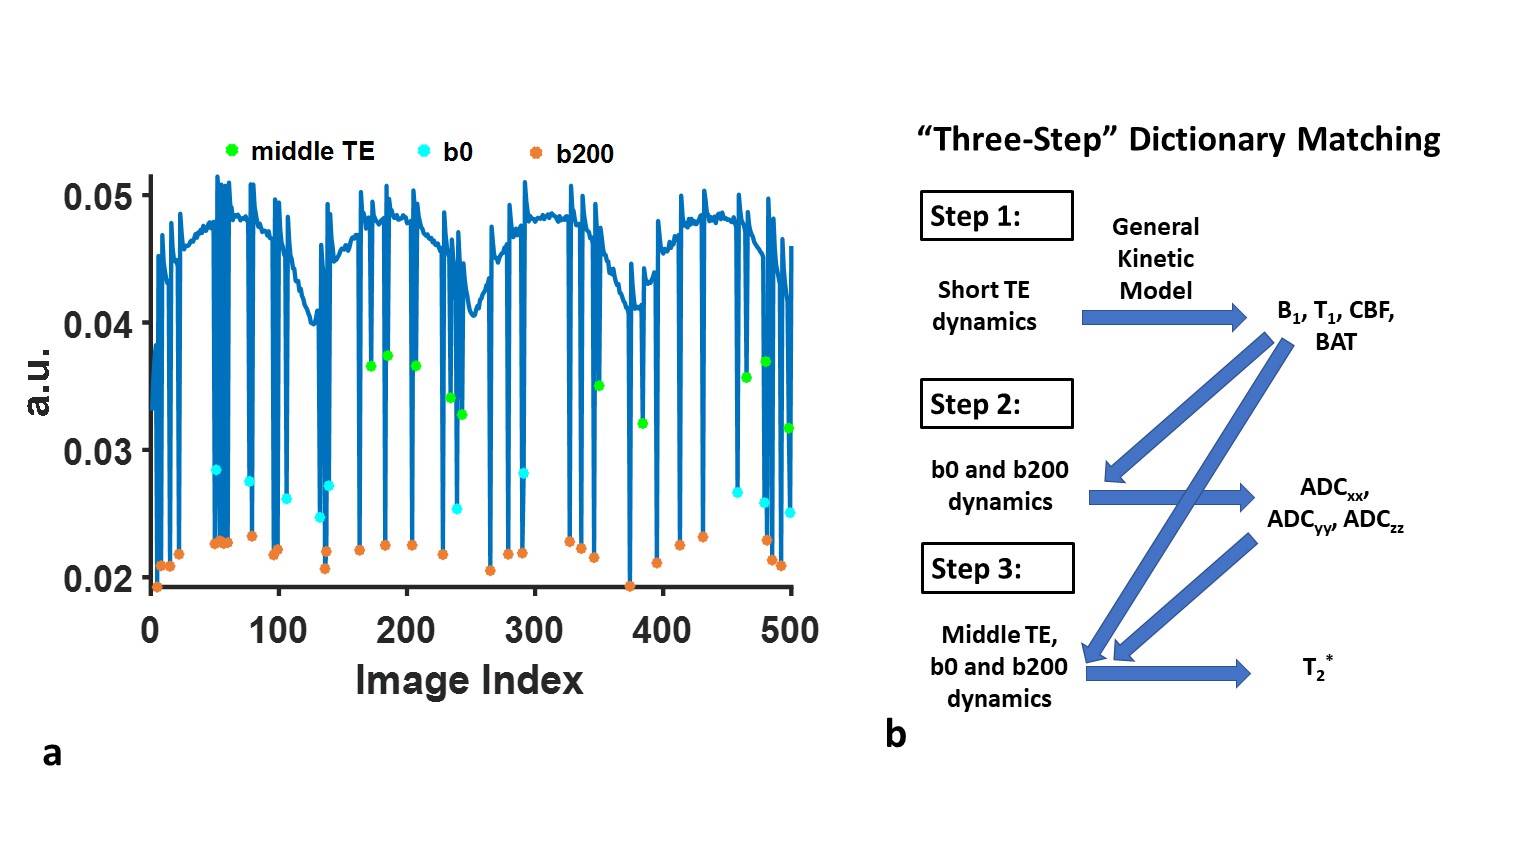
Figure 2a shows the signal evolution of a typical gray matter voxel. A “three-step” dictionary matching processing was used given the large number of parameters (8 in total), as shown in Figure 2b. In the first step, “middle TE”, b0, and b200 were excluded. The remaining “short TE” dynamics were used to estimate parameters, i.e. T1, B1+, CBF and BAT. In the second step, b200 dynamics with b0 were used to estimate ADC in x (ADCxx), y (ADCyy) and z (ADCzz) directions, with T1, B1+, CBF and BAT fixed at the values obtained in Step 1. ADCtrace was obtained by averaging values across the three directions. Finally, in Step 3, T2* was calculated based on “middle TE”, b0 and b200 dynamics, with the other parameters fixed at values obtained in the previous steps.
DWI images of stroke patients at acute stage were co-registered to the MRF-PDT space while preserving in-plane resolution. To quantify MRF-PDT parameters in different brain regions, regions-of-interest (ROIs) of ischemic lesion and contralateral normal tissues were manually delineated based on co-registered DWI images.
RESULTS AND DISCUSSION
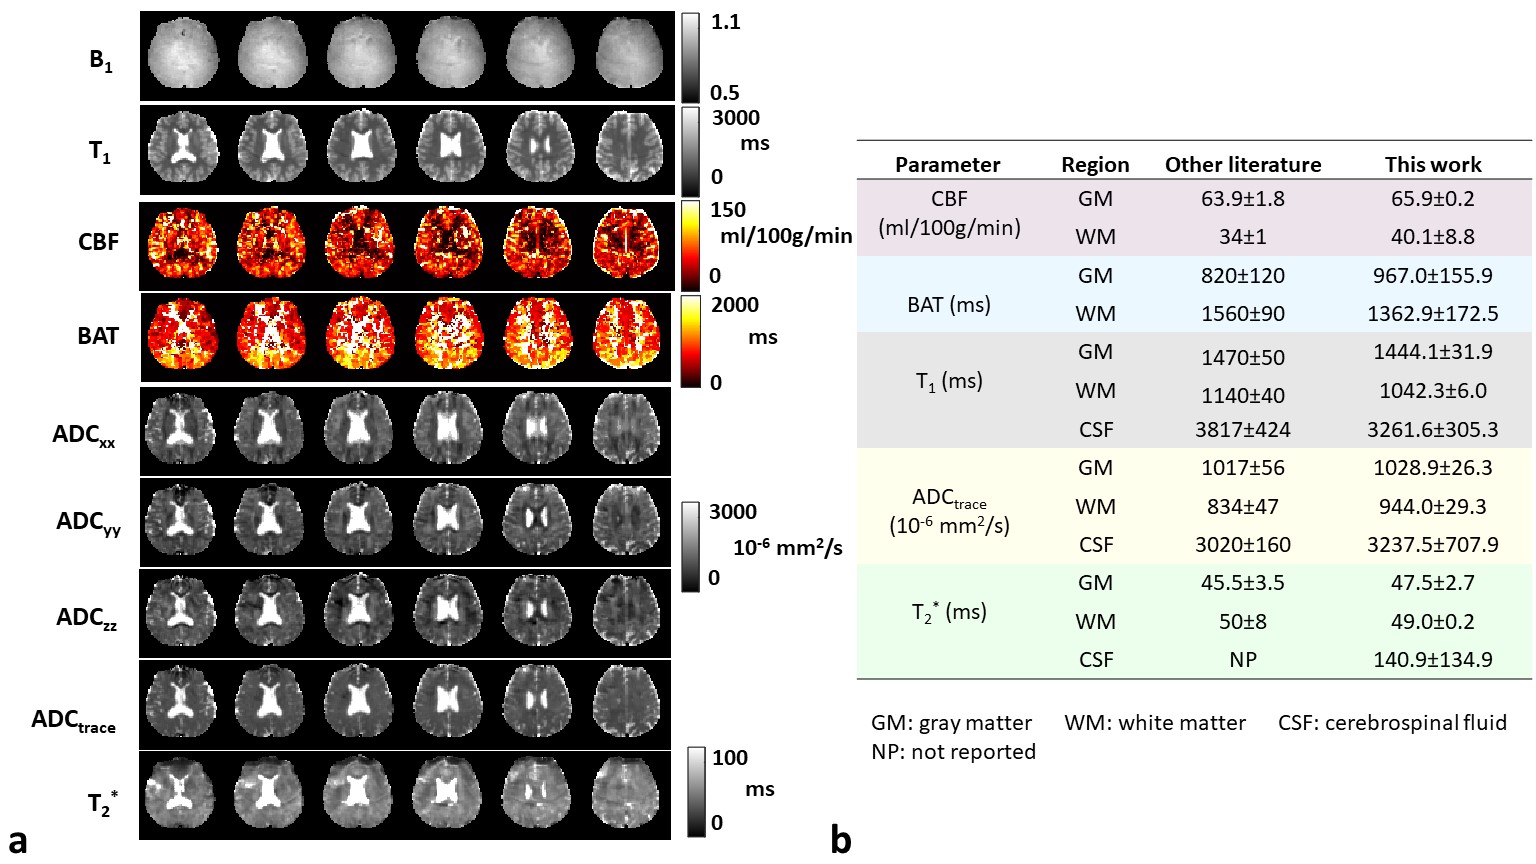
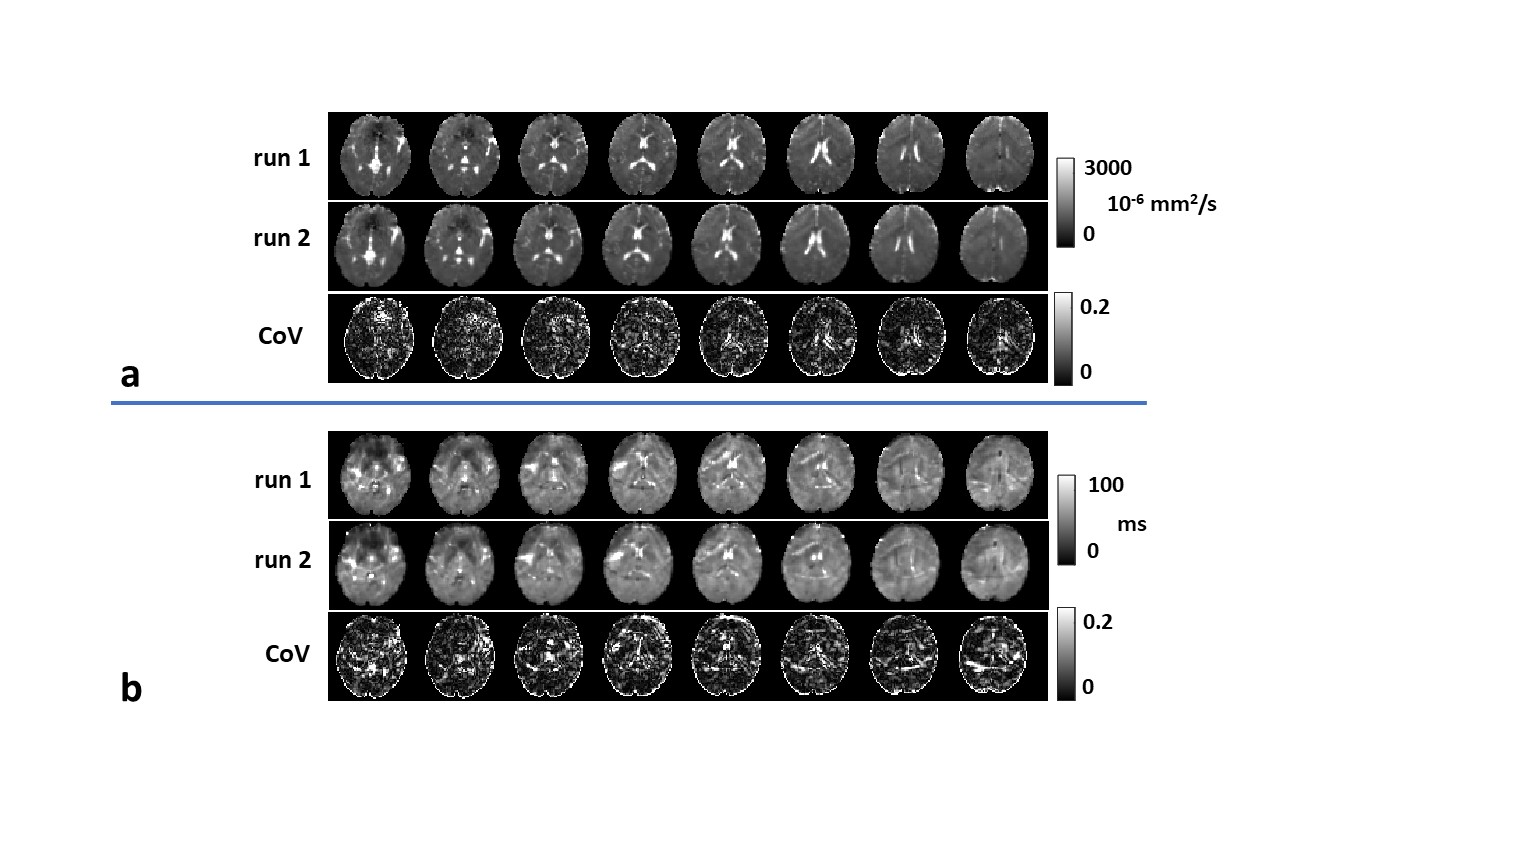
MRF-PDT parametric maps of one healthy volunteer are shown in Figure 3a. All maps exhibited expected image contrast. Figure 3b compares MRF-PDT parameters to those reported in the literature using non-MRF methods3-13. The values obtained in this study are generally in agreement with those in previous studies.Figure 4 shows the reproducibility of ADCtrace (Figure 4a) and T2* (Figure 4b) from one healthy subject. Corresponding coefficient-of-variation (CoV) maps are also shown. Whole-FOV average value was 0.08±0.02 for ADCtrace and 0.10±0.03 for T2*. The measurements of diffusion and T2* were found reproducible.
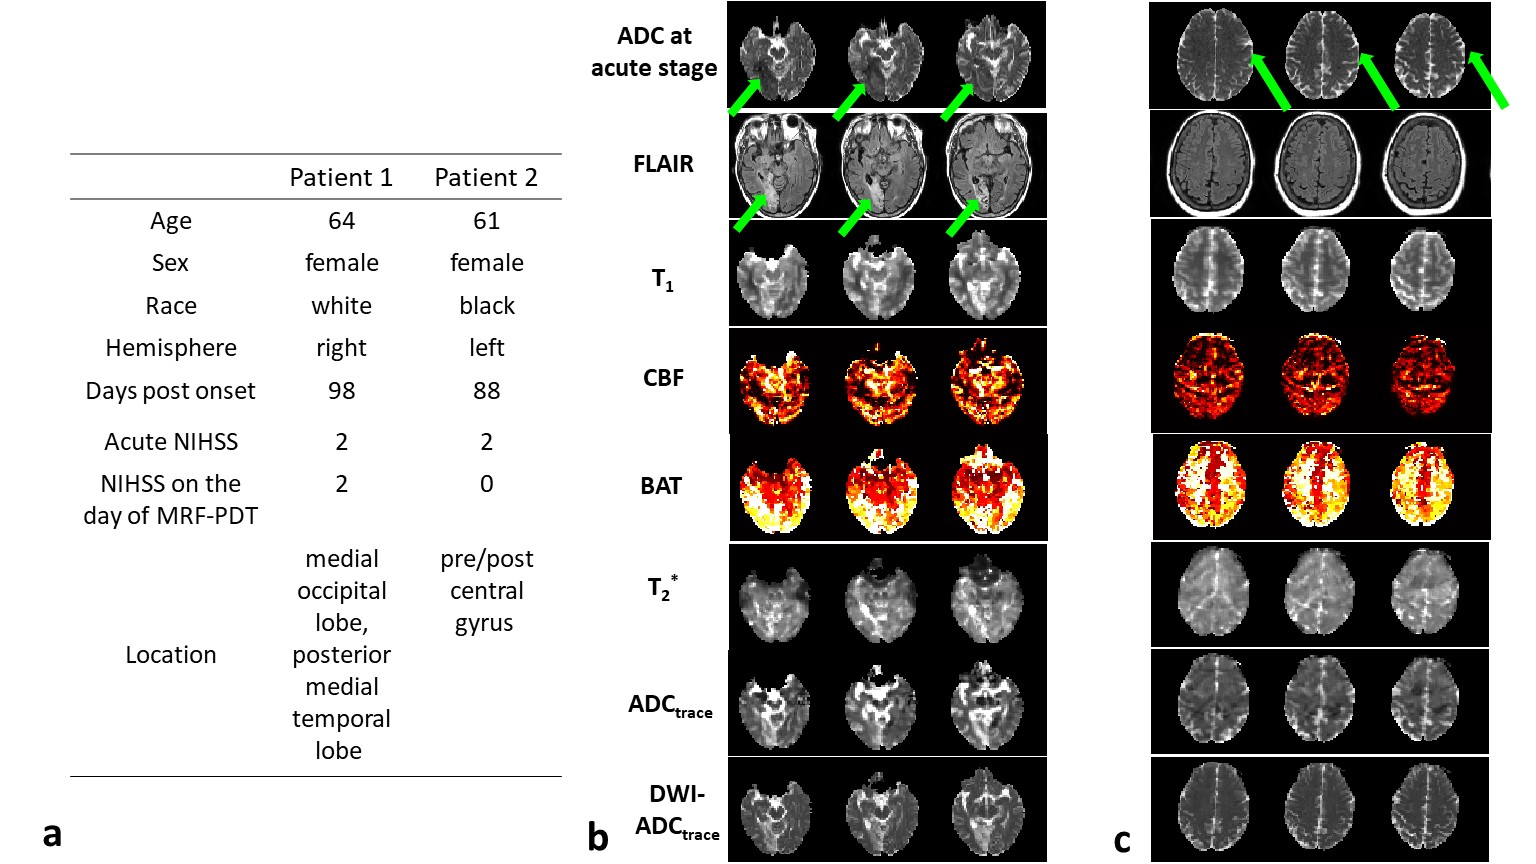
Figure 5a shows the demographic and clinical information of the stroke patients. Patient 1 has an infarct in the right medial occipital lobe, as depicted in FLAIR (indicated by green arrows in Figure 5b). Accordingly, on the MRF-PDT parametric maps, longer T1, lower CBF, longer BAT, greater ADCtrace and longer T2* were observed in this region compared with the contralateral normal region. Quantitative parametric values in the lesion ROI vs. normal ROI were as follows: 1959.3 vs. 1572.5 ms for T1; 57.2 vs. 63.8 ml/100g/min for CBF; 1844.6 vs. 1391.6 ms for BAT; 1888.4 vs. 1437.2 10-6 mm2/s for ADCtrace; 71.1 vs. 54.9 ms for T2*. Furthermore, MRF-PDT derived ADCtrace map was similar to that obtained from spin-echo DWI (DWI-ADCtrace, bottom row in Figure 5b).
Parametric maps of patient 2 are shown in Figure 5c. This patient recovered fully with no abnormality observed in FLAIR and MRF-PDT parametric maps.
CONCLUSION
The proposed MRF-PDT technique has the potential to simultaneously estimate perfusion (i.e. CBF and BAT), diffusion, T2* and T1 parameters in a single scan within 6 minutes.Acknowledgements
No acknowledgement found.References
1. Demchuk AM, Hill MD, Barber PA, Silver B, Patel SC, Levine SR, Grp NrSS. Importance of early ischemic computed tomography changes using ASPECTS in NINDS rtPA stroke study. Stroke 2005;36:2110-2115.
2. Su P, Fan H, Liu P et al. MR fingerprinting ASL: Sequence characterization and comparison with dynamic susceptibility contrast (DSC) MRI. NMR Biomed 2019. doi: 10.1002/nbm.4202:e4202.
3. Wu WC, Lin SC, Wang DJ, Chen KL, Li YD. Measurement of Cerebral White Matter Perfusion Using Pseudocontinuous Arterial Spin Labeling 3T Magnetic Resonance Imaging - an Experimental and Theoretical Investigation of Feasibility. Plos One 2013;8.
4. Dai WY, Robson PM, Shankaranarayanan A, Alsop DC. Reduced resolution transit delay prescan for quantitative continuous arterial spin labeling perfusion imaging. Magnet Reson Med 2012;67:1252-1265.
5. Petersen ET, Lim T, Golay X. Model-free arterial spin labeling quantification approach for perfusion MRI. Magnet Reson Med 2006;55:219-232.
6. Petersen ET, Mouridsen K, Golay X, Study QT-r. The QUASAR reproducibility study, Part II: Results from a multi-center Arterial Spin Labeling test-retest study. Neuroimage 2010;49:104-113.
7.Ethofer T, Mader I, Seeger U, Helms G, Erb M, Grodd W, Ludolph A, Klose U. Comparison of longitudinal metabolite relaxation times in different regions of the human brain at 1.5 and 3 Tesla. Magnet Reson Med 2003;50:1296-1301.
8. Lu HZ, Nagae-Poetscher LM, Golay X, Lin D, Pomper M, van Zijl PCM. Routine clinical brain MRI sequences for use at 3.0 Tesla. Journal of Magnetic Resonance Imaging 2005;22:13-22.
9.Ray KM, Wang HL, Chu Y, Chen YF, Bert A, Hasso AN, Su MY. Mild cognitive impairment: Apparent diffusion coefficient in regional gray matter and white matter structures. Radiology 2006;241:197-205.
10. Tao AT, Shu YH, Tan ET, Trzasko JD, Tao SZ, Reid RD, Weavers PT, Huston J, Bernstein MA. Improving apparent diffusion coefficient accuracy on a compact 3T MRI scanner using gradient nonlinearity correction. Journal of Magnetic Resonance Imaging 2018;48:1498-1507.
11. Peters AM, Brookes MJ, Hoogenraad FG, Gowland PA, Francis ST, Morris PG, Bowtell R. T-2* measurements in human brain at 1.5, 3 and 7 T. Magnetic Resonance Imaging 2007;25:748-753.
12. Li TQ, Yao B, van Gelderen P, Merkle H, Dodd S, Talagala L, Koretsky AP, Duyn J. Characterization of T(2)(star) Heterogeneity in Human Brain White Matter. Magnet Reson Med 2009;62:1652-1657.
13. Lu HZ, van Zijl PCM. Experimental measurement of extravascular parenchymal BOLD effects and tissue oxygen extraction fractions using multi-echo VASO fMRI at 1.5 and 3.0 T. Magnet Reson Med 2005;53:808-816.
Figures