0554
An End-to-End Segmentation Pipeline for Dixon Adipose and Muscle by Neural Nets (DAMNN)1Regeneron Pharmaceuticals, Inc, Tarrytown, NY, United States
Synopsis
An end-to-end pipeline was developed that processes whole-body Dixon MRI data sets from UK Biobank and corrects for overlapping slices, inhomogeneous signal intensities, and fat-water swaps to produce high quality 3D data sets. Segmentation maps for subcutaneous/visceral fat and left/right thigh muscles from these 3D data sets were then produced using neural networks, and muscle and fat volume phenotypes were extracted. The Jaccard index for the validation data sets was 93.3% for the fat segmentation and 96.9% for the muscle segmentation. Excellent correspondence was obtained with the extracted muscle and fat volumes and similar metrics from a commercially available package.
Introduction
The UK Biobank1,2 is an open access resource of extensive phenotypic and genetic data of 500,000 individuals. Multi-modal imaging is planned in 100,000 of the participants, including whole-body (neck to knee) two-point Dixon3 MRI. Currently, there are 46,000 whole-body Dixon datasets available (sequence parameters found here4). Due to the UK Biobank’s size and comprehensiveness, it offers a unique opportunity to investigate genetic disorders5. However, its size also necessitates the use of reliable automated methods to extract phenotypes from the imaging data. Here we developed an end-to-end pipeline that takes in the raw DICOM files from the UK Biobank (or a similar imaging protocol) and outputs three-dimensional water and fat images, segmentation maps and various muscle and fat phenotypes.Methods
A flow diagram describing the algorithm is given in Figure 1. Due to potential fat-water swaps6, a deep convolutional neural network (DCNN) was used to classify whether an image originated from fat or water signal. This model was a ResNet507 trained on 41,864 fat/water pair images from 95 subjects. Two separate models were used to segment fat and muscle from the whole-body data. These models used UNet8 with ResNet347 backbones, and a loss function of a sum of the Jaccard Index and categorical focal loss9. The total Jaccard index was obtained by taking the mean over all classes. The fat and water images contain complementary information; hence both were used for input to the two segmentation models. The segmentation models were trained on the three orthogonal dimensions of the 3-dimensional data set (i.e., the 3D data was re-sliced and fed into the model as a set of axial, coronal and sagittal images). The fat model segments the full 3D volume into background, subcutaneous and visceral fat, while the muscle model segments the volume into background, left thigh muscle and right thigh muscle. From these segmentation maps phenotypes such as fat/muscle volumes, as well as thigh muscle length and perimeter were measured. The training data was annotated manually in VivoQuant (Invicro, New Haven, CT). For inference, three intermediate segmentations were obtained by feeding in the 3-dimensional data as axial, coronal and sagittal images, and the final 3D segmentation was obtained by taking the mode over the three intermediate segmentations. A total of 52/45 subjects were used to train the fat/muscle DCNN, respectively (42,355/36,857 slices in each of the three orthogonal orientations). All DCNNs were trained using rotation and translation data augmentation10 to improve model generalizability. Special care was taken to tailor the training dataset to attempt to span the phenotypic diversity expected by specifically including training subjects that have genetic mutations that predispose them to abnormal fat and muscle phenotypes such as PPARG11, PLIN112, LMNA13, LIPE14 and MC4R15.One subject for each model was held out for validation. For further validation, a subset of results were compared to similar values from a previously published method16 available via the UK Biobank for 8,522 subjects. Additionally, extracted left and right leg muscle phenotypes for all 46,000 subjects were compared to one another.
Results and Discussion
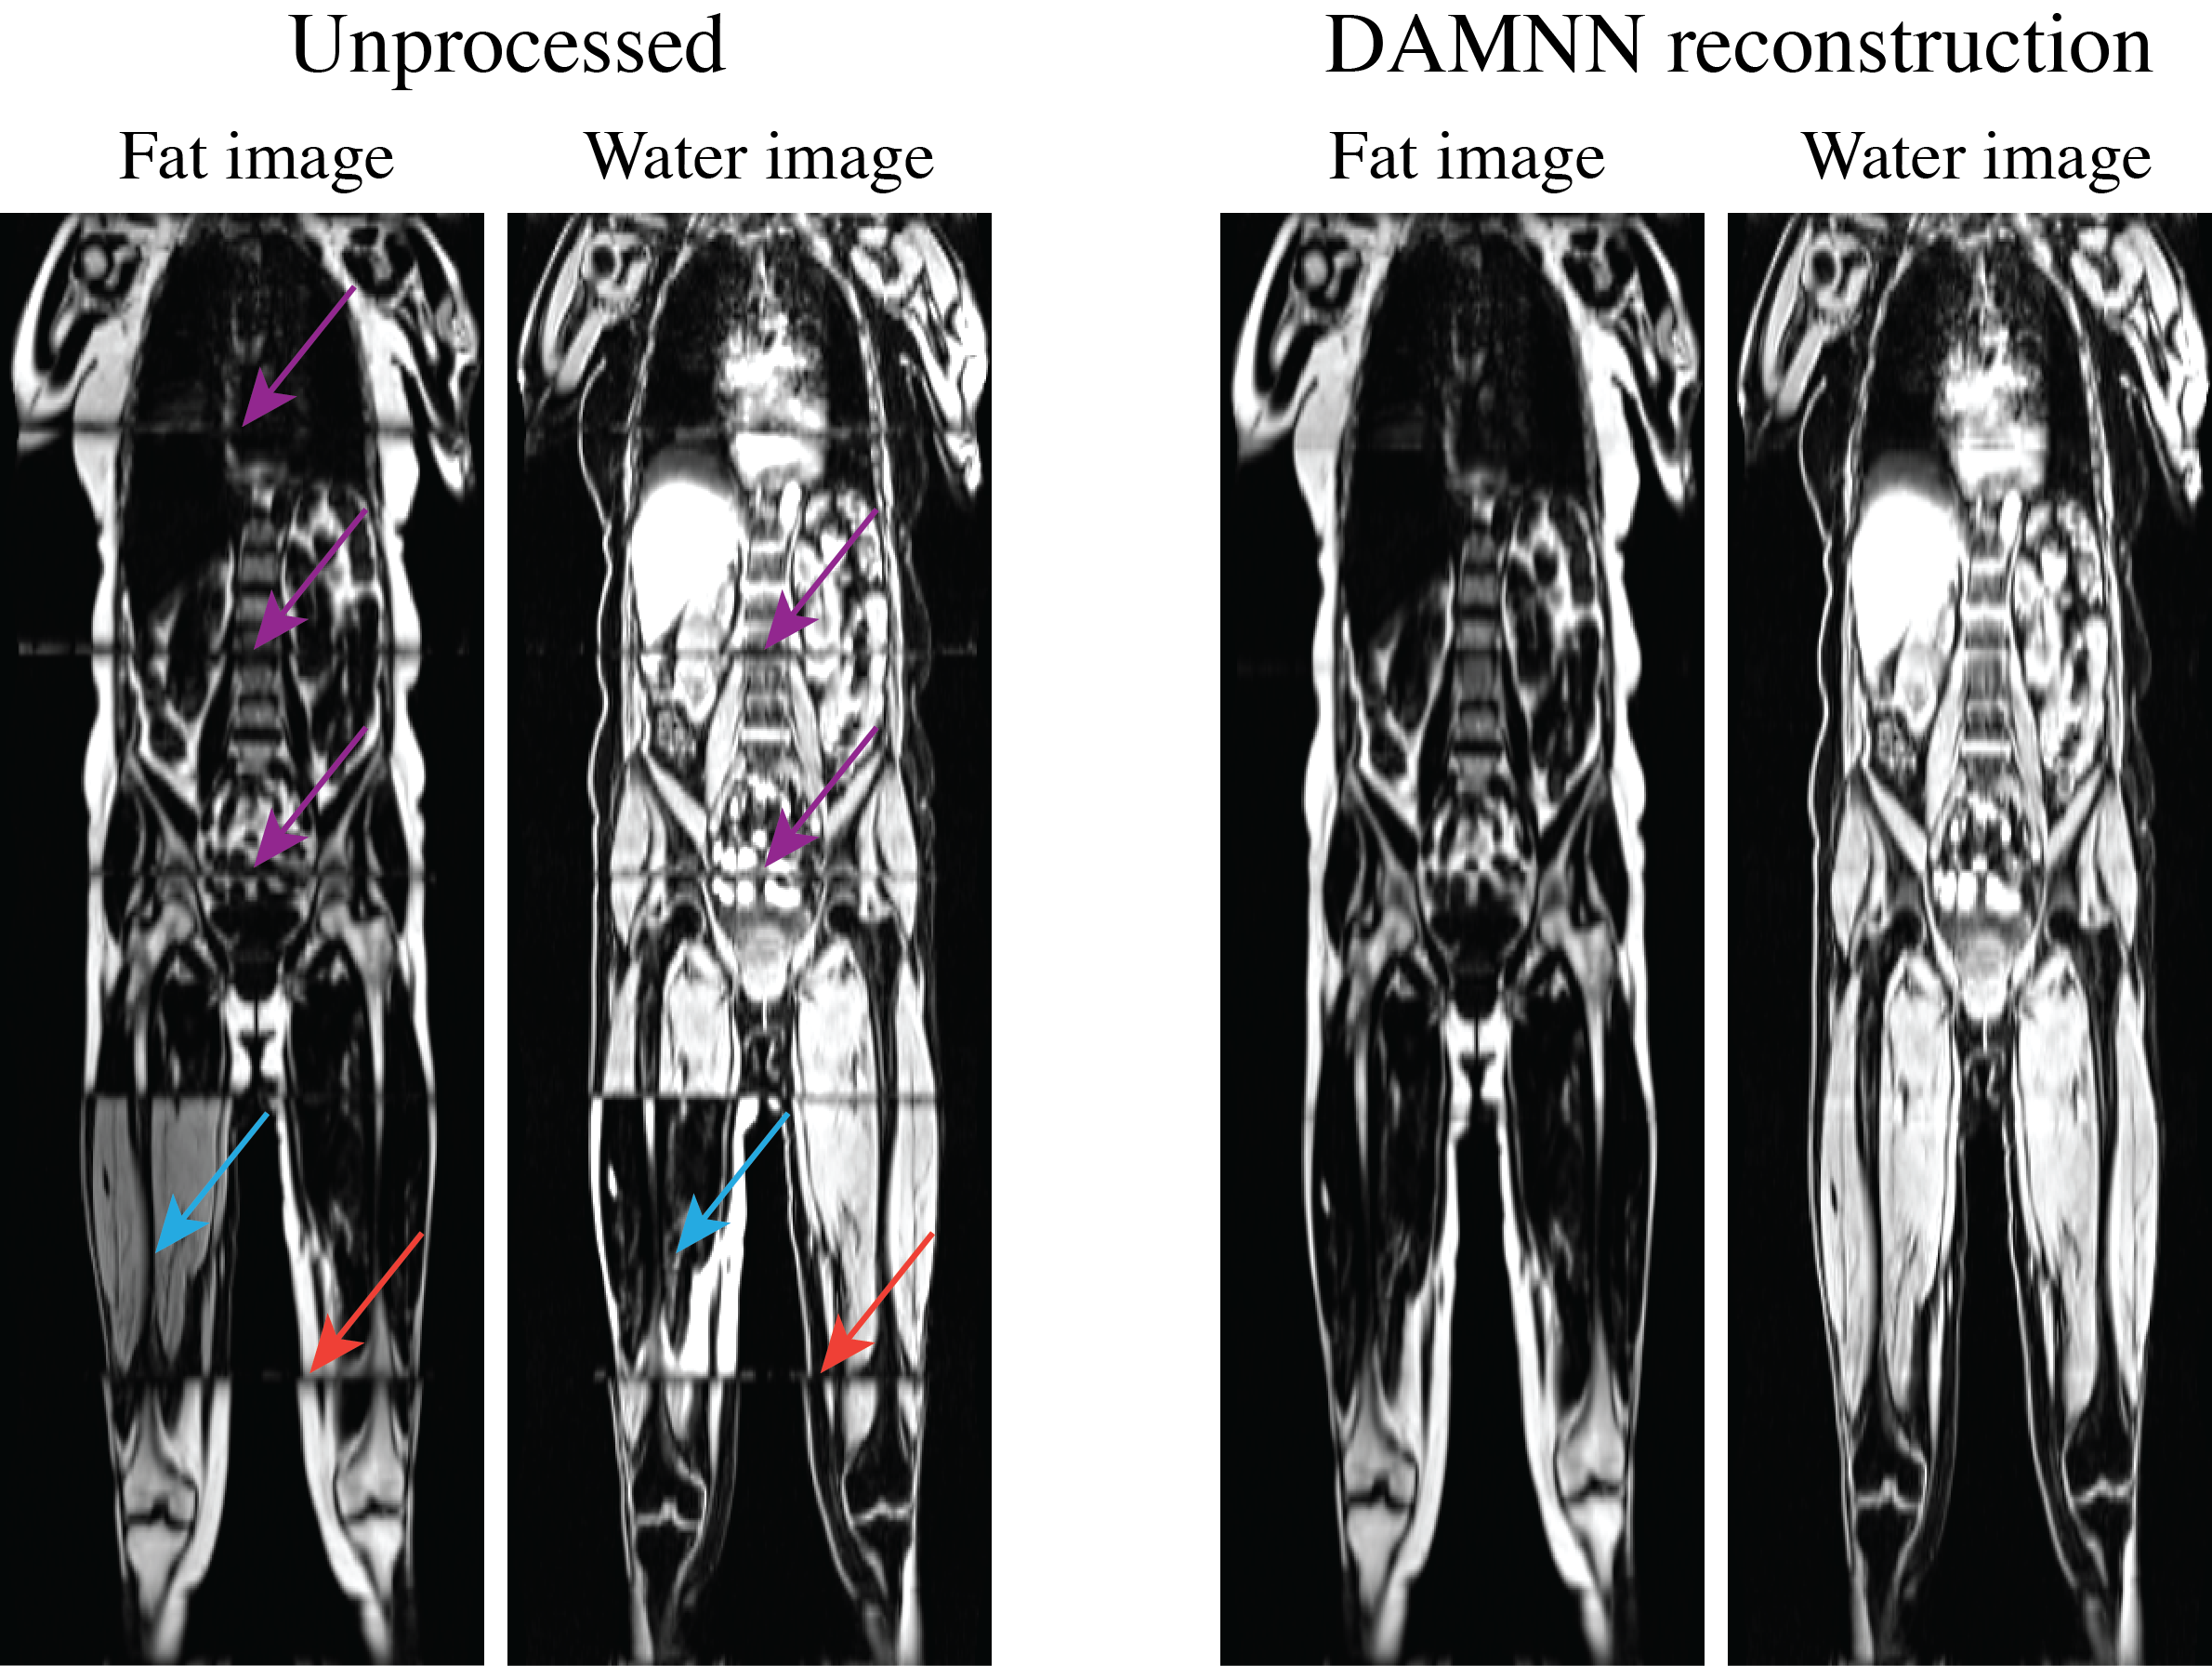
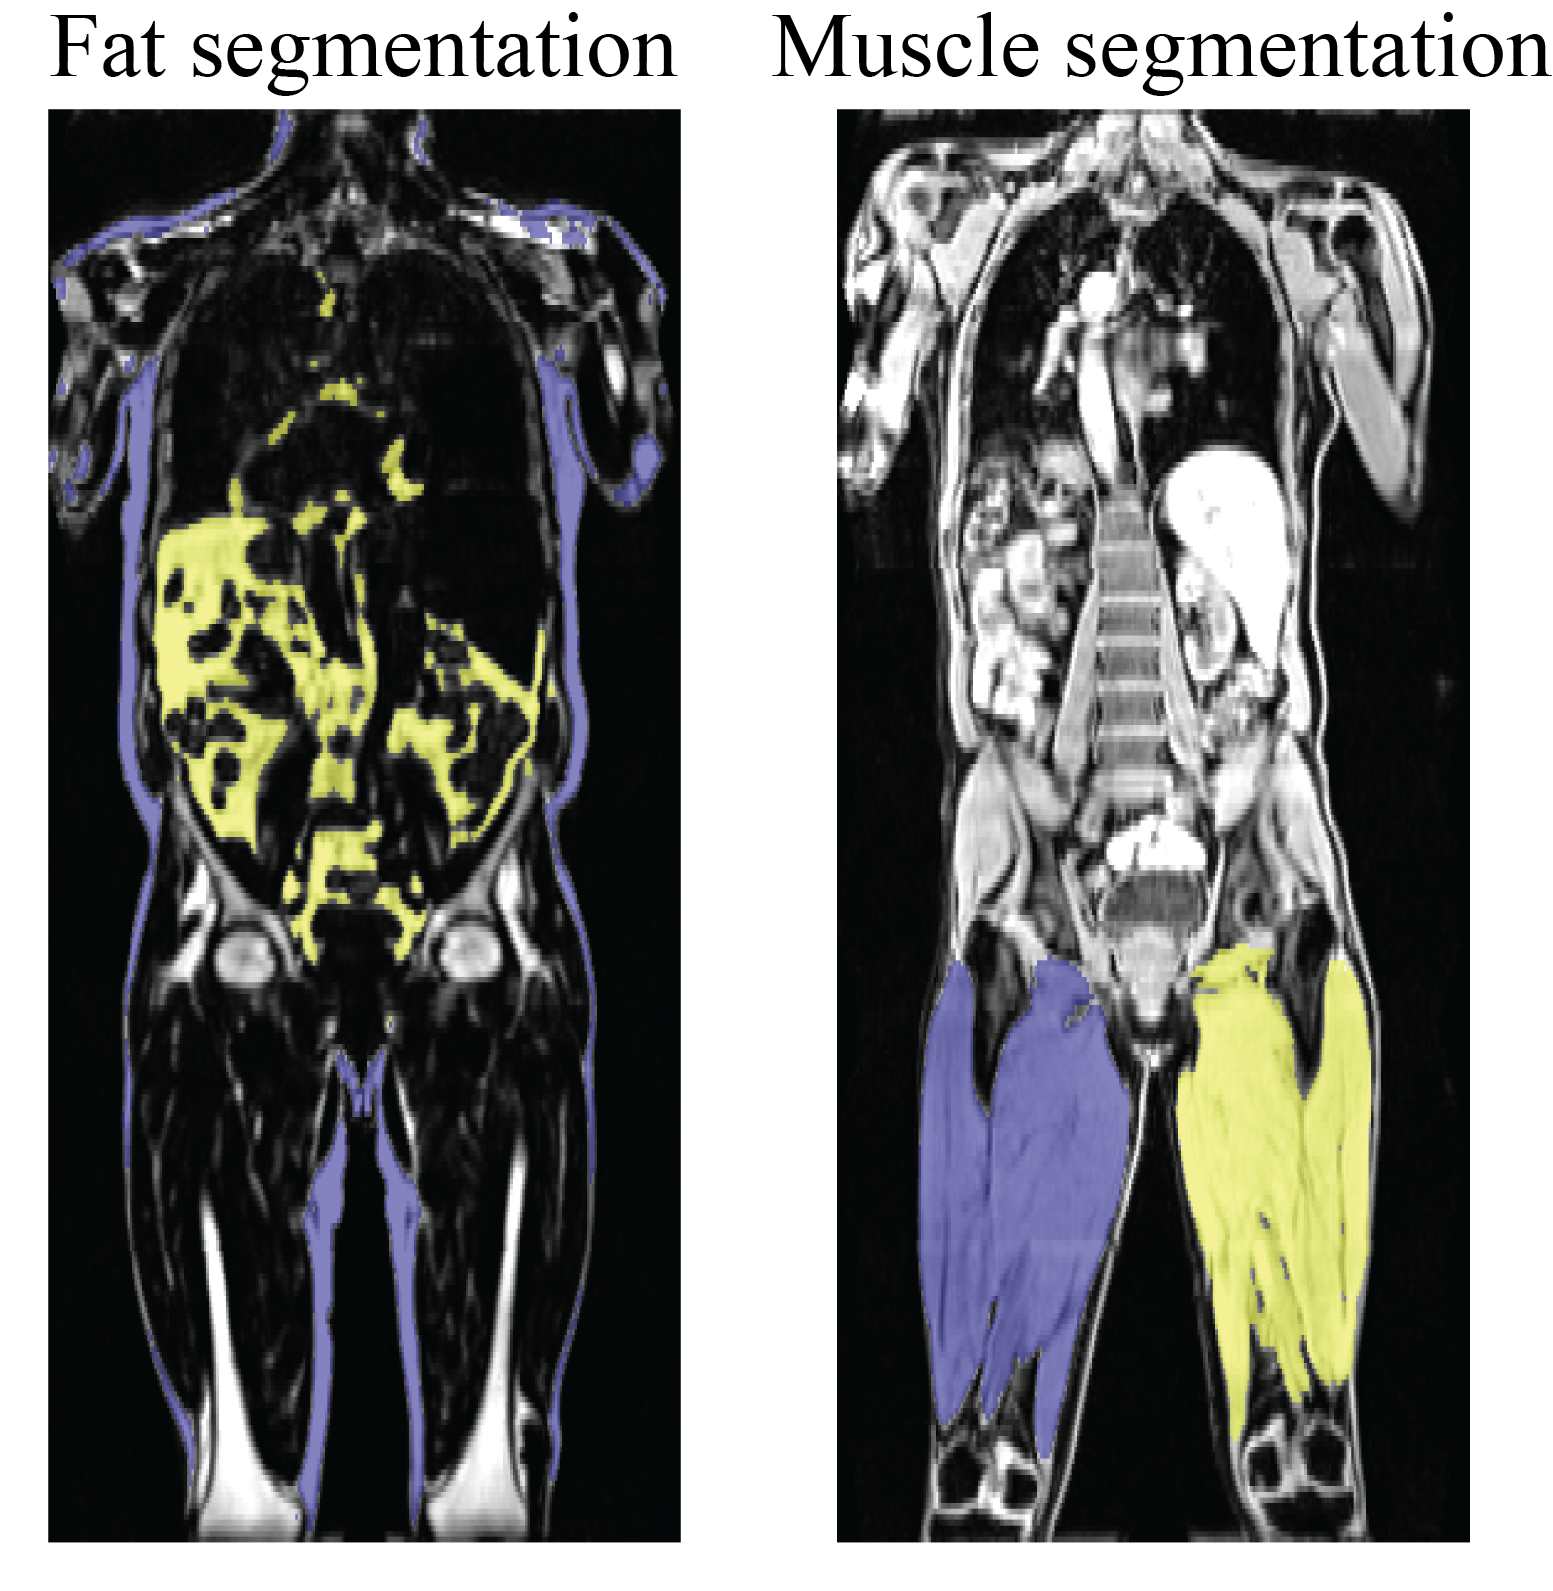
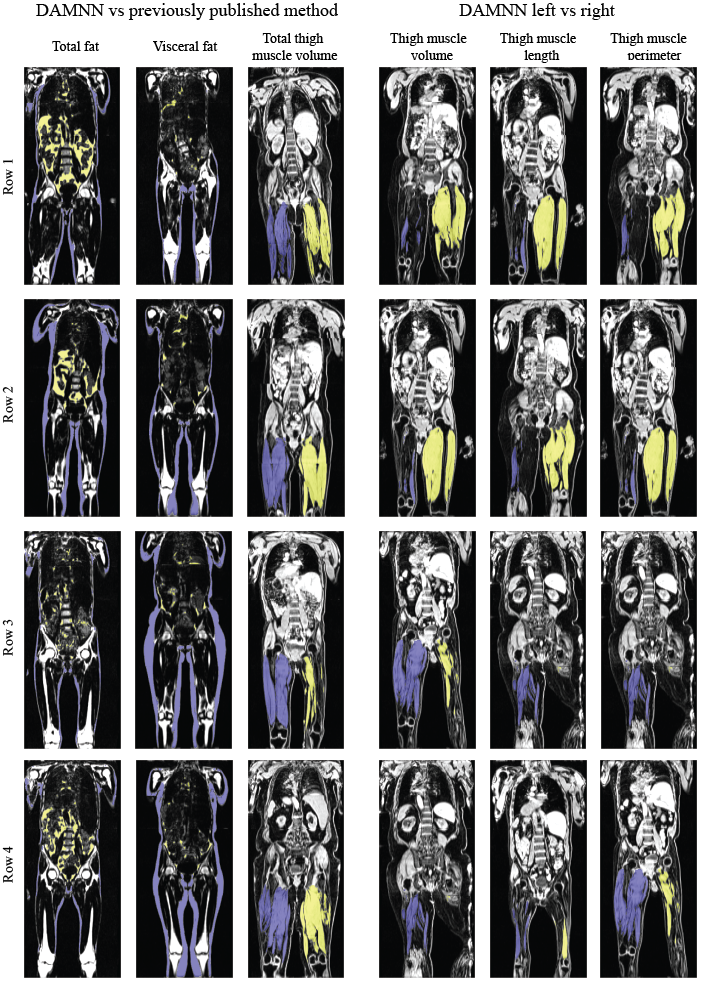
The DCNN used to classify whether an image originated from fat or water correctly identified all 3,744 test images (1,872 fat and 1,872 water) from 5 testing subjects. A sample 3D data set without any corrections versus the DAMNN stitching algorithm is shown in Figure 2. The Jaccard index for the validation data sets was 93.3% for the fat segmentation and 96.9% for the muscle segmentation (Figure 3). Excellent correspondence between the DAMNN values and similar metrics from a previously published16 method was observed, with R2 ranging from 0.97 to 0.99 (Figure 4 A-C). High correlations between left and right leg phenotypes were observed with R2 ranging from 0.87 to 0.96 (Figure 4 D-F). For Figure 4 A-C 8,522 subjects were compared as values from the existing method16 were available for only a subset of subjects, whereas Figure 4 D-F used all 46,000 available subjects. There was a high correlation between the muscle volumes from the previously published method16 and DAMNN, but due to a difference in the thigh muscle definitions there was a consistent deviation (Figure 4). Specifically, DAMNN thigh muscle consists of the hamstring, quadriceps, sartorius and medial thigh muscles, whereas also included tensor fascia latae, gluteus muscles and iliacus. A handful of large deviations between the compared metrics in Figure 4 can be observed, however upon inspection of the subjects with largest deviations (Figure 5), high quality segmentations from DAMNN were observed. Thus, differences with the previously existing method16 may be explained by differences in how the stitching of the imaging series was performed, the choice of the threshold for a pixel being classified, or a difference in anatomical definitions. In the case of the comparison between the left and right muscle phenotypes from DAMNN, which are expected to be approximately equal on average, the large deviations observed were not due to poor segmentations but rather due to an atrophy of one leg or one leg missing from the imaging volume (Figure 5).Conclusions
An end-to-end pipeline was developed which converts whole-body Dixon MRI data sets into high-quality segmentation maps for subcutaneous/visceral fat and left/right thigh muscles.Acknowledgements
No acknowledgement found.References
1. Sudlow, C. et al. UK Biobank: An Open Access Resource for Identifying the Causes of a Wide Range of Complex Diseases of Middle and Old Age. PLoS Med. 12, 1–10 (2015).
2. Littlejohns, T. J. et al. The UK Biobank imaging enhancement of 100,000 participants: rationale, data collection, management and future directions. Nat. Commun. 11, 1–12 (2020).
3. Dixon, W. T. Simple proton spectroscopic imaging. Radiology 153, 189–194 (1984).
4. Basty, N. et al. Image Processing and Quality Control for Abdominal Magnetic Resonance Imaging in the UK Biobank. arXiv 2007.01251 (2020).
5. Agrawal, S. et al. Association of machine learning-derived measures of body fat distribution in >40,000 individuals with cardiometabolic diseases. medRxiv 2021.05.07.21256854 (2021).
6. Kirchgesner, T., Acid, S., Perlepe, V., Lecouvet, F. & Vande Berg, B. Two-point Dixon fat-water swapping artifact: lesion mimicker at musculoskeletal T2-weighted MRI. Skeletal Radiol. 49, 2081–2086 (2020).
7. He, K., Zhang, X., Ren, S. & Sun, J. Deep residual learning for image recognition. arXiv 1512.03385 (2015) doi:10.1109/CVPR.2016.90.
8. Weng, W. & Zhu, X. UNet: Convolutional Networks for Biomedical Image Segmentation. arXiv 1505.04597 (2015) doi:10.1109/ACCESS.2021.3053408.
9. Lin, T. Y., Goyal, P., Girshick, R., He, K. & Dollar, P. Focal Loss for Dense Object Detection. arXiv 1708.02002v2 (2018) doi:10.1109/TPAMI.2018.2858826.
10. Shorten, C. & Khoshgoftaar, T. M. A survey on Image Data Augmentation for Deep Learning. J. Big Data 6, (2019).
11. Lüdtke, A., Buettner, J., Schmidt, H. H. J. & Worman, H. J. New PPARG mutation leads to lipodystrophy and loss of protein function that is partially restored by a synthetic ligand. J. Med. Genet. 44, 1–5 (2007).
12. Gandotra, S. et al. Perilipin Deficiency and Autosomal Dominant Partial Lipodystrophy. N. Engl. J. Med. 364, 740–748 (2011).
13. Jeru, I., Vatier, C., Vantyghem, M. C., Lascols, O. & Vigouroux, C. LMNA-associated partial lipodystrophy: Anticipation of metabolic complications. J. Med. Genet. 54, 413–416 (2017).
14. Zolotov, S. et al. Homozygous LIPE mutation in siblings with multiple symmetric lipomatosis, partial lipodystrophy, and myopathy. Am. J. Med. Genet. Part A 173, 190–194 (2017).
15. Loos, R. J. F. et al. Common variants near MC4R are associated with fat mass, weight and risk of obesity. Nat. Genet. 40, 768–775 (2008).
16. Karlsson, A. et al. Automatic and quantitative assessment of regional muscle volume by multi-atlas segmentation using whole-body water-fat MRI. J. Magn. Reson. Imaging 41, 1558–1569 (2015).
Figures