0553
Automated Adipose Tissue Segmentation using 3D Attention-Based Competitive Dense Networks and Volumetric Multi-Contrast MRI1Radiological Sciences, University of California, Los Angeles, Los Angeles, CA, United States, 2Bioengineering, University of California, Los Angeles, Los Angeles, CA, United States, 3Radiology, Loma Linda University Medical Center, Loma Linda, CA, United States, 4Psychology, Loma Linda University School of Mental Health, Loma Linda, CA, United States, 5Medicine, University of California, Los Angeles, Los Angeles, CA, United States
Synopsis
Subcutaneous and visceral adipose tissue (SAT/VAT) are potential biomarkers to detect future risks of metabolic diseases. However, the current standard for analysis relies on manual annotations that require expert knowledge and are time-consuming. Previous neural networks for automatically segmenting adipose tissue had suboptimal performance for VAT. This work developed a new 3D attention-based competitive dense network to rapidly (84 ms/slice) and accurately segment SAT/VAT in adults with obesity by leveraging multi-contrast MRI inputs and considering the complex VAT features. The new network achieved high Dice scores (>0.96) and accurate volume measurements (difference<1.6%) for SAT/VAT with respect to manual annotations.
Introduction
The increased volume and fat content of subcutaneous and visceral adipose tissue (SAT, VAT) have strong associations with metabolic diseases 1, 2. The reference standard to analyze SAT/VAT is manual annotations, which are time-consuming and may have inter-reader variability 2-4. VAT is especially challenging due to its spatially varying complex nature. Previous deep learning methods for automated SAT/VAT segmentation used 2D slices or 3D patches as inputs and yielded suboptimal VAT segmentation performance 5-7. These inputs were also limited to only T1-weighted in-phase and out-of-phase echoes (TEIP, TEOP) 5, or only fat (F) and water (W) images 6.Recent work 8 proposed two 3-dimensional (3D) neural networks using full-volume multi-contrast inputs (TEOP+W+F) to overcome the challenges associated with VAT: (1) 3D U-Net with weighted Dice loss (WDL) and (2) attention-based competitive dense 3D U-Net (ACD 3D U-Net) with a frequency-balancing boundary emphasizing Dice loss (FBDL) 9. Here, we further developed 3D U-Net and ACD 3D U-Net using a larger dataset of adults with obesity, performed ablation studies to assess the SAT/VAT segmentation performance, and strengthened the validity of the testing results.
Methods
Datasets: We included a subset of 629 subjects (mean body-mass-index: 33.00 kg/m2) from the IRB-approved Habitual Diet and Avocado Trial (HAT) 10. An axial T1-weighted 3D dual-echo Dixon sequence was acquired to measure SAT and VAT at 3T. TEOP (1.23ms) and TEIP (2.46ms) images were used to calculate F and W images 11. Matrix size:192$$$\times$$$192, field-of-view (FOV): 400$$$\times$$$400 mm, 51 slices, slice thickness: 3.5 mm, TR: 5 ms, flip angle: 9$$$^{\circ}$$$. To be compatible with the 3D convolutional filter sizes, the number of slices was interpolated to 64. We stratified the dataset into training (70%), validation (10%), testing (20%) sets with similar characteristics.Networks: We trained 3D U-Net 12 with WDL 13, a common baseline network for SAT/VAT segmentation 6. Our proposed ACD 3D U-Net 8 consisted of competitive dense connections (Figure 1B) 14 and channel-spatial attention blocks (Figure 1C) 15. We used the FBDL 8, 9 to address the spatially varying, complex features of VAT. FBDL uses logistic weights 16 to address the class imbalance between SAT/VAT while emphasizing the boundaries 8, 9. We used TEOP, W, and F images as inputs to exploit the multi-contrast MRI information 8. The networks outputted SAT and VAT segmentations concurrently (Figure 1A).
Evaluations: Segmentation performance was evaluated using 3D Dice scores (Dice-VAT, Dice-SAT), false negatives (FN) [%], and false positives (FP) [%] per subject 17. Quantitative agreement in volume between manual annotations and network outputs was assessed using volume distance (VD) [%] per subject 17 (VD-SAT, VD-VAT).
Ablation study: We investigated three aspects. (1) Network structures: 3D U-Net with WDL vs. ACD 3D U-Net with WDL. (2) Loss functions: ACD 3D U-Net with WDL vs. FBDL. (3) Network inputs: ACD 3D U-Net with FBDL and W+F vs. TEOP+TEIN vs. TEOP+W+F.
Results
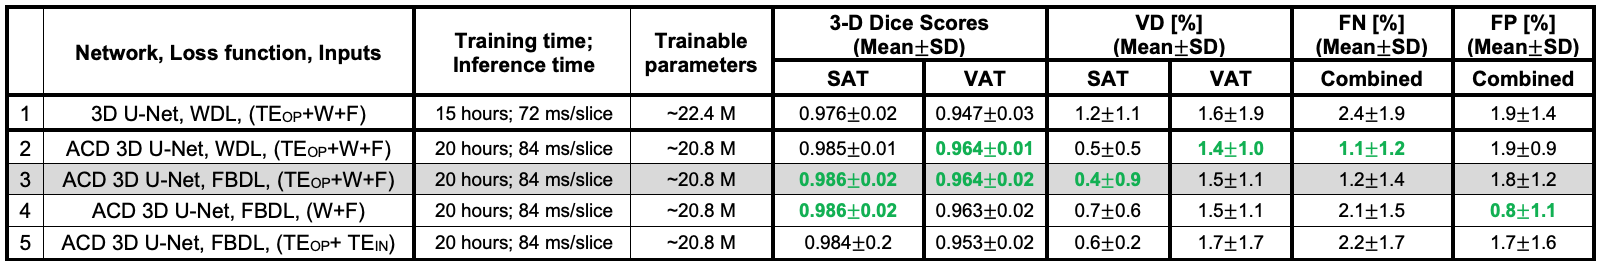
Figures 2-3 show results for two representative subjects. ACD 3D U-Net yielded higher Dice-SAT and Dice-VAT for these subjects. FN and FP for ACD 3D U-Net were smaller than 3D U-Net (Fig. 4). Table 1 summarizes the ablation study results. All networks achieved accurate segmentation. The mean Dice-VAT improved from 0.947 (network 1) to 0.964 (network 3). Similarly, Dice-SAT increased for the proposed network (network 3). VD-SAT decreased from 1.2% (network 1) to 0.4% (network 3). VD-VAT was similar for networks 1 and 3. Compared to 3D U-Net (network 1), ACD 3D U-Net (networks 2-5) reduced the FN and FP.Discussion
ACD 3D U-Net with FBDL outperformed 3D U-Net with WDL, achieving higher Dice scores, smaller FN, FP, and VD, and rapid inference times (84 ms/slice). Considering the smaller number of trainable parameters and superior performance, the proposed ACD 3D U-Net generalized the features better than 3D U-Net. More importantly, the proposed network markedly reduced gross errors, eliminating large FP regions in the SAT, arms, and vertebral bodies (Figs. 2-3). According to the ablation study (Table 1), the ACD blocks improved the performance the most. W and F images as inputs are critical for learning the informative features, as seen in the improvements for networks 2-4 vs. network 5.Compared to previous works, our dataset is one of the largest (n=440 training, n=127 testing) and strengthened the validity of the results. Our work achieved higher Dice-VAT values (0.964) than the 2.5D FatSegNet with TEOP+TEIP (Dice-VAT: 0.85) 5 and 3D DCNet with W+F (Dice-VAT: 0.89) 6. These results demonstrated a promising advance in the state-of-the-art for VAT segmentation.
Our study had limitations. First, 3D networks require large memory due to full-FOV volumetric inputs. Future research can investigate the trade-offs between patch-based and full-FOV implementations. Second, the benefit of FBDL was not fully characterized as ACD may already capture the complex VAT details, especially with a large training dataset. Future work can analyze the advantages of FBDL for adapting the networks to datasets with varying characteristics and/or smaller size. Lastly, the differences in performance levels of previous works could be due to different subject characteristics and evaluation methodology.
Conclusion
ACD 3D U-Net segments SAT/VAT rapidly and accurately with state-of-the-art performance and could be an automated tool to analyze body composition in adults with obesity.Acknowledgements
This study was supported in part by the Hass Avocado Board and the NIH (R01DK124417). This work was presented on behalf of the Habitual Diet and Avocado Trial (HAT) investigators.References
1. Shuster, A., et al., The clinical importance of visceral adiposity: a critical review of methods for visceral adipose tissue analysis. Br J Radiol, 2012. 85(1009): p. 1-10.
2. Linge, J., et al., Body Composition Profiling in the UK Biobank Imaging Study. Obesity (Silver Spring), 2018. 26(11): p. 1785-1795.
3. Ly, K.V., et al., Free-breathing Magnetic Resonance Imaging Assessment of Body Composition in Healthy and Overweight Children: An Observational Study. J Pediatr Gastroenterol Nutr, 2019. 68(6): p. 782-787.
4. Bonekamp, S., et al., Quantitative comparison and evaluation of software packages for assessment of abdominal adipose tissue distribution by magnetic resonance imaging. International journal of obesity, 2008. 32(1): p. 100-111.
5. Estrada, S., et al., FatSegNet: A fully automated deep learning pipeline for adipose tissue segmentation on abdominal dixon MRI. Magnetic Resonance in Medicine, 2020. 83(4): p. 1471-1483.
6. Küstner, T., et al., Fully Automated and Standardized Segmentation of Adipose Tissue Compartments via Deep Learning in 3D Whole-Body MRI of Epidemiologic Cohort Studies. Radiology: Artificial Intelligence, 2020. 2(5): p. e200010.
7. Langner, T., et al., Fully convolutional networks for automated segmentation of abdominal adipose tissue depots in multicenter water–fat MRI. Magnetic resonance in medicine, 2019. 81(4): p. 2736-2745.
8. Kafali, S.G., et al., 3D Neural Networks for Visceral and Subcutaneous Adipose Tissue Segmentation using Volumetric Multi-Contrast MRI, in 43rd Annual Conference of IEEE Engineering in Medicine and Biology Society (EMBC). 2021.
9. Kafali, S.G., et al. A Densely Connected Neural Network with Frequency Balancing Loss for Adipose Tissue Segmentation in Children using Free-Breathing Abdominal MRI. in 29th Annual Meeting of International Society of Magnetic Resonance in Medicine. 2021.
10. Reboussin, D.M., et al., The design and rationale of a multi-center randomized clinical trial comparing one avocado per day to usual diet: The Habitual Diet and Avocado Trial (HAT). Contemporary Clinical Trials, 2021. 110: p. 106565.
11. Eggers, H. and P. Börnert, Chemical shift encoding‐based water–fat separation methods. Journal of Magnetic Resonance Imaging, 2014. 40(2): p. 251-268.
12. Çiçek, Ö., et al. 3D U-Net: Learning Dense Volumetric Segmentation from Sparse Annotation. in Medical Image Computing and Computer-Assisted Intervention – MICCAI 2016. 2016. Cham: Springer International Publishing.
13. Sudre, C.H., et al., Generalised dice overlap as a deep learning loss function for highly unbalanced segmentations, in Deep learning in medical image analysis and multimodal learning for clinical decision support. 2017, Springer. p. 240-248.
14. Estrada, S., et al. Competition vs. concatenation in skip connections of fully convolutional networks. in International Workshop on Machine Learning in Medical Imaging. 2018. Springer.
15. Woo, S., et al. Cbam: Convolutional block attention module. in Proceedings of the European conference on computer vision (ECCV). 2018.
16. Roy, A.G., et al., QuickNAT: A fully convolutional network for quick and accurate segmentation of neuroanatomy. NeuroImage, 2019. 186: p. 713-727.
17. Taha, A.A. and A. Hanbury, Metrics for evaluating 3D medical image segmentation: analysis, selection, and tool. BMC medical imaging, 2015. 15(1): p. 29.
Figures