0550
Can Ultrafast MRI replace conventional DCE MRI in morphological evaluation and subtype classification in breast mass lesions?1Translational Medicine, Diagnostic Radiology, Lund University, Skåne University Hospital, Malmö, Sweden, 2Diagnostic Imaging and Nuclear Medicine, Kyoto University Graduate School of Medicine, Kyoto, Japan, 3Diagnostic Radiology, Kansai Electric Power Hospital, Osaka, Japan, 4Siemens Healthcare K.K., Tokyo, Japan, 5Siemens Healthcare GmbH, Erlangen, Germany, 6Breast Surgery, Kyoto University Graduate School of Medicine, Kyoto, Japan
Synopsis
To evaluate the possibility of replacing conventional DCE MRI with UF-DCE MRI, we assessed the concordance of morphological information of the mass lesions between UF-DCE MRI and the early phase of DCE MRI. The size and shape showed excellent concordance between the two phases, while UF-DCE MRI tended to show circumscribed margin and homogeneous enhancement. In a sub-analysis, luminal subtypes demonstrated smaller size with homogeneous enhancement pattern compared with non-luminal subtypes. Predictive model for luminal subtype using the two parameters resulted in the AUC of 0.68, 0.72, for UF-DCE MRI and the early phase of DCE MRI, respectively (p=0.23).
Introduction
Ultrafast dynamic contrast enhanced (UF-DCE) MRI is a novel acquisition to reveal kinetic information of the very early phase with high spatial and temporal resolution. UF-DCE MRI based kinetic parameters show equivalent or higher diagnostic performance to differentiate benign and malignant breast lesion than that of conventional DCE MRI based kinetic parameters [1-3]. Consequently UF-DCE MRI has the potential to replace conventional DCE MRI. Although kinetic and morphological information is required for breast imaging reporting and database system (BI-RADS) descriptors, there are no studies comparing the morphological information between UF-DCE MRI and conventional DCE MRI. Therefore, we aimed to evaluate the agreement of morphological information of malignant mass lesions between UF-DCE MRI and the early phase of DCE MRI. For sub-analysis, we compared UF-DCE MRI and conventional DCE MRI to diagnose luminal subtype and non-luminal subtype using morphological information.Materials & Methods
Study population: Study population consisted of patients who underwent breast MRI including the UF-DCE MRI with conventional MRI protocols between December 2015 and May 2020, and histopathologically diagnosed as invasive breast carcinomas. Those who received neoadjuvant chemotherapy or neoadjuvant endocrine-therapy, whose lesions were not visible on ADC maps, or with failure of UF-DCE acquisition were excluded. A total of 191 lesions in 187 patients (age range 31-87 years, mean 58 years) were included (bilateral lesions in 4 patients).MRI protocols and Image analysis: Breast MRI was performed with a 3T scanner using dedicated 16 or 18 channel bilateral breast coils. Protocols included three phases of fat suppressed T1WI DCE images (TR/TE 3.8/1.4 ms, FA 15˚; matrix, 0.86 × 0.86 × 1.0 mm3/voxel). Two post contrast standard DCE images were obtained immediately after the UF-DCE protocol. UF-DCE MRI was obtained as prototypical Compressed Sensing VIBE (CS-VIBE): 15 seconds before contrast injection to 60 seconds after contrast injection, 2 seconds preparation time followed by 20 continuous phases taken at a rate of 3.7 s/phase immediately after gadolinium injection (TR/TE 5.0 - 4.8/2.5 ms, FA 15˚, 0.94 x 0.94 x 2.5 mm3/voxel). Two radiologists evaluated lesion size and morphological information of the lesions (shape, margin, and internal enhancement) using the final phase of UF-DCE MRI and the early phase of DCE MRI.
Histopathological evaluation: The histopathological information including tumor histology, histological grade, and immunohistochemistry (IHC) status were obtained from pathological reports. Luminal subtype was defined as ER, PR positive, and HER-2 negative using IHC status.
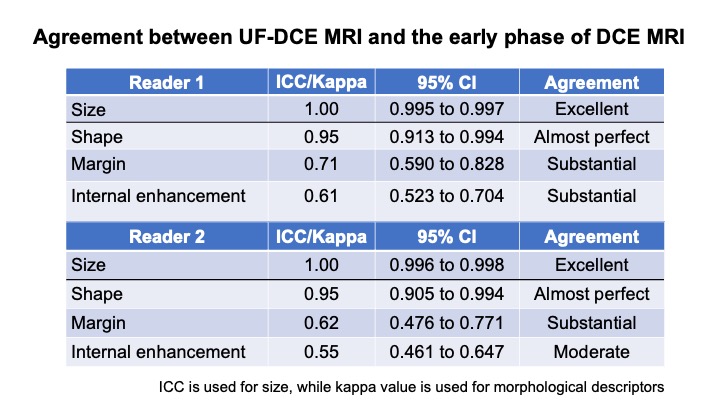
Statistical Analysis: The inter-method agreements of morphological information between UF-DCE MRI and the early phase of DCE MRI was evaluated for both reader 1 and 2 using ICC for size, kappa statistics for morphology descriptor. Kappa statistics were calculated using a scale by Viera and Garret [4]. Difference in proportion of each descriptor between UF-DCE and the early phase of DCE MRI were examined by using Pearson’s Chi-square or Fisher test of independence.One of the readers results was used to predict luminal and non-luminal subtypes by size and morphological information using univariate and multivariate logistic regression analysis (significant parameters, p<0.05). The two different prediction models between UF-DCE MRI and the early phase of DCE MRI was created from multivariate logistic regression analysis using an area under the ROC curve (AUC). Then, the AUCs were compared using DeLong test.
Results
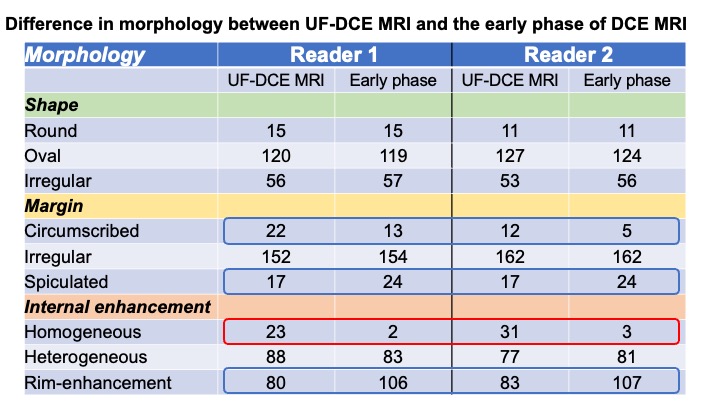
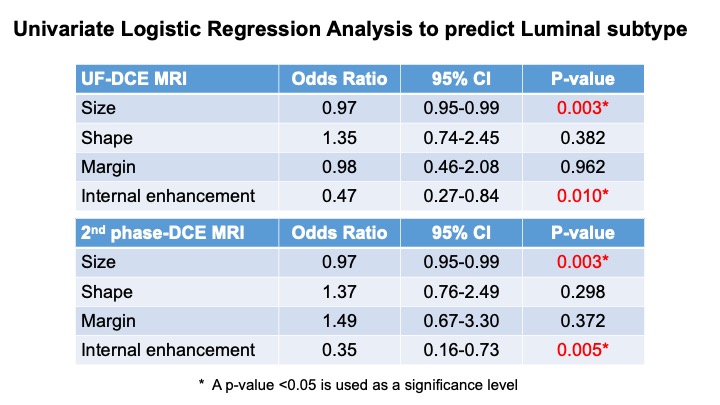
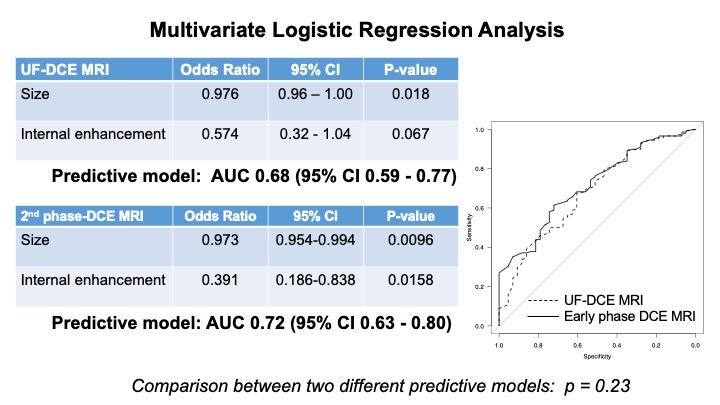
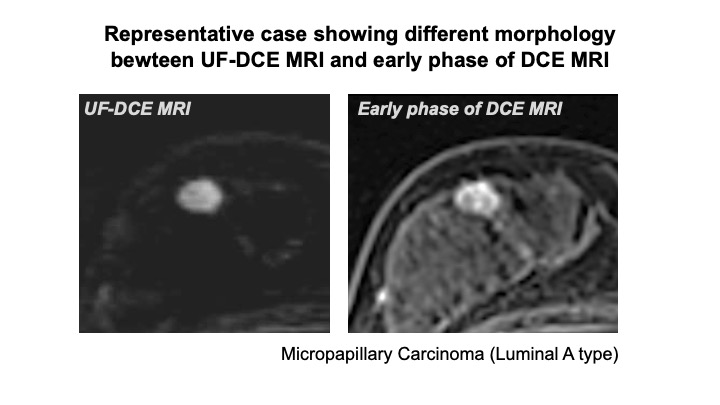
Agreement between UF-DCE and the early phase of DCE MRI: Most of inter-method agreements between UF-DCE MRI and the early phase of DCE MRI were higher than substantial (fig. 1). The details are shown in fig. 2. UF-DCE MRI showed circumscribed margin and homogeneous enhancement more often than the early phase of DCE MRI. There is no significant difference between UF-DCE and the early phase of DCE MRI (shape, margin, internal enhancement; p=0.22, 0.09, 1.00).Prediction of luminal subtype based on morphology: Among 191 lesions, there were 146 lesions with Luminal subtype. After univariate and multivariate logistic regression analysis, size and internal enhancement remained as significant parameters in predicting luminal subtype in both UF-DCE MRI and the early phase of DCE MRI (fig. 3). The multiparametric prediction models using these significant parameters yielded an area under the ROC curve (AUC) of UF-DCE MRI as good as that of the early phase of DCE MRI: 0.68 (confidence interval (CI): 0.59-0.77); 0.72 (CI: 0.63-0.80), respectively, p=0.23 (fig. 4). Representative case were shown in fig.5.
Discussion
In terms of lesion size and shape, excellent agreement was demonstrated between images on UF-DCE MRI, and 2nd phase DCE MRI, suggesting that UF-DCE MRI can be used as a replacement of 2nd phase DCE image. On the other hand, the frequencies of margin and internal enhancement pattern were different between UF-DCE MRI, and the early phase DCE images. UF-DCE MRI images tended to be more circumscribed, less spiculated, more homogeneous with less rim enhancement. The timing of UF-DCE MRI may be too early to depict internal enhancement, or the spatial resolution is insufficient to evaluate the margin of the lesion. However, morphology of UF-DCE MRI can be used to capture luminal subtype-specific features as good as conventional DCE MRI.Conclusion
UF-DCE MRI has a potential to replace conventional DCE MRI in terms of evaluating morphological information among malignant mass lesions.Acknowledgements
Tumor vascularity and tumor-related vessels using ultrafast DCE MRI of the Breast Grants-in-Aid for Scientific Research Grant-in-Aid for Scientific Research (C), Japan Society for the Promotion of Science, Apr, 2018 - Mar, 2021(18K07673)References
1. Mann R. et al, Investigative Radiology 49:579-585 (2014)
2. Ohashi A. et al, Eur. Journal of Radiol. 2019 Sep;118:285-292.
3. Honda H. et al, J. Magn. Reson. Imaging. 2020 Jan;51(1):164-174.
4. Viera AJ, Garrett JM. Fam Med 2005;37(5):360–3.
Figures