0548
Diffusion restriction comparison between Gleason 4 fused and cribriform glands within patients using whole mount prostate pathology1Biophysics, Medical College of Wisconsin, Wauwatosa, WI, United States, 2Biostatistics, Medical College of Wisconsin, Wauwatosa, WI, United States, 3Radiology, Medical College of Wisconsin, Wauwatosa, WI, United States, 4Pathology, Medical College of Wisconsin, Wauwatosa, WI, United States, 5Urology, Medical College of Wisconsin, Wauwatosa, WI, United States, 6Biomedical Engineering, Medical College of Wisconsin, Wauwatosa, WI, United States
Synopsis
This study used prostate histology and multi-parametric magnetic resonance imaging (MP-MRI) to evaluate diffusion differences in Gleason pattern 4 gland morphology. After surgery, tissue was sliced using slicing jigs, annotated by a board-certified pathologist, and digitally contoured to differentiate lumen and epithelium. Slides were co-registered to the T2-weighted MRI scan. Two linear mixed models were fitted to the MP-MRI data to consider the different hierarchical structures. Model (1) considers patient as random effect, and Model (2) adds a nested effect for slide. We found that cribriform glands were more diffusion restricted than fused glands in Gleason Grade 4 tumors.
Introduction
Prostate cancer (PCa) accounts for 26% of new cancer diagnoses in men1, making it the most diagnosed non-cutaneous cancer in men. Prostate cancer is graded using the Gleason grading scale, which assigns a score corresponding to the Gleason grades of the two most predominant glandular patterns. These patterns assign patients into five Grade Groups (GG) to predict prognosis2. Gleason grade (G3) cancers often do not progress to metastatic cancer and are monitored through active surveillance. Clinically significant cancers, Gleason grade 4 (G4) and grade 5 (G5), are aggressive and are more likely to progress and cause death3. Recently cribriform glands have been added to the G4 patterns and are associated with a poorer prognosis than G4 fused glands. Multiparametric (MP) magnetic resonance imaging (MRI) including diffusion and perfusion imaging has shown promise in improving the diagnostic accuracy of high-grade prostate cancer4,5. Recent studies have shown MP-MRI outperforming prostate specific antigen (PSA) testing alone in the identification of clinically significant PCa6.This study sought to determine whether diffusion differed between G4 patterns. We specifically looked at patients with both G4 fused glands (G4FG) and G4 cribriform (G4CG) glands to determine whether ADC differed. In addition, we looked at histomorphometric features to assess analogous differences between G4 patterns.
Methods
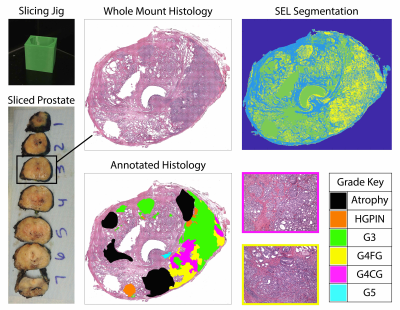
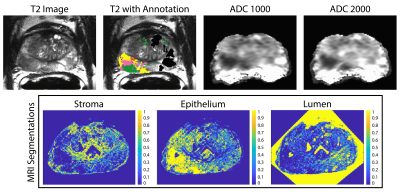
Patients undergoing prostatectomy for suspected prostate cancer were enrolled in this IRB approved study. Patients underwent MRI prior to surgery. Inclusion criteria for this study required whole mount prostate samples to contain bothfused and cribriform G4 patterns on the same sample. Of 39 screened, 22 patients fit this inclusion criteria. A diagrammatic representation of the data collection and analysis process is presented in Figure 1. MP-MRI was acquired using a 3T MRI scanner using an endorectal coil and included T2 and field-of-view (FOV) optimized and constrained undistorted single shot (FOCUS) DWI with ten b-values (0, 20, 25, 80, 100, 200, 500, 1000, and 2000 s/mm2). ADC was calculated by fitting a mono-exponential to b=0 and 1000, and b=0 and 2000 (ADC1000 and ADC2000) for comparison. After prostatectomy, whole-mount tissue samples were processed and stained for hematoxylin and eosin (H&E), digitized using a sliding stage microscope, and annotated by a urological fellowship trained pathologist (KAI). A total of 52 whole-mount slides were then processed to segment luminal, epithelial, and stromal pathomic feature densities (Figure 2). In-house custom MATLAB software was used to align digitized histology to the T2-weighted image using a control-point based registration7. Two linear regression models were fitted to the ADC values and pathomic features to consider the different hierarchical structures. Model (1) was a one-layer model that considered within patient effects. Model (2) was a two-layer model that considered the slides nested within patients as the random effect to determine if differences within slide were significant. All tests were 2-sided and conducted at the 0.05 significance level using R.Results
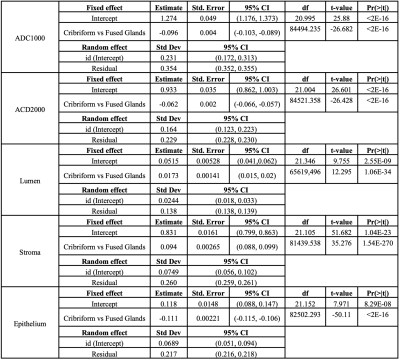
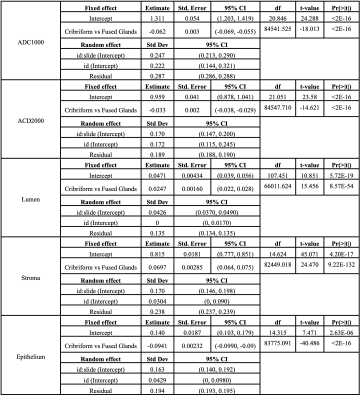
The results from Model (1) are shown in Table 1. ADC1000, ADC2000, lumen, stroma, and epithelium densities all differed significantly at the patient level. ADC is significantly decreased in G4CG vs G4FG. Epithelial density was also significantly lower in G4CG while lumen and stroma were significantly higher compared to G4FG (all p<0.05). Table 2 shows the result from Model (2), where the random effects include patients and slides nested within patients. The results are maintained from Model (1), within slide.Discussion
This study looked at different G4 patterns and the effect on both ADC and pathomic features. We find that both within patient and within slides, ADC values are significantly lower in G4CG, with analogous significant differences in pathomic feature densities. These results suggest the potential ability for radiologists to differentiate the more aggressive G4CG pattern during diagnostic read.Conclusion
Diffusion is more restricted in G4CG prostate cancer than G4FG.Acknowledgements
We would like to thank our patients for their participation in this study, the Medical College of Wisconsin Machine Learning Working Group for helpful feedback and discussions, and our funding sources: American Brain Tumor Association Grant DG160004, Froedtert Foundation, Strain for the Brain 5K Run, Milwaukee, WI, NIH/NCI R01CA218144, R01CA218144-02S1, R21CA231892, and R01CA249882.References
1. Siegel RL, Miller KD, Fuchs HE, Jemal A. Cancer Statistics, 2021. CA: A Cancer Journal for Clinicians. 2021;71(1). doi:10.3322/caac.21654
2. Epstein JI, Zelefsky MJ, Sjoberg DD, et al. A Contemporary Prostate Cancer Grading System: A Validated Alternative to the Gleason Score. European Urology. 2016;69(3). doi:10.1016/j.eururo.2015.06.046
3. Swanson GP, Chen W, Trevathan S, Hermans M. Long-Term Follow-Up after Prostatectomy for Prostate Cancer and the Need for Active Monitoring. Prostate Cancer. 2020;2020. doi:10.1155/2020/7196189
4. Vos EK, Kobus T, Litjens GJS, et al. Multiparametric Magnetic Resonance Imaging for Discriminating Low-Grade from High-Grade Prostate Cancer. Investigative Radiology. 2015;50(8). doi:10.1097/RLI.0000000000000157
5. Hambrock T, Somford DM, Huisman HJ, et al. Relationship between Apparent Diffusion Coefficients at 3.0-T MR Imaging and Gleason Grade in Peripheral Zone Prostate Cancer. Radiology. Published online 2011. doi:10.1148/radiol.091409
6. Wallis CJD, Haider MA, Nam RK. Role of mpMRI of the prostate in screening for prostate cancer. Translational Andrology and Urology. 2017;6(3). doi:10.21037/tau.2017.04.31
7. Hurrell SL, McGarry SD, Kaczmarowski A, et al. Optimized b-value selection for the discrimination of prostate cancer grades, including the cribriform pattern, using diffusion weighted imaging. Journal of Medical Imaging. 2017;5(01). doi:10.1117/1.jmi.5.1.011004
Figures


