0546
APTw imaging outperforms relaxation-compensated CEST-MRI at 3T in assessing glioma progression after radiotherapy - a preliminary analysis1Division of Radiology, German Cancer Research Center (DKFZ), Heidelberg, Germany, 2Division of Medical Physics in Radiology, German Cancer Research Center (DKFZ), Heidelberg, Germany, 3Department of Radiation Oncology, Heidelberg University Hospital, Heidelberg, Germany, 4Clinical Cooperation Unit Radiation Oncology, German Cancer Research Center (DKFZ), Heidelberg, Germany, 5Department of Physics and Astronomy, University of Heidelberg, Heidelberg, Germany, 6Faculty of Medicine, University of Heidelberg, Heidelberg, Germany, 7Department of Neuroradiology, Bonn University Hospital, Bonn, Germany
Synopsis
In this interim analysis we compared in patients with gliomas the ability of asymmetry-based amide proton transfer weighted (APTw) imaging with Lorentzian-fit-based relaxation-compensated CEST-MRI (MTRRex) of the APT, rNOE and MT signal to differentiate disease progression from treatment induced changes six weeks after completion of radiotherapy. In progressive gliomas, APTw displayed significantly higher signal intensities in contrast enhancing tissue compared to non-progressive gliomas with an AUC of 0.77 in receiver operator characteristic analyses (p 0.03). MTMTRrex showed a trend towards higher signal intensities in progressive tumors. All CEST metrics displayed significant differences in white and gray brain matter signal intensities.
Introduction
Current standard of care MRI does not enable differentiation between progression of malignant gliomas and therapy-related changes early after end of radiotherapy. Both can result in damage to the blood brain barrier and increasing edema with subsequent contrast enhancement (CE) and increasing T2w signal intensity. Chemical exchange saturation transfer (CEST)-MRI has been demonstrated to be promising for assessing response to chemo-/radiotherapy [1, 2]. However, CEST contrasts are heavily dependent on the metrics used for their extraction from the Z-spectrum and the applied magnetic field strength [3-6]. Hence, in this study we compared the ability of amide proton weighted (APTw) imaging and relaxation-compensated CEST-MRI (MTRRex) of the APT (APTMTRrex), rNOE (NOEMTRrex) and MT (MTMTRrex) signal to assess glioma progression in the first follow up after completion of radiotherapy [6, 7].Methods
From July 2018 to January 2021, 43 patients with newly diagnosed and relapsing gliomas underwent CEST-MRI at 3T (Prisma®, Siemens) six weeks after end of radiotherapy, subsequent to surgery or biopsy. Asymmetry-based APTw was performed with the established acquisition protocol of Zhou J, et al. [7] with four rectangular RF pulses and a B1 of 2μT. APTMTRrex, rNOEMTRrex and MTMTRrex based on a Lorentzian-fit analysis and a low-power B1 of 0.7µT were acquired according to [6].3D tumor segmentations of glioma-associated CE and edema, as well as, normal appearing white (NAWM) and grey matter (striatum) were performed on T1w-post-contrast (T1w-pc) and T2w-TIRM images with a custom made segmentation tool in Matlab® (Mathworks). Relevant surgically induced changes (i.e. hemorrhage) were excluded by correlation with T1w and T2*w images. Response assessment was performed according to RANO guidelines [8] by longitudinal MRI scans with a median follow up of 31 months. Receiver Operator Characteristic (ROC) analyses and Mann-Whitney-U-test were applied for differentiation of stable disease (SD) and progressive disease (PD). Wilcoxon-signed-rank-test was used to test differences in mean signal intensities between NAWM and striatum. Statistical analyzes were performed with Sigma Plot® (SYSTAT).
Results
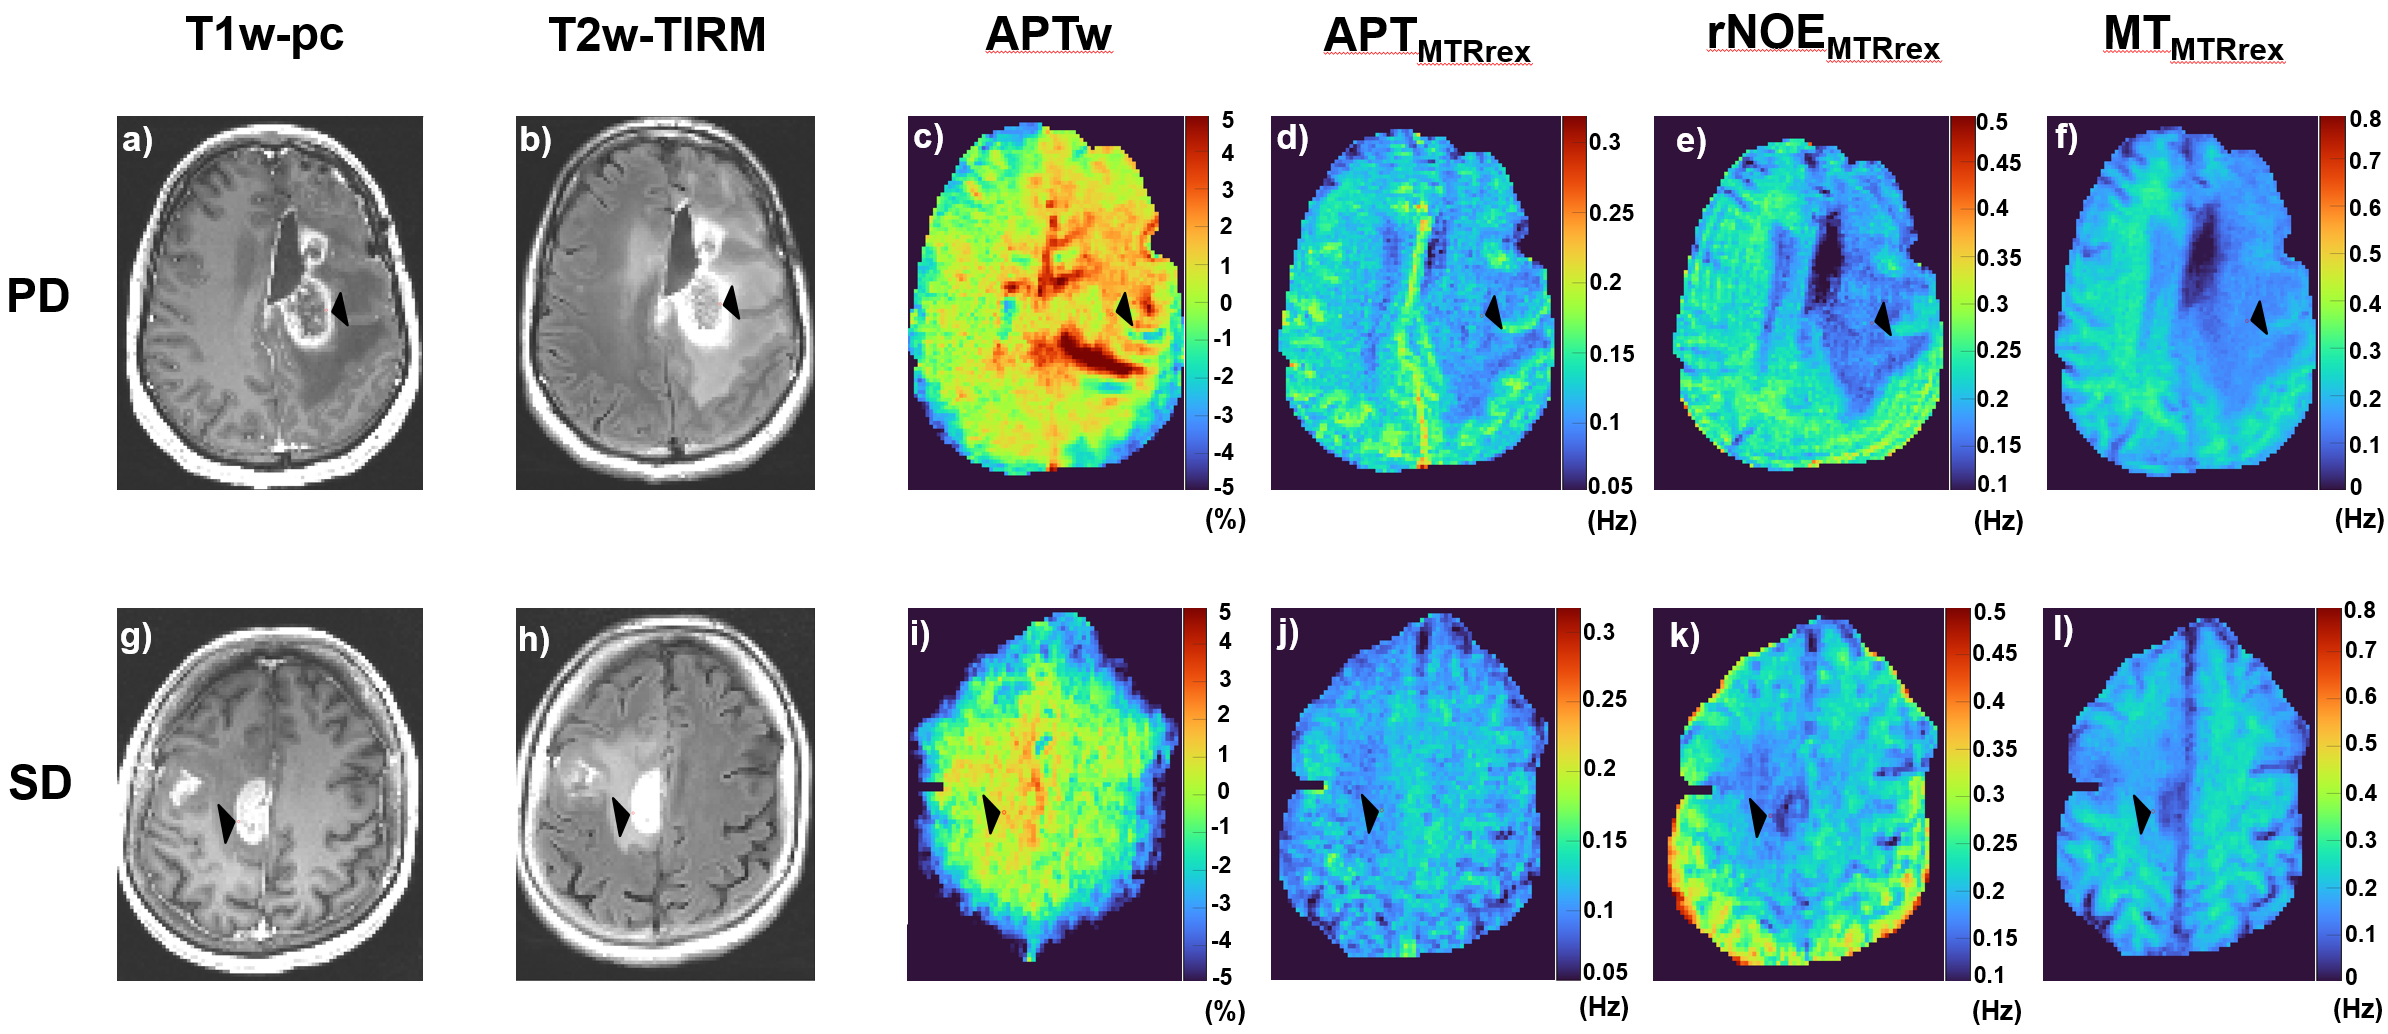
One out of 43 patients was excluded due to missing histology and two patients with H3K27M-positive gliomas due to site restriction to midline structures, with possible impact on the CEST contrasts. 25 of the remaining patients showed CE tumor tissue, 15 of which were assessed as PD and ten as SD. Three patients with SD actually showed pseudo progression (PP).Fig. 1a-I displays exemplary images of CEST-MRIs of two patients with SD and PD.
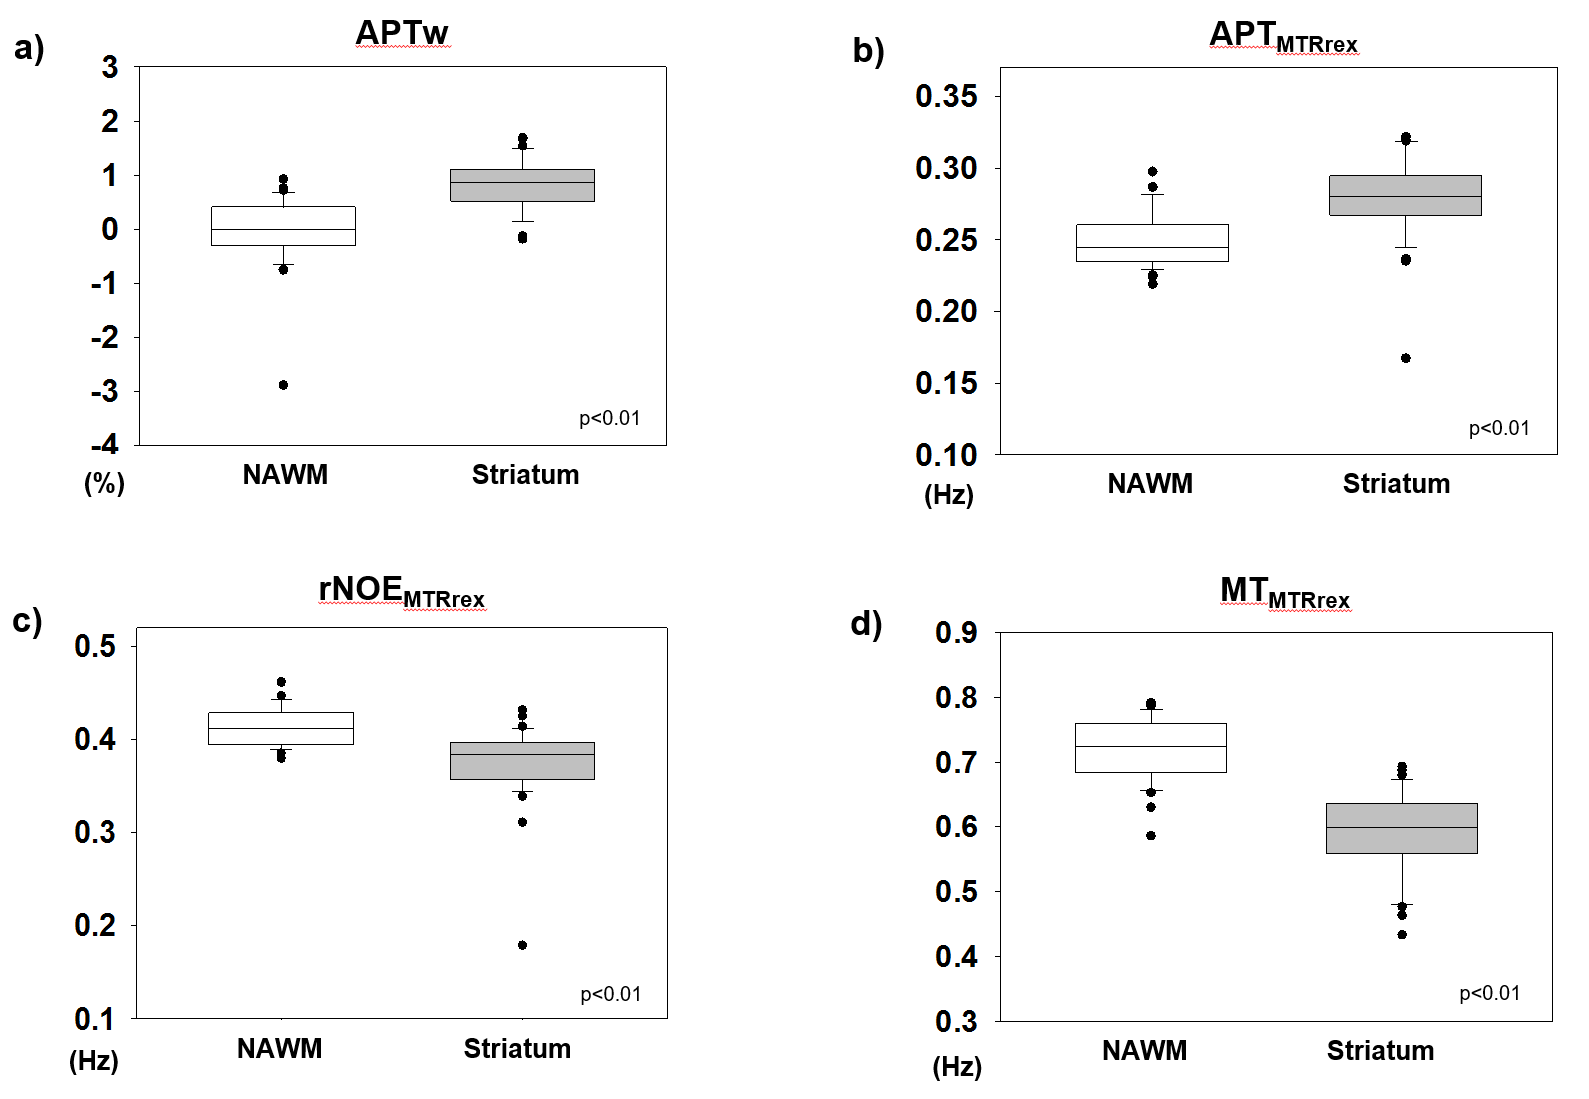
All CEST contrasts were significantly different between white and gray brain matter. Median values for NAWM and striatum were (i) -0.01% vs. 0.87% for APTw (ii) 0.25Hz vs. 0.28Hz for APTMTRrex, (iii) 0.41Hz vs. 0.38Hz for rNOEMTRrex and (iv) 0.72 Hz vs. 0.6Hz for MTMTRrex. (i)–(iv) p<0.01 (Fig. 2a-d).
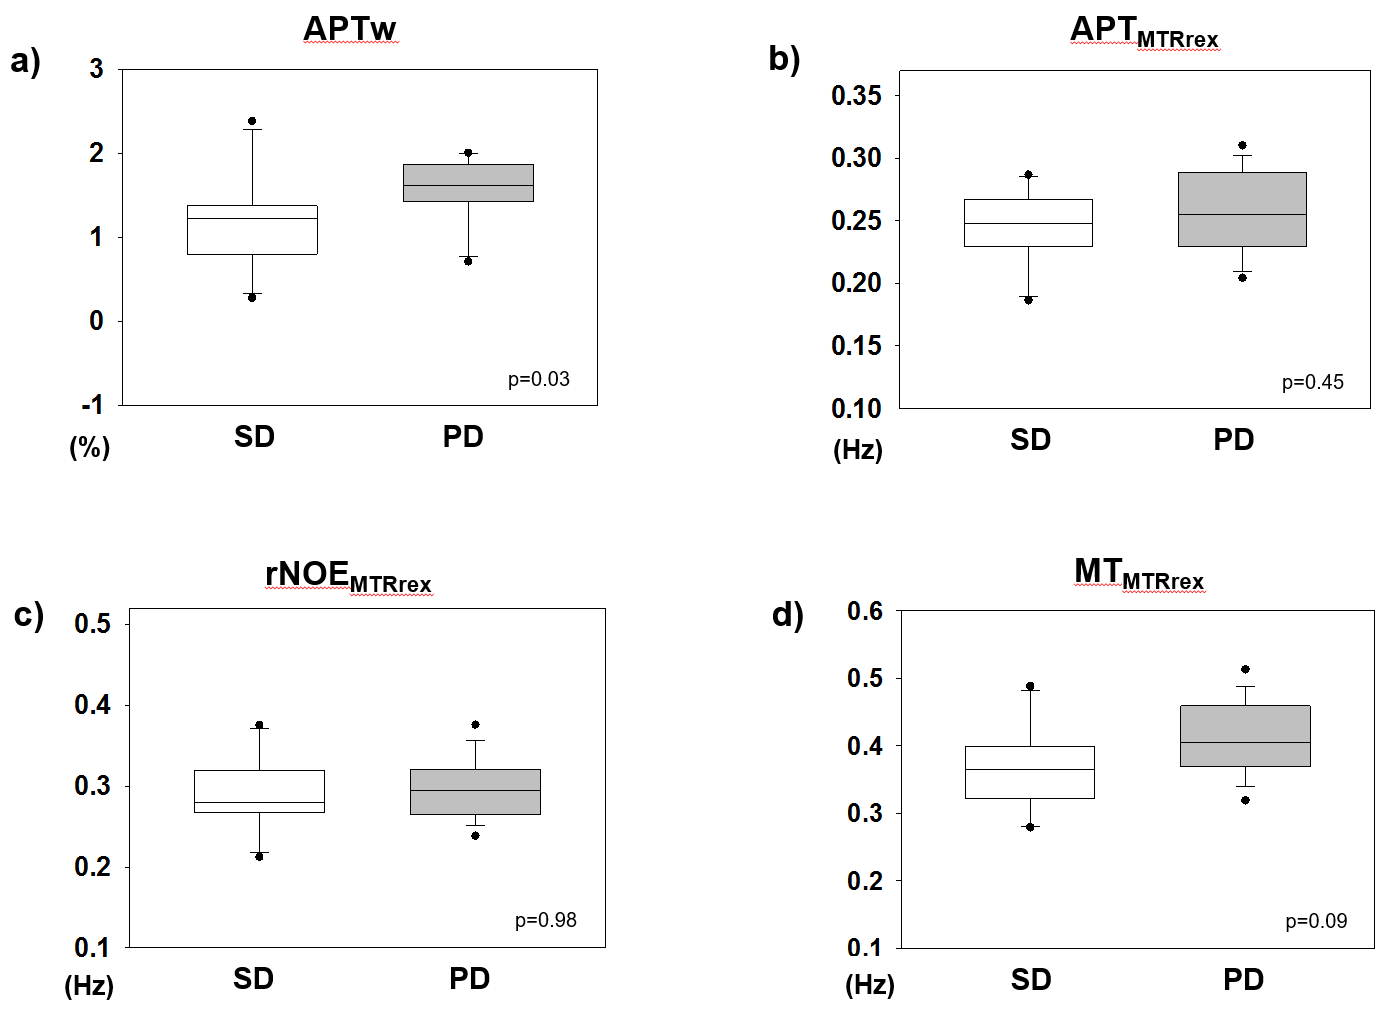
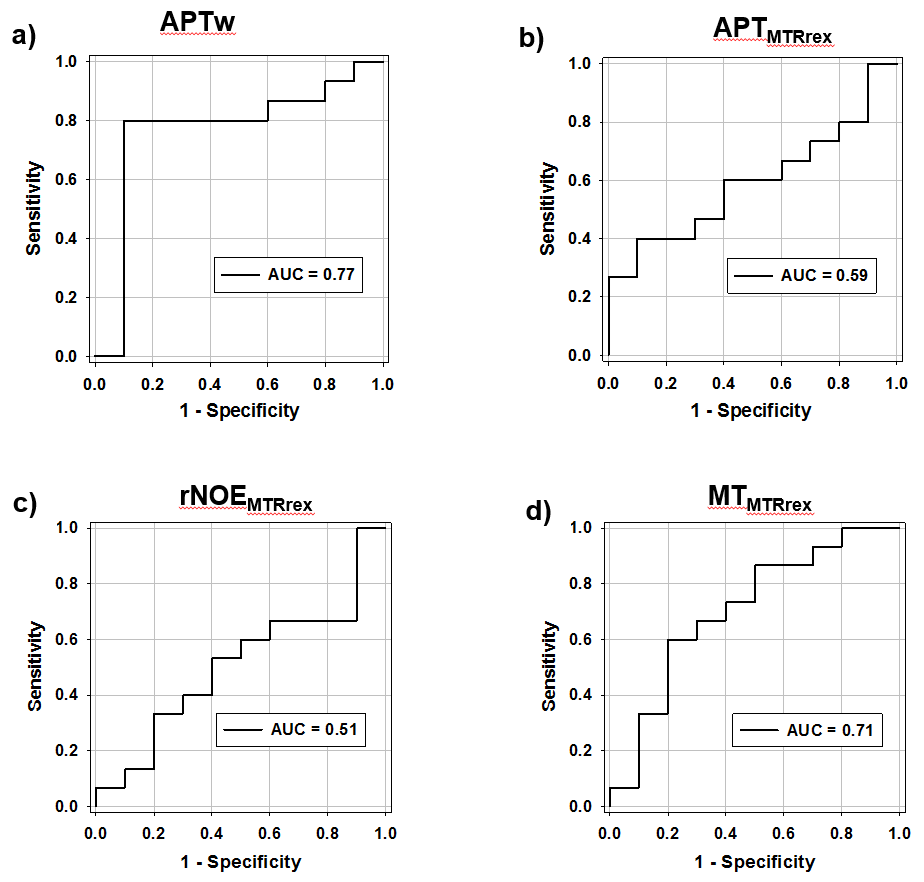
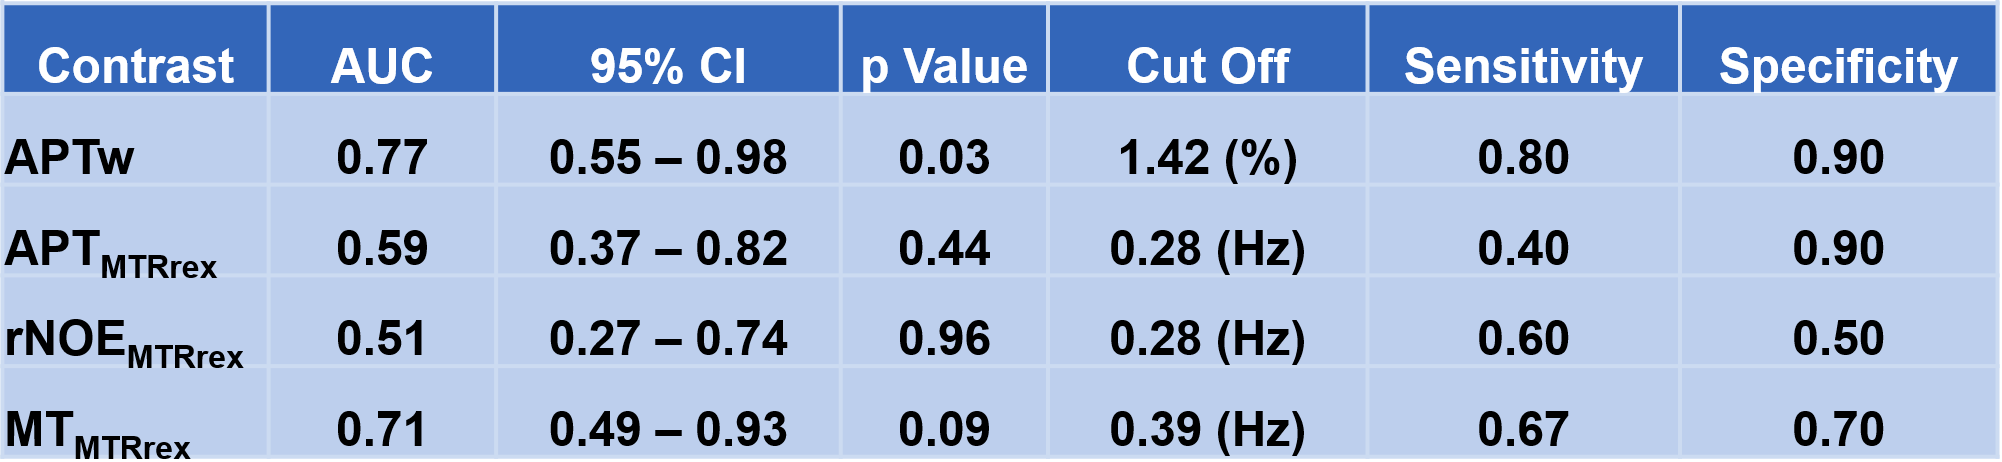
ROC analyses yielded significant results for differentiating PD from SD using the APTw signal in CE tissue with an AUC of 0.77 (cut-off 1.42%, p=0.03) (Fig. 4a/5). Median intensity values were 1.22% for SD and 1.62% for PD (p=0.03) (Fig. 3a). Of note, all three patients with PP showed APTw values below the cut-off at 1.42% (mean values +/-standard deviations: 0.76% +/-1.21%; 1.26% +/-1.6%; 1.36% +/-0.96%).
MTMTRrex showed a trend towards higher signal in CE tissue for PD vs. SD with an AUC of 0.71 (cut-off 0.39Hz, p=0.09) (Fig. 4d/5). Median values were 0.37Hz for SD vs. 0.41Hz for PD (p=0.09) (Fig. 3d).
APTMTRrex and rNOEMTRrex were not significantly (p>0.05) different in CE tissue in patients with SD vs. PD (Fig. 3b/3c/4b/4c/5). Likewise, in edema none of the evaluated contrasts displayed significant differences between patients with SD and PD.
Discussion
To our knowledge, here, we report unique interim results of an ongoing comparative study investigating the ability of APTw imaging, as well as, APTMTRrex, rNOEMTRrex and MTMTRrex CEST-MRI to correctly assess glioma progression in the first follow up after completion of radiotherapy. In 25 patients with residual CE glioma tissue, APTw outperformed APTMTRrex and rNOEMTRrex in differentiating progressors from non-progressors. MTMTRrex showed a similar trend but without reaching significance. APTMTRrex and rNOEMTRrex did not show significant signal differences between patients with progressing and non-progressing gliomas. However all three relaxation-compensated CEST metrics yielded convincing white and gray matter contrasts.Previous studies at 3T and 7T in patients with gliomas found that mean APT and rNOE signals, based on Lorentzian-fit analyses, were correlated with response to radiotherapy early in or immediately after completion of the treatment course based on [1, 2]. Other studies at 3T demonstrated that APTw imaging correlated with disease progression early after completion of radiotherapy [9, 10]. Of note, all three patients with PP showed mean APTw values below the cut-off value of 1.42%. This issue will also be further investigated in the ongoing prospective clinical study.
Conclusion
In this interim analysis, APTw and MTMTRrex outperforms APTMTRrex and rNOEMTRrex in assessing progression of glioma in the first follow up after end of radiotherapy. This might indicate that APTw imaging may be more sensitive to detect early progression-induced changes compared to the relaxation-compensated metric at 3T. However, the convincing white and gray brain matter contrasts of rNOEMTRrex and APTMTRrex verify their functionality and warrant further clinical investigation in untreated brain tumors and patients suffering from other neurological disorders.Acknowledgements
This study is supported by a grant of the German Research Foundation (DFG project number 445704496).
References
1. Meissner, J.E., et al., Early response assessment of glioma patients to definitive chemoradiotherapy using chemical exchange saturation transfer imaging at 7 T. J Magn Reson Imaging, 2019. 50(4): p. 1268-1277.
2. Mehrabian, H., et al., Evaluation of Glioblastoma Response to Therapy With Chemical Exchange Saturation Transfer. Int J Radiat Oncol Biol Phys, 2018. 101(3): p. 713-723.
3. Zhou, J., et al., Amide proton transfer (APT) contrast for imaging of brain tumors. Magn Reson Med, 2003. 50(6): p. 1120-6.
4. Zaiss, M., et al., Relaxation-compensated CEST-MRI of the human brain at 7T: Unbiased insight into NOE and amide signal changes in human glioblastoma. Neuroimage, 2015. 112: p. 180-188.
5. Zaiss, M., et al., Downfield-NOE-suppressed amide-CEST-MRI at 7 Tesla provides a unique contrast in human glioblastoma. Magn Reson Med, 2017. 77(1): p. 196-208.
6. Goerke, S., et al., Relaxation-compensated APT and rNOE CEST-MRI of human brain tumors at 3 T. Magn Reson Med, 2019. 82(2): p. 622-632.
7. Zhu, H., et al., Fast 3D chemical exchange saturation transfer (CEST) imaging of the human brain. Magn Reson Med, 2010. 64(3): p. 638-44.
8. Chukwueke, U.N. and P.Y. Wen, Use of the Response Assessment in Neuro-Oncology (RANO) criteria in clinical trials and clinical practice. CNS Oncol, 2019. 8(1): p. CNS28.
9. Park, J.E., et al., Pre- and Posttreatment Glioma: Comparison of Amide Proton Transfer Imaging with MR Spectroscopy for Biomarkers of Tumor Proliferation. Radiology, 2016. 278(2): p. 514-23.
10. Ma, B., et al., Applying amide proton transfer-weighted MRI to distinguish pseudoprogression from true progression in malignant gliomas. J Magn Reson Imaging, 2016. 44(2): p. 456-62.
Figures