0544
Differential diagnosis of primary liver cancer using APT and quantitative DIXON techniques1The First Affiliated Hospital of Dalian Medical University, Dalian, China, 2Philips Healthcare, Beijing, China
Synopsis
Hepatocellular carcinoma (HCC), intrahepatic cholangiocarcinoma (ICC) are the most common types of primary liver cancer, which differ greatly in terms of pathogenesis, biological behavior, histological morphology, treatment, and prognosis. This retrospective study revealed that APT combined with quantitative DIXON technique could improve the performance for differentiating HCC from ICC.
Introduction
Primary liver cancer mainly includes hepatocellular carcinoma (HCC), intrahepatic cholangiocarcinoma (ICC), which differ greatly in terms of pathogenesis, biological behavior, histological morphology, treatment, and prognosis[1,2]. However, due to the similarity in typical imaging findings, the differential diagnosis of HCC and ICC is still challenging[3]. Amide proton transfer (APT) imaging, a novel imaging tool based on endogenous amide protons in mobile cellular proteins and peptides in tissue[4], has shown great potentials for the diagnosis of central nervous system diseases and cervical cancer[5,6]. Recent progress in fat quantification techniques such as mDIXON Quant[7] has provided additional information on liver functions. The purpose of this study was to explore the value of a combination of APTw and mDIXON Quant imaging in the differential diagnosis of HCC and ICC.Materials and Methods
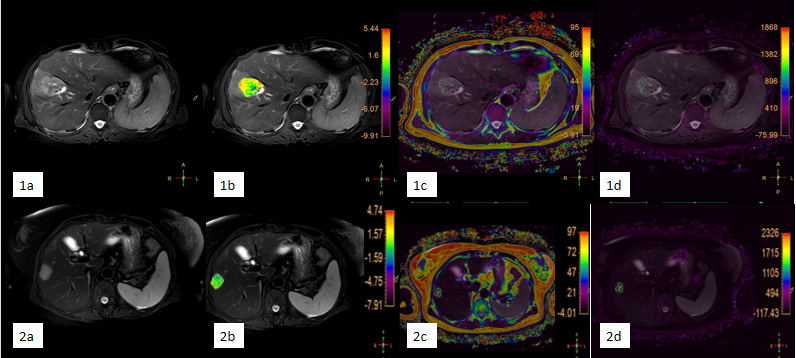
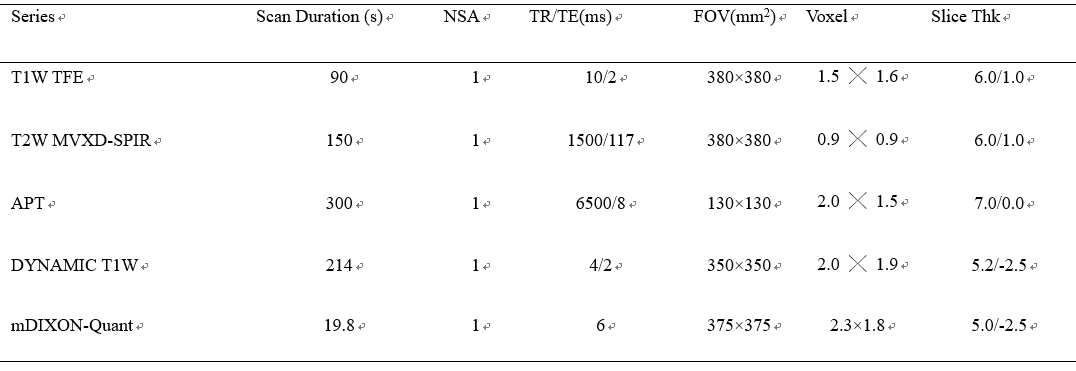
31 patients (with clinical symptoms and MRI image characteristics of primary liver cancer) were recruited in this study, which consisted of 21 HCC patients (20 men, 1 woman; mean age, 59 years; range, 33–76 years) and 10 ICC patients (8 men, 2 women; mean age, 62 years; range, 47–71 years). All patients were scanned using a 3.0 T MR scanner (Ingenia CX, Philips Healthcare, the Netherlands) with a 16-channel abdominal array coil. The detailed scan parameters were shown in Table 1. An experienced radiologist manually placed the ROIs (100 - 200 mm2) on the axial slice of fusion of T2WI and APT images, and parameter maps derived from mDIXON Quant (fat fraction (FF) and R2* maps) with the largest lesions according to the high-resolution T2W images (Figure 1). The values of APT, FF, and R2* were compared between the HCC and ICC groups by using the Mann-Whitney U test, respectively. ROC curves were analyzed to evaluate the diagnostic efficiency of APT, mDIXON Quant, and the joint use of two methods for differentiating HCC from ICC. The diagnostic values of the combination of APTw and mDIXON Quant were calculated by logistic regression. Spearman’s bivariate correlation was employed to assess the correlation between the APT values and mDIXON Quant (FF, R2*) parameters. The difference between AUCs derived from different parameters was compared using the Delong test. A p-value < 0.05 was considered statistically significant.Results
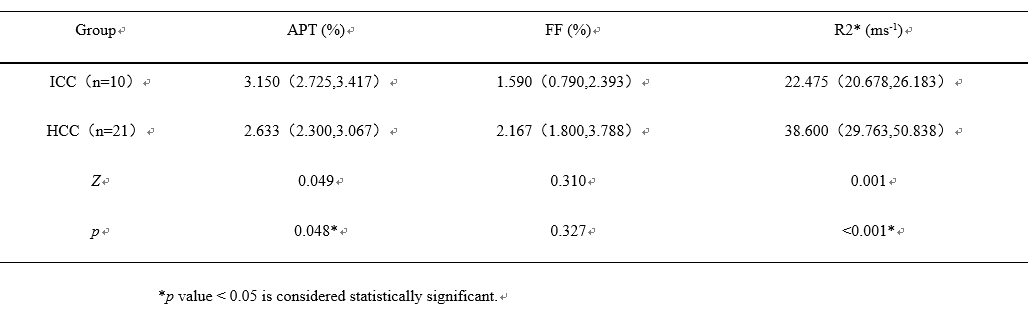
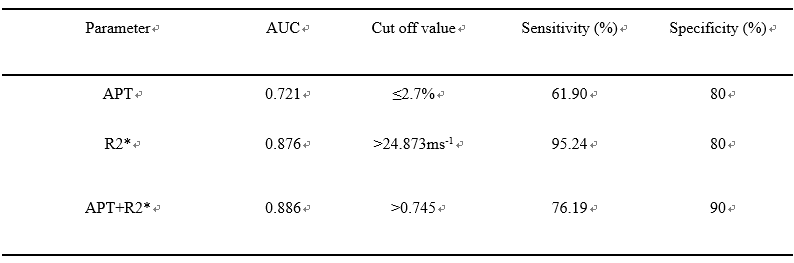
The measured values of APT, FF, and R2* from HCC and ICC patients were shown in Table 2. The values of APT were lower for HCC than ICC, whereas the value of R2* showed an opposite relationship. The values of FF did not show statistically significant differences. ROC analyses revealed the diagnostic performance of APT and R2* value in differentiating HCC from ICC, with AUCs of 0.721 and 0.876 (Table 3). The AUC of the combination of APT and R2* was 0.886, and the sensitivity was 76.19%, the specificity was 90% (cut-off value 0.745) (Table 3, Figure 2).Discussion and conclusion
ICC is histologically characterized by adenoid secretion or mucous secretion, and thus elevation of mobile proteins and peptides. This might be the reason why APT values are higher for ICC than HCC. Our results indicated that the R2* value was significantly higher in HCC than ICC, which might be due to the faster cell proliferation and more neovascularization. Compared with either APT or R2*, a combination of APT and R2* increased the AUC from 0.721 to 0.886. In conclusion, a combination of APT and R2* could enhance the diagnosis of HCC and ICC in primary liver cancer.Acknowledgements
No acknowledgments.References
[1] Ponnoprat D, Inkeaw P, Chaijaruwanich J et al. Classification of hepatocellular carcinoma and intrahepatic cholangiocarcinoma based on multi-phase CT scans.Med Biol Eng Comput, 2020, 10;58: 2497-2515.
[2] Tomimatsu M, Ishiguro N, Taniai M et al. Hepatitis c virus antibody in patients with primary liver cancer (hepatocellular carcinoma, cholangiocarcinoma, and combined hepatocellular cholangiocarcinoma) in Japan. Cancer, 1993, 8;72:683–688.
[3] Rimola J, Forner A, Reig M et al. Cholangiocarcinoma in cirrhosis: absence of contrast washout in delayed phases by magnetic resonance imaging avoids misdiagnosis of hepatocellular carcinoma. 2009, 9;50:791–798.
[4] Zhou J, Heo HY, Knutsson L et al. APT-weighted MRI: Techniques, current neuro applications, and challenging issues. Magn Reson Imaging, 2019, 50:347-364.
[5] Debnath A, Gupta RK, Singh A. Evaluating the Role of Amide Proton Transfer (APT)-Weighted Contrast, Optimized for Normalization and Region of Interest Selection, in Differentiation of Neoplastic and Infective Mass Lesions on 3T MRI. Mol Imaging Biol, 2020, 9;22:384-396.
[6] He YL, Li Y, Lin CY et al. Three-dimensional turbo-spin-echo amide proton transfer-weighted MRI for cervical cancer: A preliminary study. Magn Reson Imaging, 2019, 50:1318-1325.
[7] Pacicco T, Ratner S, Xi Y et al. Pelvic muscle size and myosteatosis: Relationship with age, gender, and obesity. Indian J Radiol Imaging, 2019, 29: 155-162.
Figures