0543
1H-14N quadrupolar relaxation of protein backbones: a potential intracellular biomarker of glioma invasion1BrainTech Lab INSERM U1205, Grenoble, France, 2University of Aberdeen, Aberdeen, United Kingdom
Synopsis
In FFC-NMR, R1-dispersion curves of biological systems frequently show quadrupolar peaks (QP) between 1.5 and 3.5 MHz that correspond to the cross relaxation of water 1H and protein 14N. QP of glioma invasion tissues (Glio6 and Glio96 mouse models) and of high glioma proliferation (U87 model) were acquired ex vivo and compared to cell pellets in vitro, showing significant differences. This result suggests that QP signals are intracellular, a result which was confirmed by measurements of cells after trypsin treatment which showed unchanged QP amplitude. This result highlights the potential of the QPs as an intracellular biomarker of glioma invasion.
Objective
In biological systems, R1-dispersion curves (R1=1/T1 versus 1H Larmor frequency ν0) acquired by Fast-Field-Cycling NMR (FFC-NMR) often exhibit local R1 enhancements between 1.5 and 3.5 MHz, called quadrupolar peaks (QP) that result from quadrupolar interactions between nitrogen 14 of amino-acids in proteins and water protons (1H-14N)1. This study is focused on glioma, an aggressive cerebral tumor, with two objectives: (i) to describe if (14N-1H) QPs signals can discriminate between invasion and proliferation tissues. To test this, we used two glioma mouse models, Glio6 and Glio96, validated as invasion/migration models2,3, compared with the U87 characterized by a high glioma proliferation. (ii) To determine the intra- or extra-cellular origin of the proteins involved in the QP. To that purpose, glioma tissues characterized by their extra and intracellular compartments were compared to cell pellets with relaxation dominated by intracellular compartments. In parallel, we performed additional FFC and QP measurements of cells treated by trypsin, a digestive enzyme of the serine proteases family that breaks down proteins. Trypsin was specifically used because it is an extracellular biochemical substance that does not cross cell membranes and therefore can only degrade the extracellular compartment.Subjects and Methods
Cell culture, cell pellet and Trypsin treatment: Glio6 and Glio96 cell lines were obtained from human surgical glioma resection prior to this work. Both were grown under hypoxia in 3% O2 and 5% CO2 in untreated flask with DMEM/F-12 (1:1) + GlutaMAX supplemented with BFGF and EBF growth factors (20ng/ml). U87 glioma cells (ATCC HTB-14) were grown in 5% CO2 under 20% O2 in DMEM + GlutaMAX (Gibco) and 10% fetal bovine serum and penicillin-streptomycin (100 U/ml). Cell pellets were obtained after centrifugations (5min, 1200rpm) and removing the supernatant. For Glio6 and Glio96, we added 1 ml cell dissociation solution and washed 5 min later, resuspended twice with 4 ml and 1ml PBS respectively, centrifuged and removed the supernatant. 20 to 40.106 cells were used for FFC-NMR measurements, acquired 40 min after preparations. For Trypsin experiments, the cells were treated by adding 20-fold excess of trypsin by weight. Cells were prepared at 37˚C and cell viability was assessed using trypan blue exclusion method before and after FFC-NMR acquisitions.Animal models: All animal procedures were conducted according to the license C3818510003). Mouse-glioma models were obtained using immune-deficient nude-mice (30 to 35 g). Glioma cells were injected into the right caudate nucleus under isoflurane (3%). In vivo MRI follow-up was performed at 4.7T with T2W- RARE sequence (TR/TE=3500/33 ms), every week during the first month and every 2 days during the second and the third months. At late stage, brains were removed (U87 n=11, Glio6 n=6, Glio96 n=7) and glioma tissues extracted (30-210mg) and stored at -80°C.
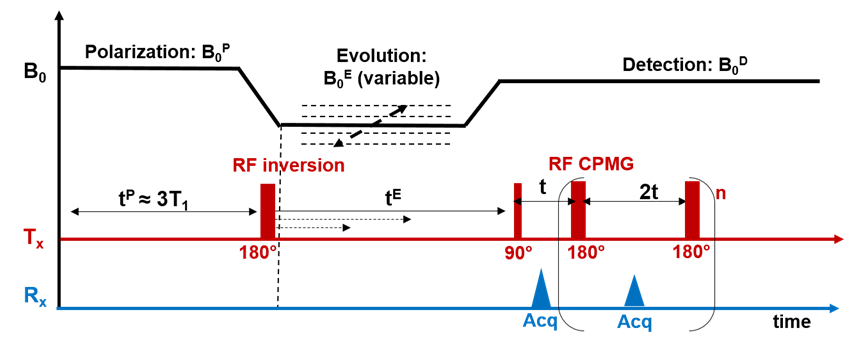
FFC-NMR: FFC-NMR as described in Figure 1 was performed using a Stelar SPINMASTER-2000 relaxometer with a 10 mm bore diameter. Samples were put in 5mm diameter NMR tube. To increase SNR we accumulated 128 echoes of a Carr–Purcell–Meiboom–Gill (CPMG) sequence with 10ms echo-time. We used 30 evolution fields with logarithmic sampling between 5KHz and 30MHz. For each field the magnetization was measured over 12 evolution times selected logarithmically between 0.01 and 4 times the estimated T1 value. QP were acquired between 1.5 and 3.5MHz with a high sampling (n=30). The total time of both acquisitions: 90min.
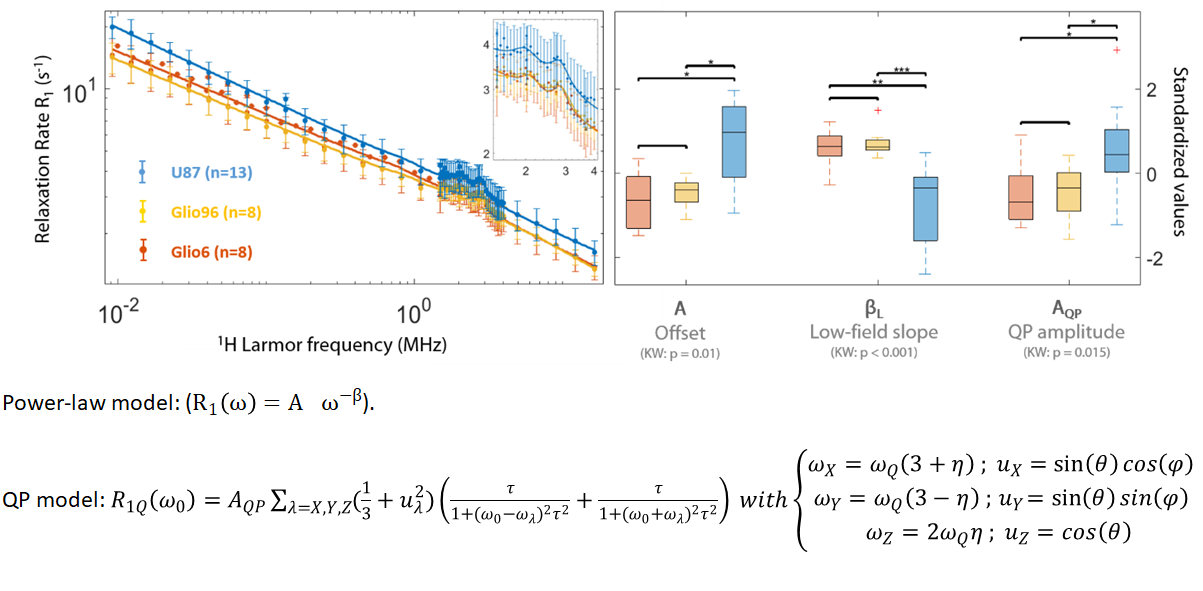
FFC analysis: The amplitude of the QP was estimated after subtracting the background contribution, fitted with a power-law model4, and analyzed according to reference5. Comparison between the different groups was assessed using the Student test at p<0.05 level while the normality was ensured with the Kruskal-Wallis (KS).
Result
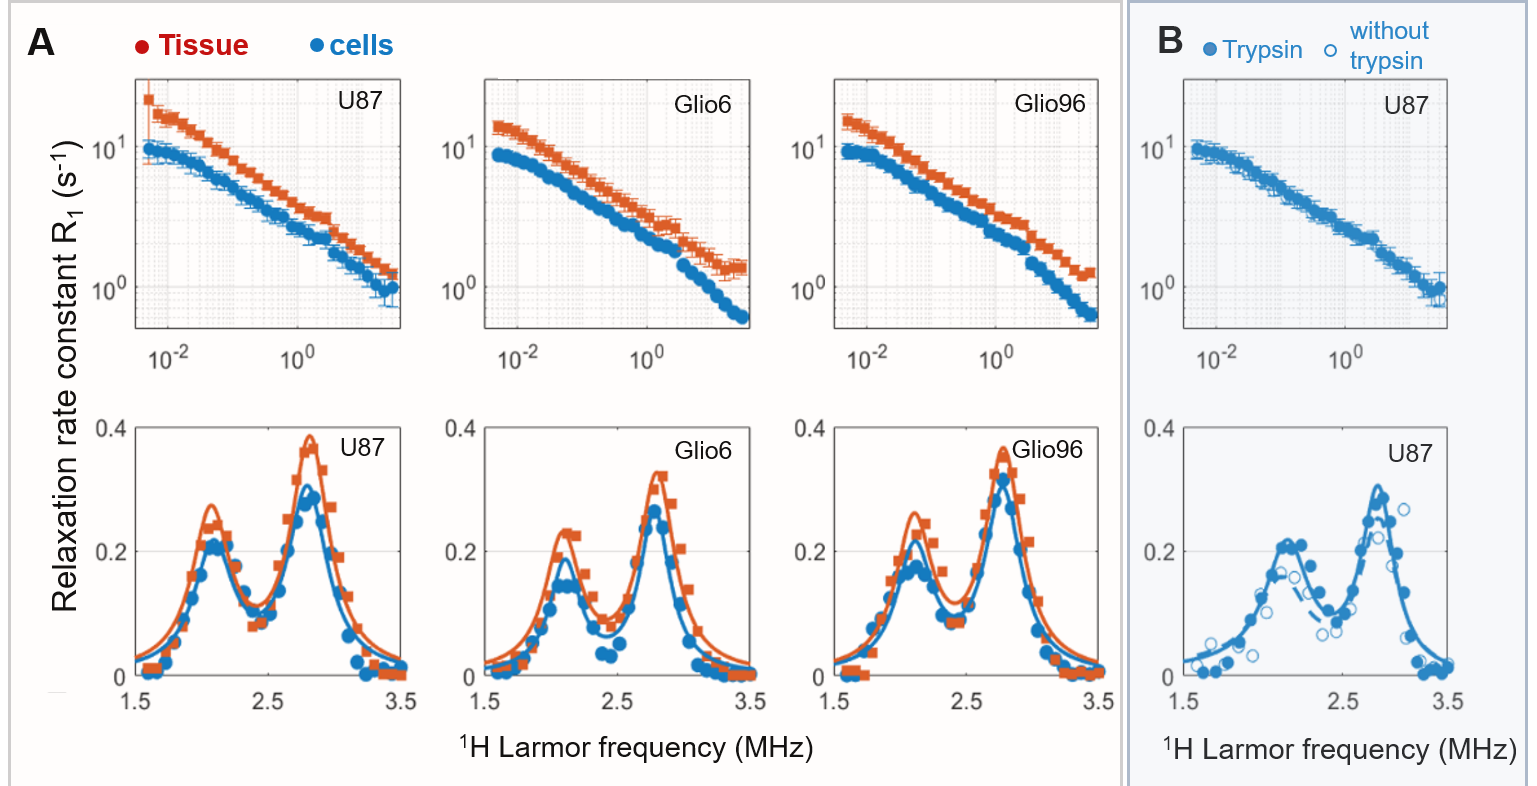
Figure 2 displays the average R1-dispersion curves of the three glioma tissues. As reported in our previous work6, this is lower for invasive glioma than for proliferative ones, as quantified by the vertical offset (A). Additionally, the exponent of the power law β also discriminates invasion from proliferation, as expected since it relates to water molecular dynamics. In all curves the QP signal was present and its amplitude was also discriminative of invasion and proliferation (p<0.05). Figure 3A compares the R1-dispersion curves of glioma tissues with their corresponding cell pellets and details the QP signal after subtraction of the curve background. Figure 4 is a table which reports the statistical analyses testing for differences between glioma tissue and their corresponding cell pellets. This is particularly marked for the peaks amplitude (AQP) which is related to the protein concentrations7, meaning that proteins responsible for QP are intracellular. Indeed, under trypsin treatment, (1H-14N) QP of cells remain unchanged (Figure 3B), confirming thereby the intracellular origin of these signals.Conclusion
From this study, we can conclude that FFC-NMR is an appropriate tool to discriminate invasion from proliferation. This study especially demonstrates that the (1H-14N) QP peak signals predominantly arise in glioma from proteins localized inside the cells. This study aimed to determine the origins of the QP signals which are modulated by motion of the protein backbones, and constitutes an important step when exploring the role of this parameter as a new glioma biomarker of large intracellular proteins.Acknowledgements
This project is as part of the European H2020 PHC-11-2015 IDentIFY project 668119.References
1. Kimmich R, Nusser W, Winter F. In vivo NMR field-cycling relaxation spectroscopy reveals 14N1H relaxation sinks in the backbones of proteins. Phys Med Biol. 1984;29(5):593-596. doi:10.1088/0031-9155/29/5/011
2. Gimenez U, Perles-Barbacaru A, Millet A, et al. Microscopic DTI accurately identifies early glioma cell migration: correlation with multimodal imaging in a new glioma stem cell model. NMR Biomed. 2016;29(11):1553-1562.
3. Dreyfus M, El-Atifi M, Court M, et al. Reprogramming glioma cell cultures with retinoic acid: Additional arguments for reappraising the potential of retinoic acid in the context of personalized glioma therapy. Glioma. 2018;(2):66-78.
4. Bottomley PA, Hardy CJ, Argersinger RE, Allen moore G. A review of 1H nuclear magnetic resonance relaxation in pathology: Are T1 and T2 diagnostic? Med Phys. 1987;14(1):1-37.
5. Fries PH, Belorizky E. Simple expressions of the nuclear relaxation rate enhancement due to quadrupole nuclei in slowly tumbling molecules. J Chem Phys. 2015;143(4):044202.
6. Petit M, Pierre S, Leclercq M, et al and Lahrech H. FFC-NMR a Promising Tool to Discriminate Infiltrative Tumour Cells from Solid Tumours: A Study of Three Glioma Mouse Models. ISMRM/ESMR, Paris (2018).
7. Broche LM, Ismail SR, Booth NA, Lurie DJ. Measurement of fibrin concentration by fast field-cycling NMR. Magn Reson Med. 2012;67(5):1453-1457. doi:10.1002/mrm.23117
Figures