0542
Assessing muscle T2 in elderly men with osteosarcopenia1Institute of Radiology, University Hospital Erlangen, Friedrich-Alexander-Universität Erlangen-Nürnberg (FAU), Erlangen, Germany, 2Department of Medicine 3, University Hospital Erlangen, Friedrich-Alexander-Universität Erlangen-Nürnberg (FAU), Erlangen, Germany, 3Institute of Medical Physics, Friedrich-Alexander-Universität Erlangen-Nürnberg (FAU), Erlangen, Germany, 4Division of Medical Physics in Radiology, German Cancer Research Center (DKFZ), Heidelberg, Germany
Synopsis
In addition to fat fraction (FF), muscular T2 could provide information on disease progression and potential training effects in osteosarcopenia, a combination of osteoporosis and sarcopenia. However, muscular T2 is highly dependent on the amount of muscle fat infiltration, which is usually increased in these patients. Thus, we aimed to assess T2 in thigh muscle tissue of elderly men with osteosarcopenia, comparing vendor-provided T2 maps with custom-fitted approaches also considering fat infiltration. We found highly elevated T2 values in the vendor-provided T2 maps compared to tri-exponentially fitted T2, which might lead to misinterpretation of muscle T2.
Introduction
Quantitative MRI measures such as fat fraction (FF) and T2 relaxation times are of increasing importance as biomarkers for muscular pathologies. In particular, muscular T2 might provide information on disease progression, as it is for example associated with inflammatory processes. However, muscular T2 is highly dependent on the amount of fat infiltration, as fat tissue possesses significantly longer T2 times than muscle. This effect is of particular importance when examining patients with a high amount of intramuscular fat, e.g. in muscular dystrophies1 but also in elderly subjects with sarcopenia. Several approaches have been proposed to correctly determine T2 in the presence of fat infiltration, e.g. tri-exponential fitting2. However, in clinical studies, T2 maps generated by the MR systems are still commonly used to assess muscular T2. The aim of this work was to investigate T2 of thigh muscle of elderly men with osteosarcopenia – a combination of osteoporosis and sarcopenia characterized by a decline in muscle function and bone strength, as well as an increase in muscle fat. Vendor-provided and custom-fitted T2 maps were used to compare the performance of different fitting methods in these patients.Methods
34 men (72 years and older) with osteosarcopenia who participated in a previous study3 were included in this retrospective evaluation. MRI was performed at a 3T whole-body scanner (Magnetom Skyrafit, Siemens Healthcare GmbH, Erlangen, Germany) using a flexible 18-channel RF coil, wrapped around the left mid-thigh. The MRI protocol included a T1-weighted Turbo Spin Echo (TSE) measurement, an optimized 6-pt Dixon Gradient Echo Volumetric Interpolated Breath-hold Examination (VIBE) prototype4, as well as a Multi-Slice Multi-Echo (MSME) sequence for T2 determination (see Tab.1 for measurement parameters).MR images were segmented using the Medical Image Analysis Framework (MIAF, University of Erlangen). First, the thigh volume was divided into subcutaneous adipose tissue (SAT), intra-fascia volume and bones based on the T1-weighted image. Then, the intra-fascia volume was further segmented into intermuscular adipose tissue (IMAT) and muscle tissue using the Dixon image.5,6 Resulting masks for SAT and muscle tissue were co-registered to the MSME data (compare Fig.1).
For T2 evaluation, the signal of voxels within SAT was averaged and a bi-exponential fit was performed to determine relaxation properties of fat tissue. The resulting short and long T2 components (T2s,fat, T2l,fat), as well as the short component fraction (fs,fat) for each subject were then used as fixed parameters for a tri-exponential, voxel-wise fit to determine water T2 (T2water) within muscle tissue as suggested by Azzabou et al.2:
$$ S = S_f\left(f_{s,fat}\cdot\exp\left(-\frac{TE}{T2_{s,fat}}\right)+\left(1-f_{s,fat}\right)\cdot\exp\left(-\frac{TE}{T2_{l,fat}}\right) \right)+S_w\exp\left(-\frac{TE}{T2_{water}}\right)$$
Here, Sf and Sw describe the signal intensities of fat and water, respectively. As a reference, T2 of muscle tissue was determined assuming a simple mono-exponential T2 decay. For all T2 fits, the first echo was omitted to reduce the influence of stimulated echoes7. Finally, mean T2 and FF values for muscle tissue were determined, and results were compared to T2 maps generated directly by the MR scanner.
Results
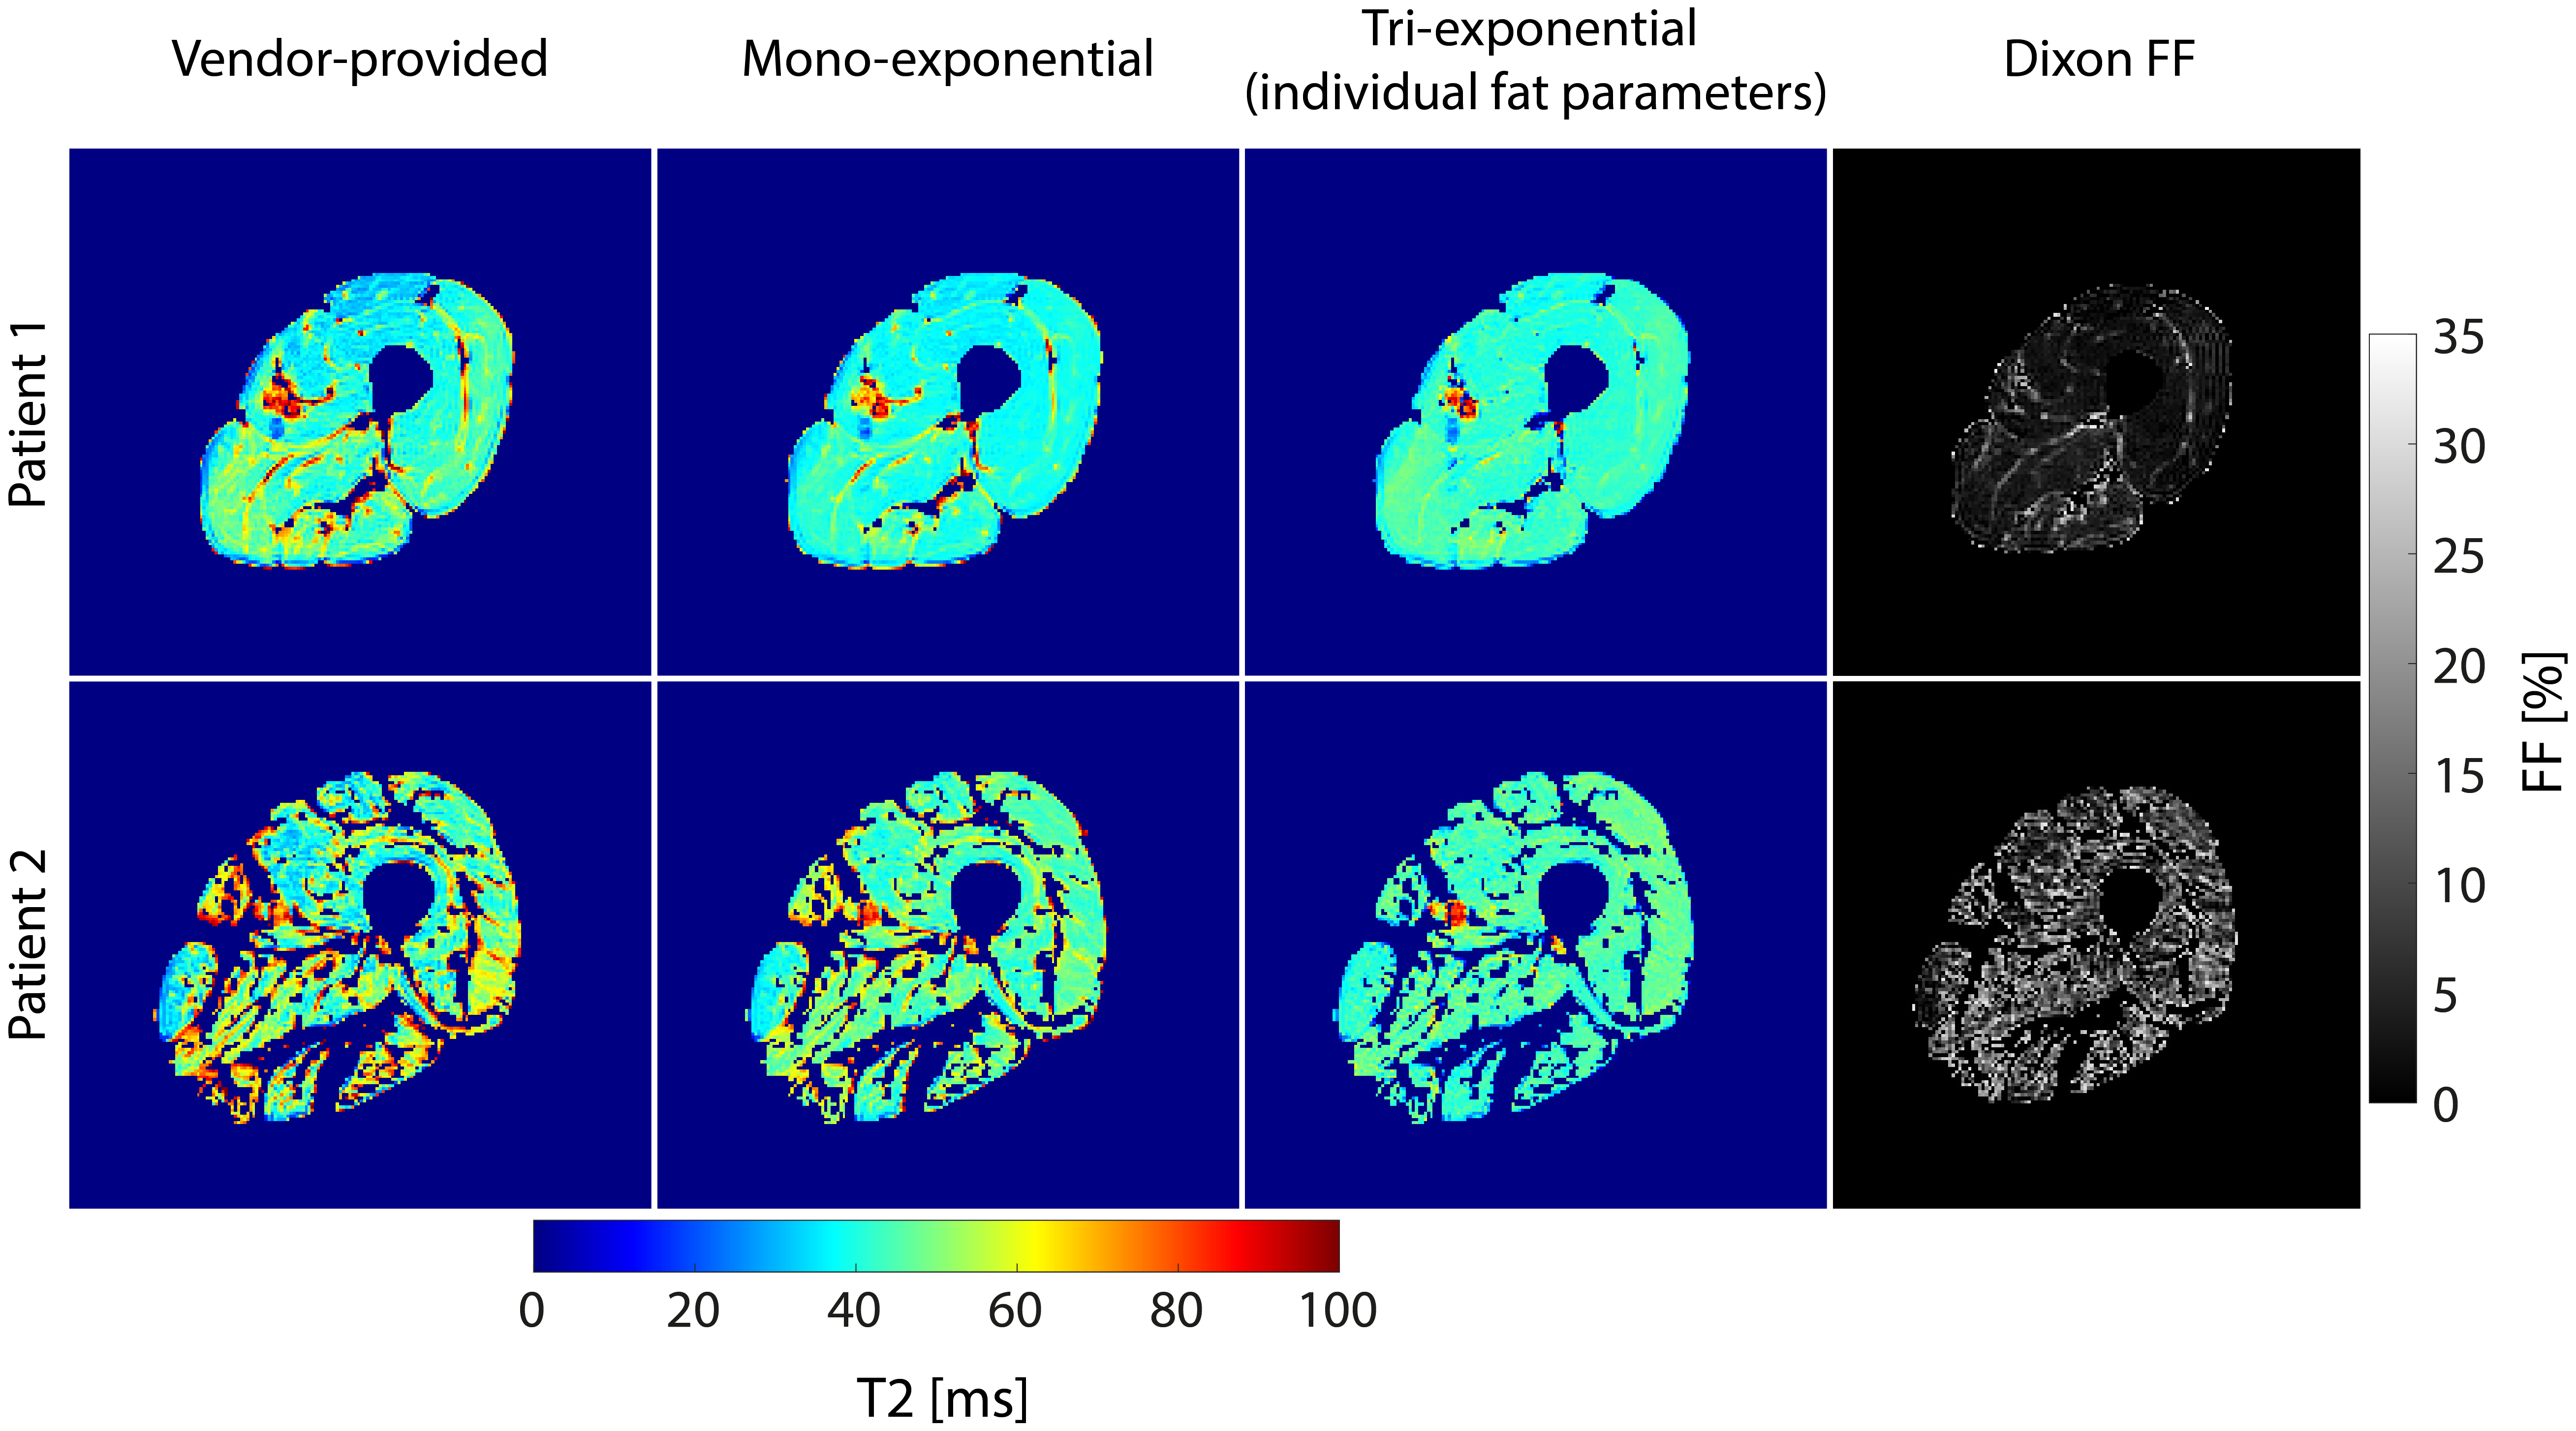
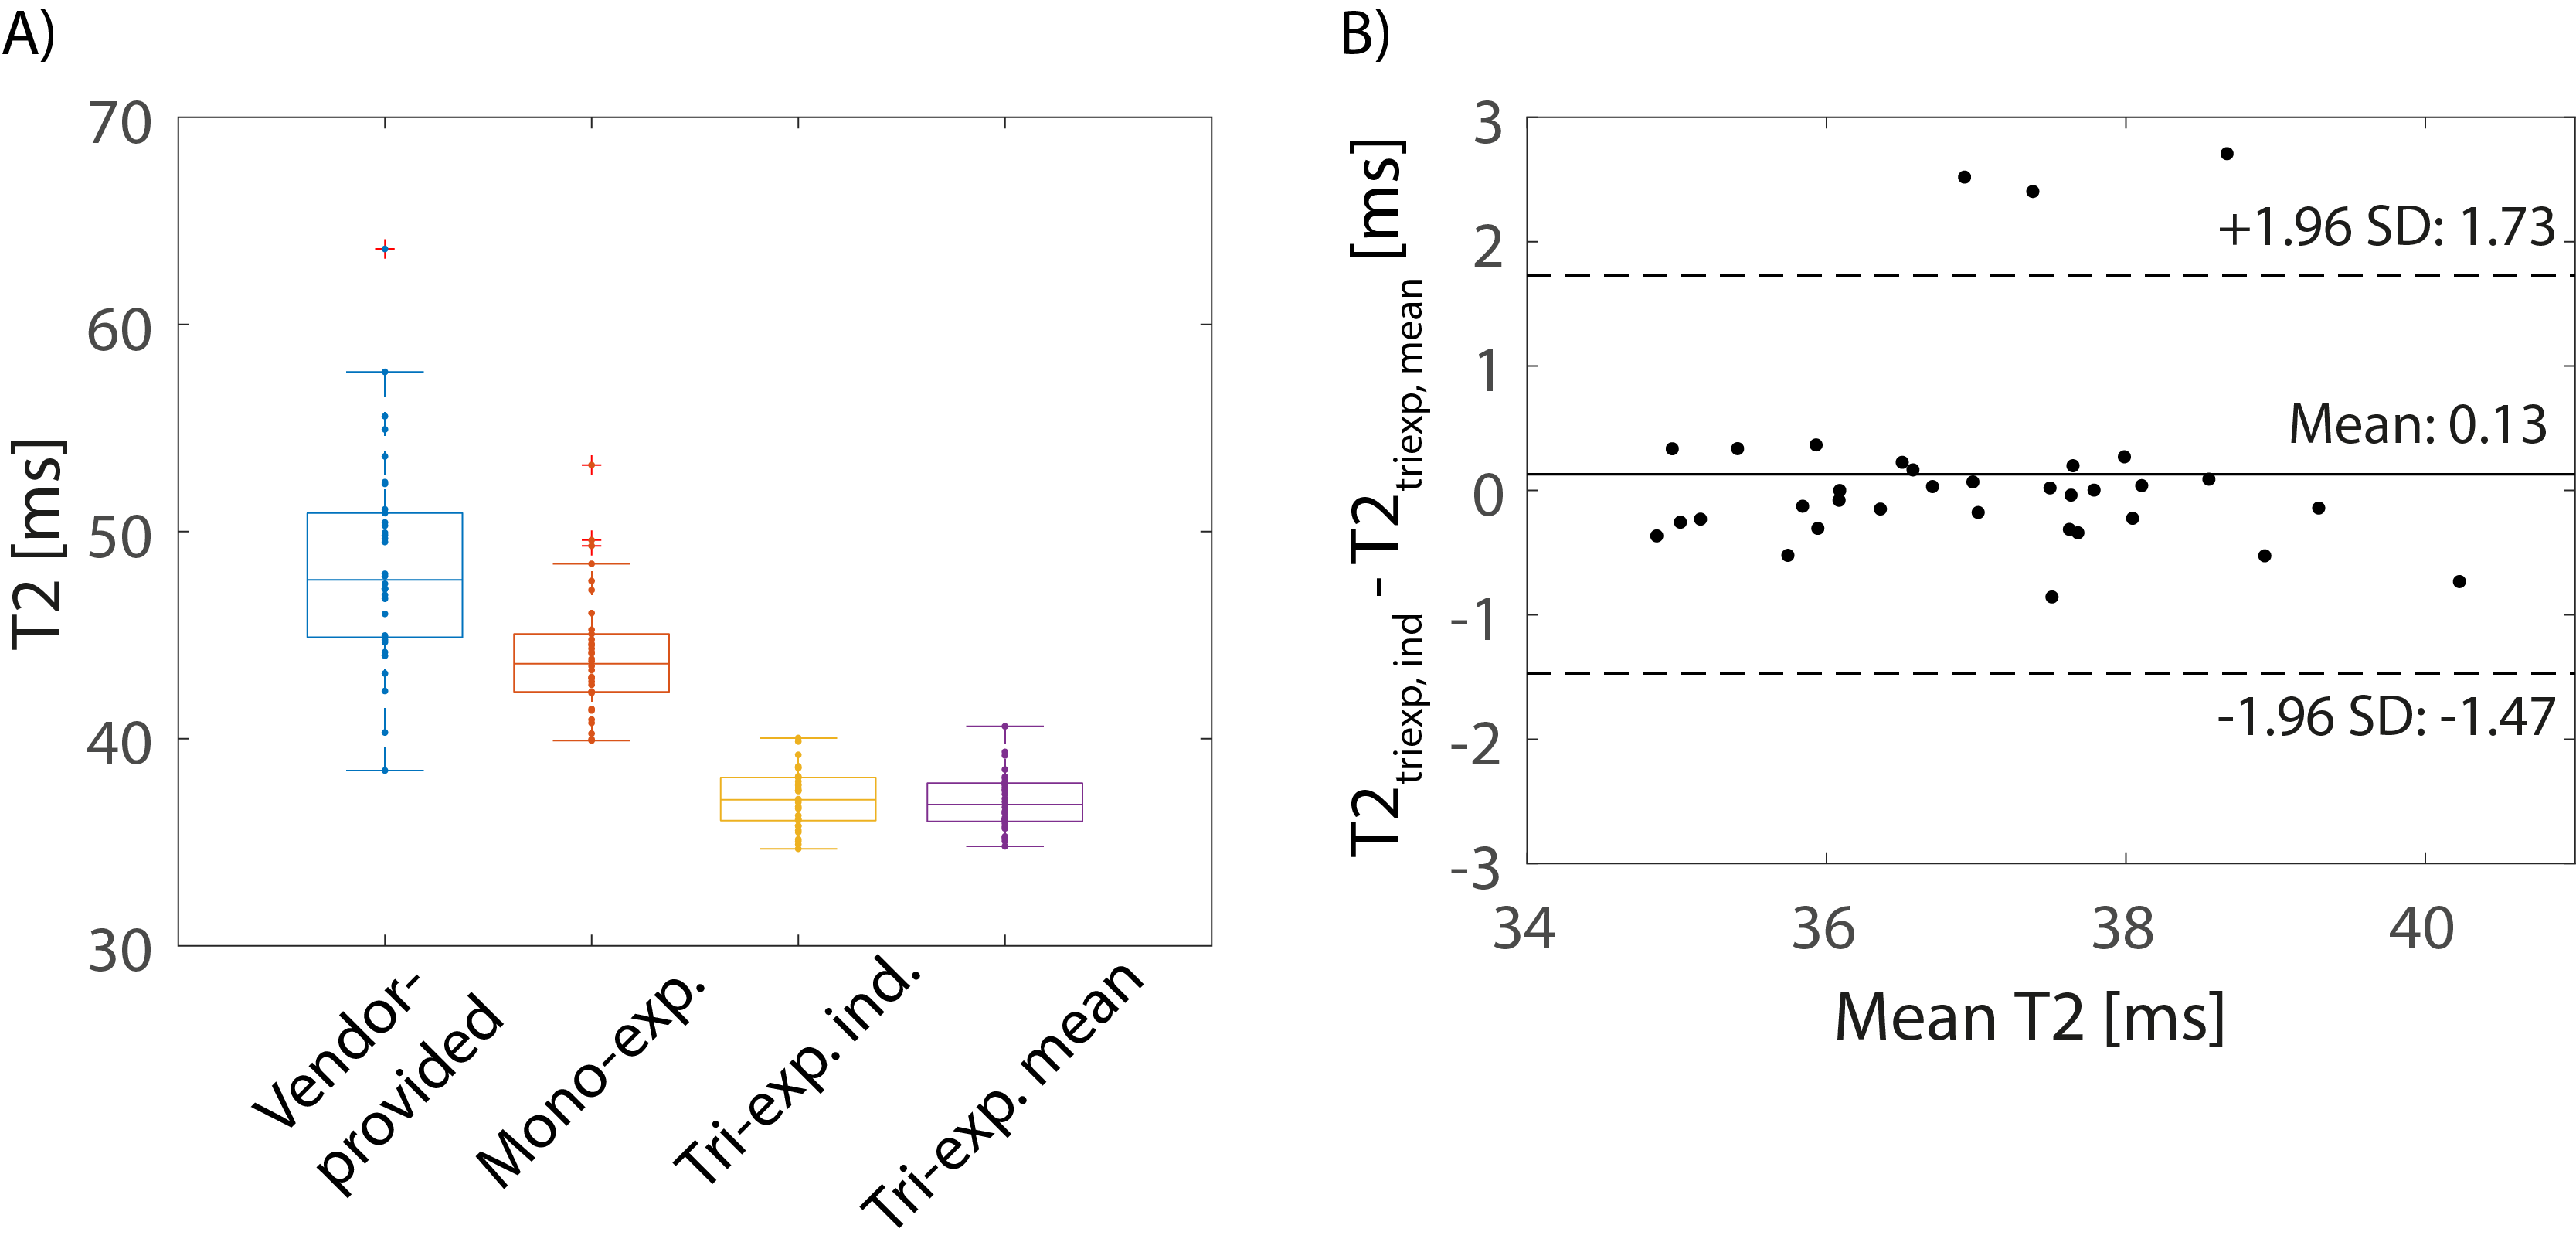
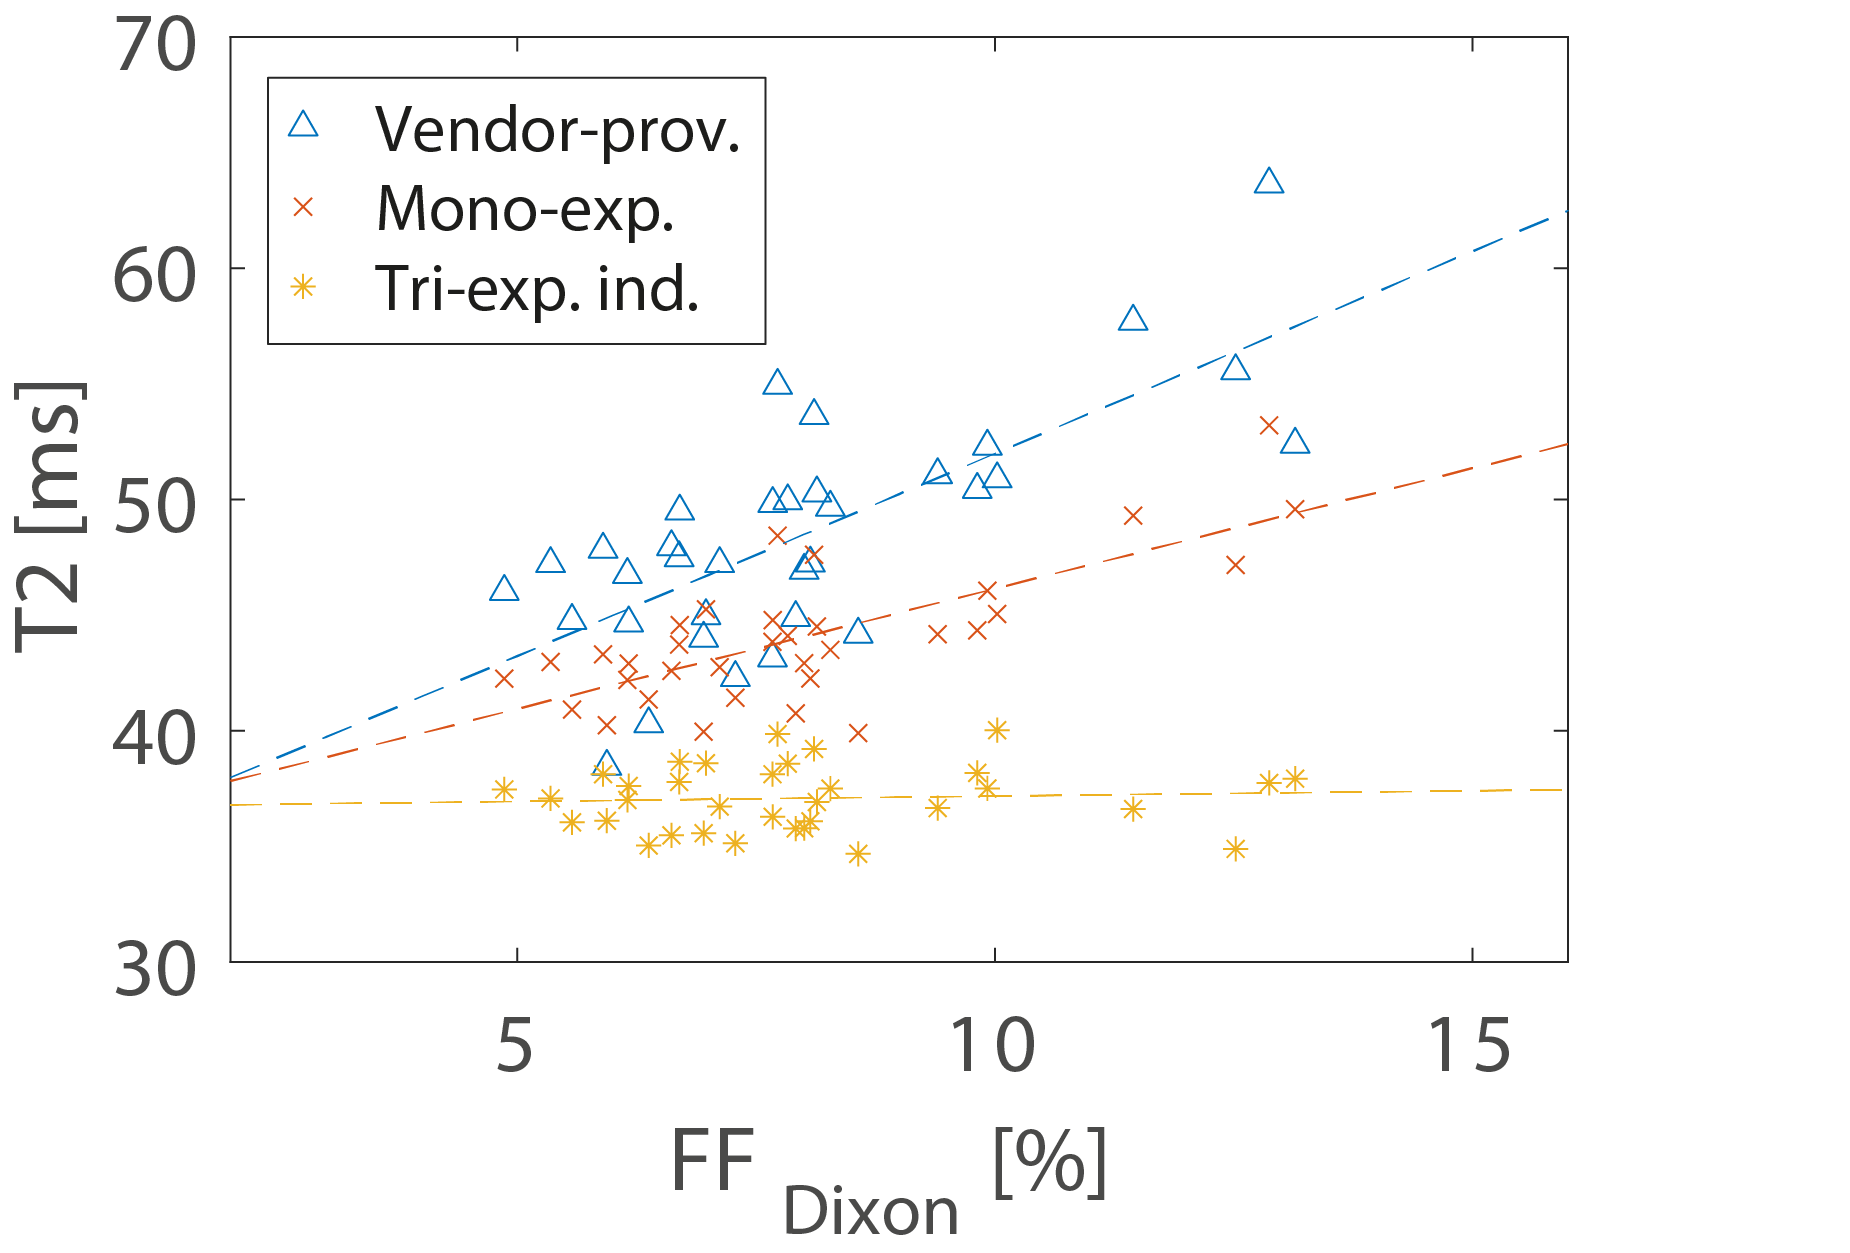
Exemplary masks for SAT and muscle tissue together with the corresponding SAT T2 decay curve are shown in Figure 1. Mean fat T2 relaxation parameters over all patients were T2s,fat = 63.3±2.5 ms, T2l,fat = 205±3.8 ms and fs,fat = 0.54±0.01. All subjects had an intramuscular FF<15%. Figure 2 shows exemplary T2 maps for two subjects, one with low and one with elevated intramuscular FF (mean FF = 4.9/13.1%), together with corresponding FF maps. Overall, T2 values determined by the vendor software were strongly enhanced compared to custom T2 fitting routines (ANOVA, p<0.001, see Fig. 3) and were also highly correlated with Dixon FF (Pearson R=0.73, compare Fig. 4). Moreover, mono-exponentially fitted T2 values were significantly higher than tri-exponentially fitted values (p<0.001) and also showed a strong correlation with Dixon FF (R=0.73). No correlation with FF was found for the tri-exponentially determined T2 values (R=0.07). As fat relaxation parameters did not vary strongly between subjects, tri-exponential fitting was additionally performed using the mean fat values instead of the individual ones. Resulting T2 values of mean and individual fat parameters were in good accordance (compare Fig. 3b).Discussion
As previously reported for patients with muscular dystrophies1,2, a strong influence of the FF on resulting T2 values in thigh muscle of osteosarcopenia patients was found. Particularly, vendor-provided T2 maps showed strongly elevated T2 values, which were highly correlated with muscular FF. Thus, to correctly assess muscular T2 and gain additional information to FF, a custom T2 fit considering fat infiltration is required. As relaxation properties for subcutaneous fat tissue were similar across subjects, there might be no need to determine these parameters for each subject individually, which might further facilitate evaluation. However, the applied approach did neither correct for B1 inhomogeneities nor stimulated echoes, which might influence the resulting T2 values. To face this issue, approaches applying extended phase graphs have been proposed7, which could further improve T2 results.Conclusion
Muscular T2 could be an additional biomarker in osteosarcopenia patients, for example in studies evaluating effects of training, if adequate T2 evaluation methods are applied. Using vendor-provided T2 maps however might lead to misinterpretation of T2 results and should therefore not be used to asses T2 in thigh muscles of these subjects.Acknowledgements
No acknowledgement found.References
1.Mankodi A, Azzabou N, Bulea T, et al. Skeletal muscle water T2 as a biomarker of disease status and exercise effects in patients with Duchenne muscular dystrophy. Neuromuscul Disord. 2017;27(8):705-714.
2.Azzabou N, Loureiro de Sousa P, Caldas E, Carlier PG. Validation of a generic approach to muscle water T2 determination at 3T in fat-infiltrated skeletal muscle. J Magn Reson Imaging. 2015;41(3):645-653.
3.Kemmler W, Kohl M, Frohlich M, et al. Effects of High-Intensity Resistance Training on Osteopenia and Sarcopenia Parameters in Older Men with Osteosarcopenia-One-Year Results of the Randomized Controlled Franconian Osteopenia and Sarcopenia Trial (FrOST). J Bone Miner Res. 2020;35(9):1634-1644.
4.Grimm A, Meyer H, Nickel MD, et al. A Comparison between 6-point Dixon MRI and MR Spectroscopy to Quantify Muscle Fat in the Thigh of Subjects with Sarcopenia. J Frailty Aging. 2019;8(1):21-26.
5.Chaudry O, Friedberger A, Grimm A, et al. Segmentation of the fascia lata and reproducible quantification of intermuscular adipose tissue (IMAT) of the thigh. MAGMA. 2021;34(3):367-376.
6.Ghasemikaram M, Chaudry O, Nagel AM, et al. Effects of 16 months of high intensity resistance training on thigh muscle fat infiltration in elderly men with osteosarcopenia. Geroscience. 2021;43(2):607-617.
7.Marty B, Baudin PY, Reyngoudt H, et al. Simultaneous muscle water T2 and fat fraction mapping using transverse relaxometry with stimulated echo compensation. NMR Biomed. 2016;29(4):431-443.
Figures

Fig. 1: Exemplary masks for SAT (A) and muscle tissue (B), which were calculated based on T1 TSE and Dixon MR images and co-registered to MSME MRI data. Signal intensity within SAT was averaged and a bi-exponential fit was performed to determine T2 relaxation properties for fat tissue, as shown for the given subject. Then, T2 evaluation was performed within the muscle tissue mask using either a mono-exponential or tri-exponential fit model (compare Fig. 2).

Tab. 1: MRI sequence parameters