0541
Large-scale Analysis of Meniscus Morphology as Risk Factor to Incidence of Osteoarthritis1Department of Radiology and Biomedical Imaging, University of California, San Francisco, San Francisco, CA, United States, 2University of California, Berkeley-University of California San Francisco Graduate Program in Bioengineering, Berkeley, CA, United States
Synopsis
While meniscal morphology is central to its capacity for weight distribution and stabilization in the knee joint, the relationship between the geometric shape of the meniscus and osteoarthritis is relatively unexplored. With 4,791 subjects from the Osteoarthritis Initiative, this study utilizes an automatic statistical shape modeling technique to identify variations in meniscus morphology as precursors to future development of osteoarthritis. Seven of the 20 shape features extracted were found to be significantly associated with osteoarthritis incidence. These features were further characterized with local changes in cartilage thickness across 8 years.
Introduction
The meniscus plays a crucial role in load transmission and protection of the tibiofemoral joint. Morphological meniscal features, such as tears and extrusion from the tibial plateau, are well-characterized and associated with knee osteoarthritis (OA) progression1,2; however, the relationship between the geometric shape of the meniscus and incidence of OA is unclear, despite its heavily mechanical nature. This study uses a fully automatic statistical shape modeling (SSM) technique to identify variations in meniscus morphology as precursors to the development of OA and determine local regions of longitudinal cartilage changes in relation to meniscus shapes.Methods
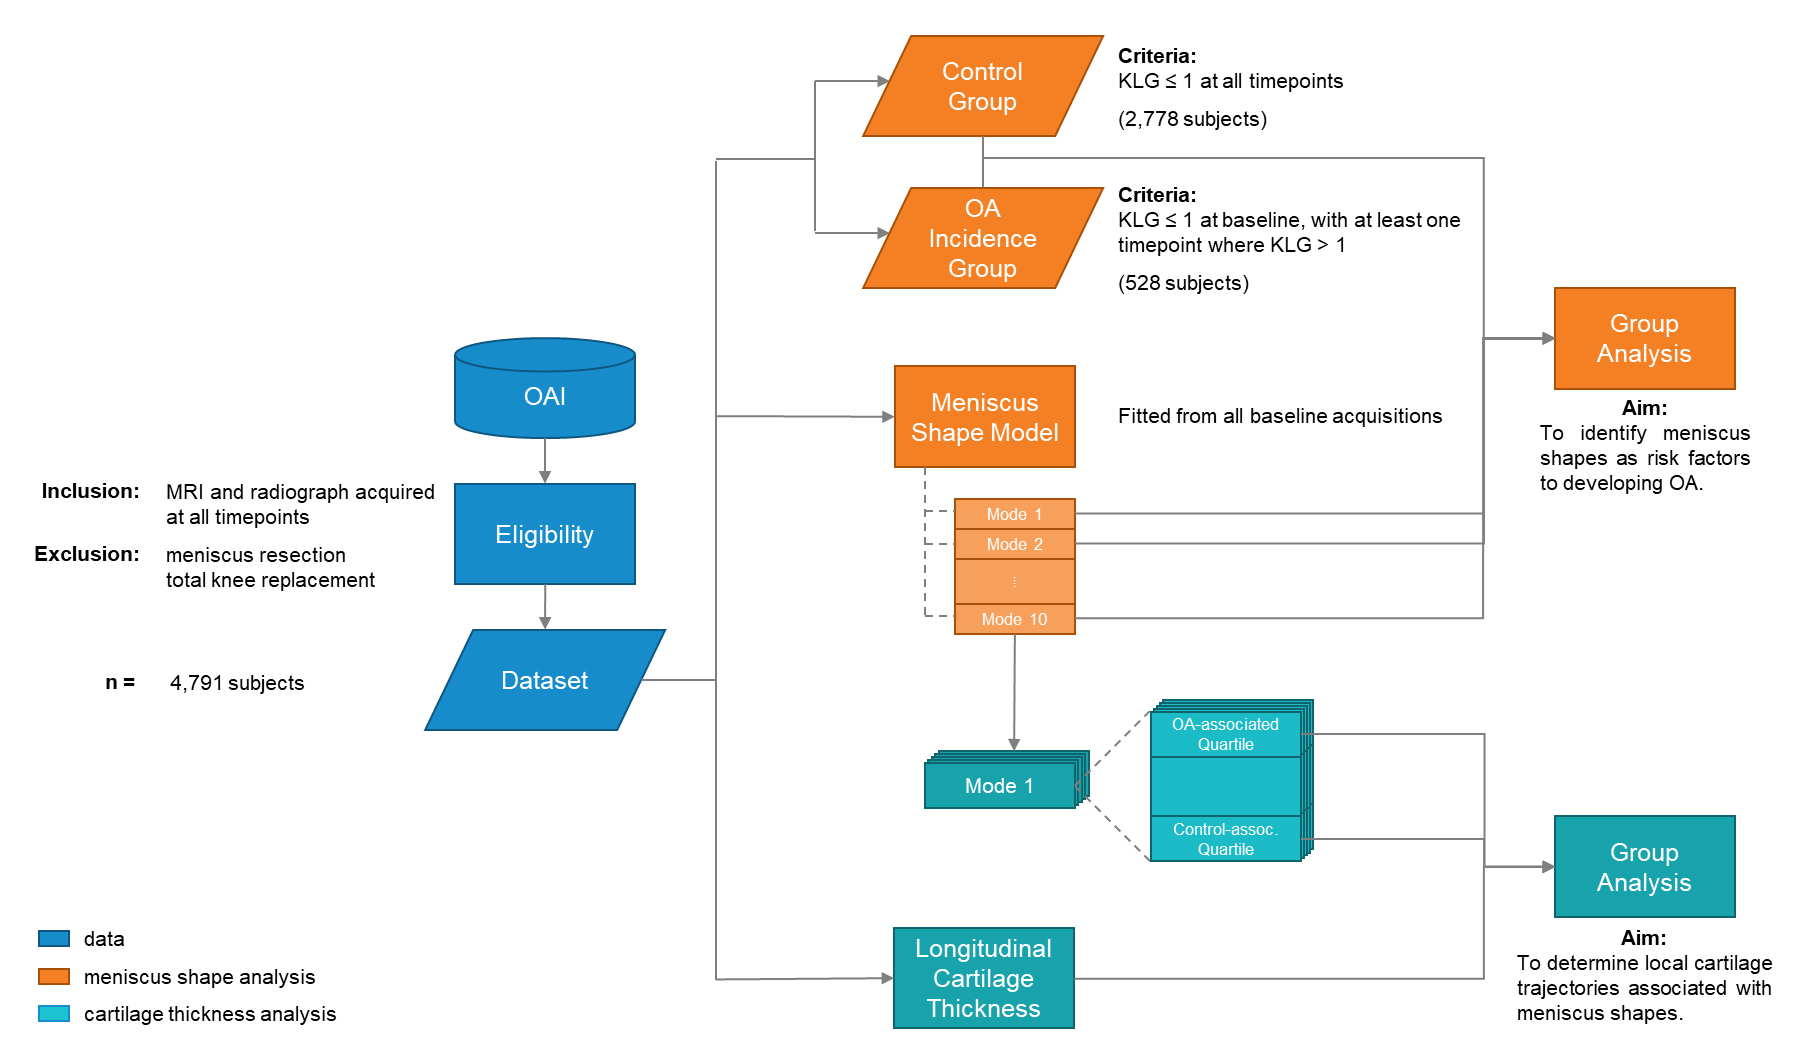
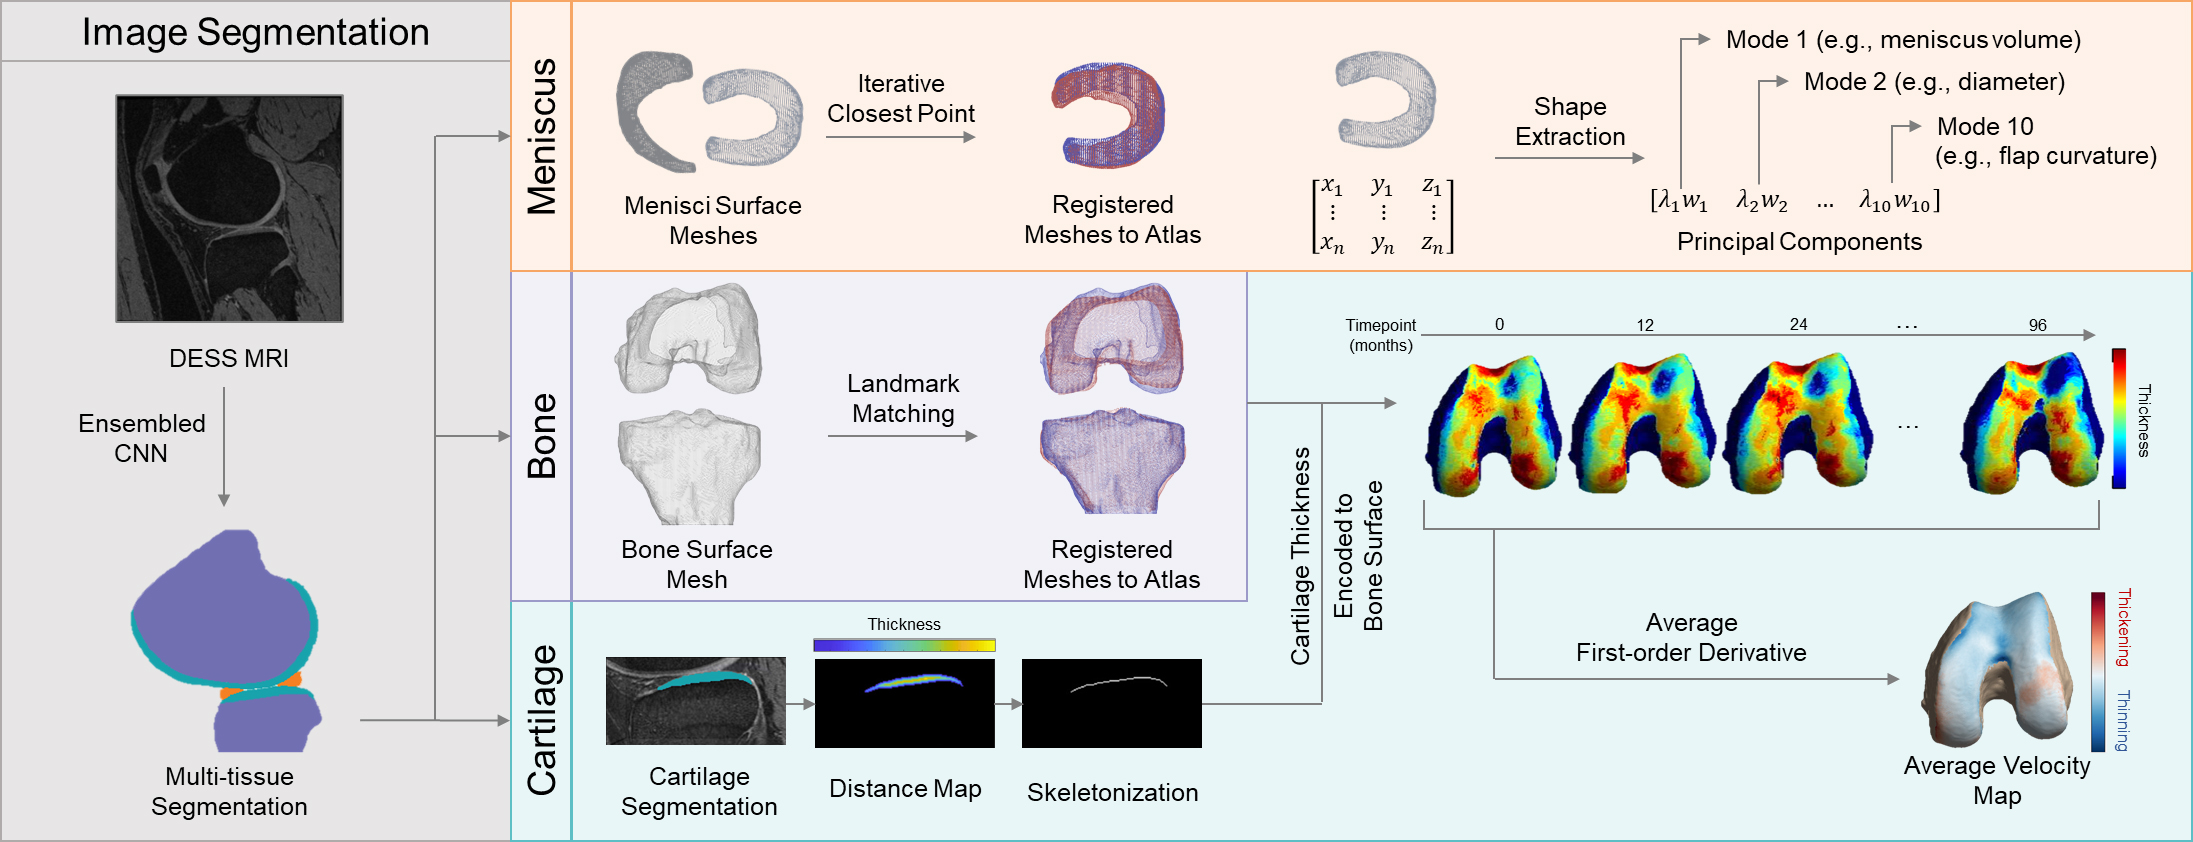
Baseline visits of the Osteoarthritis Initiative (OAI) dataset (n = 4,791 subjects) were processed to define the SSM (Fig. 1). The menisci, femur, tibia, and femoral and tibial cartilage were automatically segmented from double-echo steady-state (DESS) knee magnetic resonance images (MRI) by an ensemble of convolutional neural networks (Dice overlap of 0.874 ± 0.024, 0.972 ± 0.59, 0.973 ± 0.64, 0.890 ± 0.023, and 0.880 ± 0.036, respectively)3,4. Surface topology of the menisci and bones of each volumetric segmentation were extracted using the Marching Cubes algorithm5. Next, a healthy knee was chosen as an atlas. To align the structures of all exams to the atlas, transformation matrices were generated with the Iterative Closest Point algorithm for the menisci and a spectral correspondence matching algorithm6 for the bone. Meniscus Shape Analysis: Principal component analysis (PCA) quantitatively extracted shape features from the surface data, reducing the dimensionality of the data to the 10 principal components (“modes”) that capture the most geometric variance. This methodology is summarized in Fig. 2. Two groups were constructed for statistical analysis: a) Control (2,778 subjects; 1,536 female, age = 62 ± 17, body mass index [BMI] = 31.8 ± 14.9 kg/m2): knees with Kellgren-Lawrence grade (KLG) of 0 or 1 throughout participation in the OAI, and b) OA Incidence (528 subjects; 383 female, age = 62 ± 17, BMI = 31.2 ± 12.6 kg/m2): knees with KLG of 0 or 1 at baseline and subsequent development of OA (KLG > 1) within 8 years. Group analysis was performed using one-way analysis of covariance and least-squares mean, controlling for age, sex, race, and BMI, to determine shape features significantly associated (p < 0.005) with OA incidence. Cartilage Thickness Analysis: Cartilage thickness values were encoded to points on the subchondral bone surface by applying a Euclidean distance transform to the cartilage segmentation3. In each subject, a velocity map was derived by averaging the first-order time derivative across the 7 timepoints. To determine the relationship between meniscus shape and local cartilage thickness changes, subjects were partitioned to a Control-associated quartile or OA Incidence-associated quartile for each mode and group analysis was subsequently performed.Results
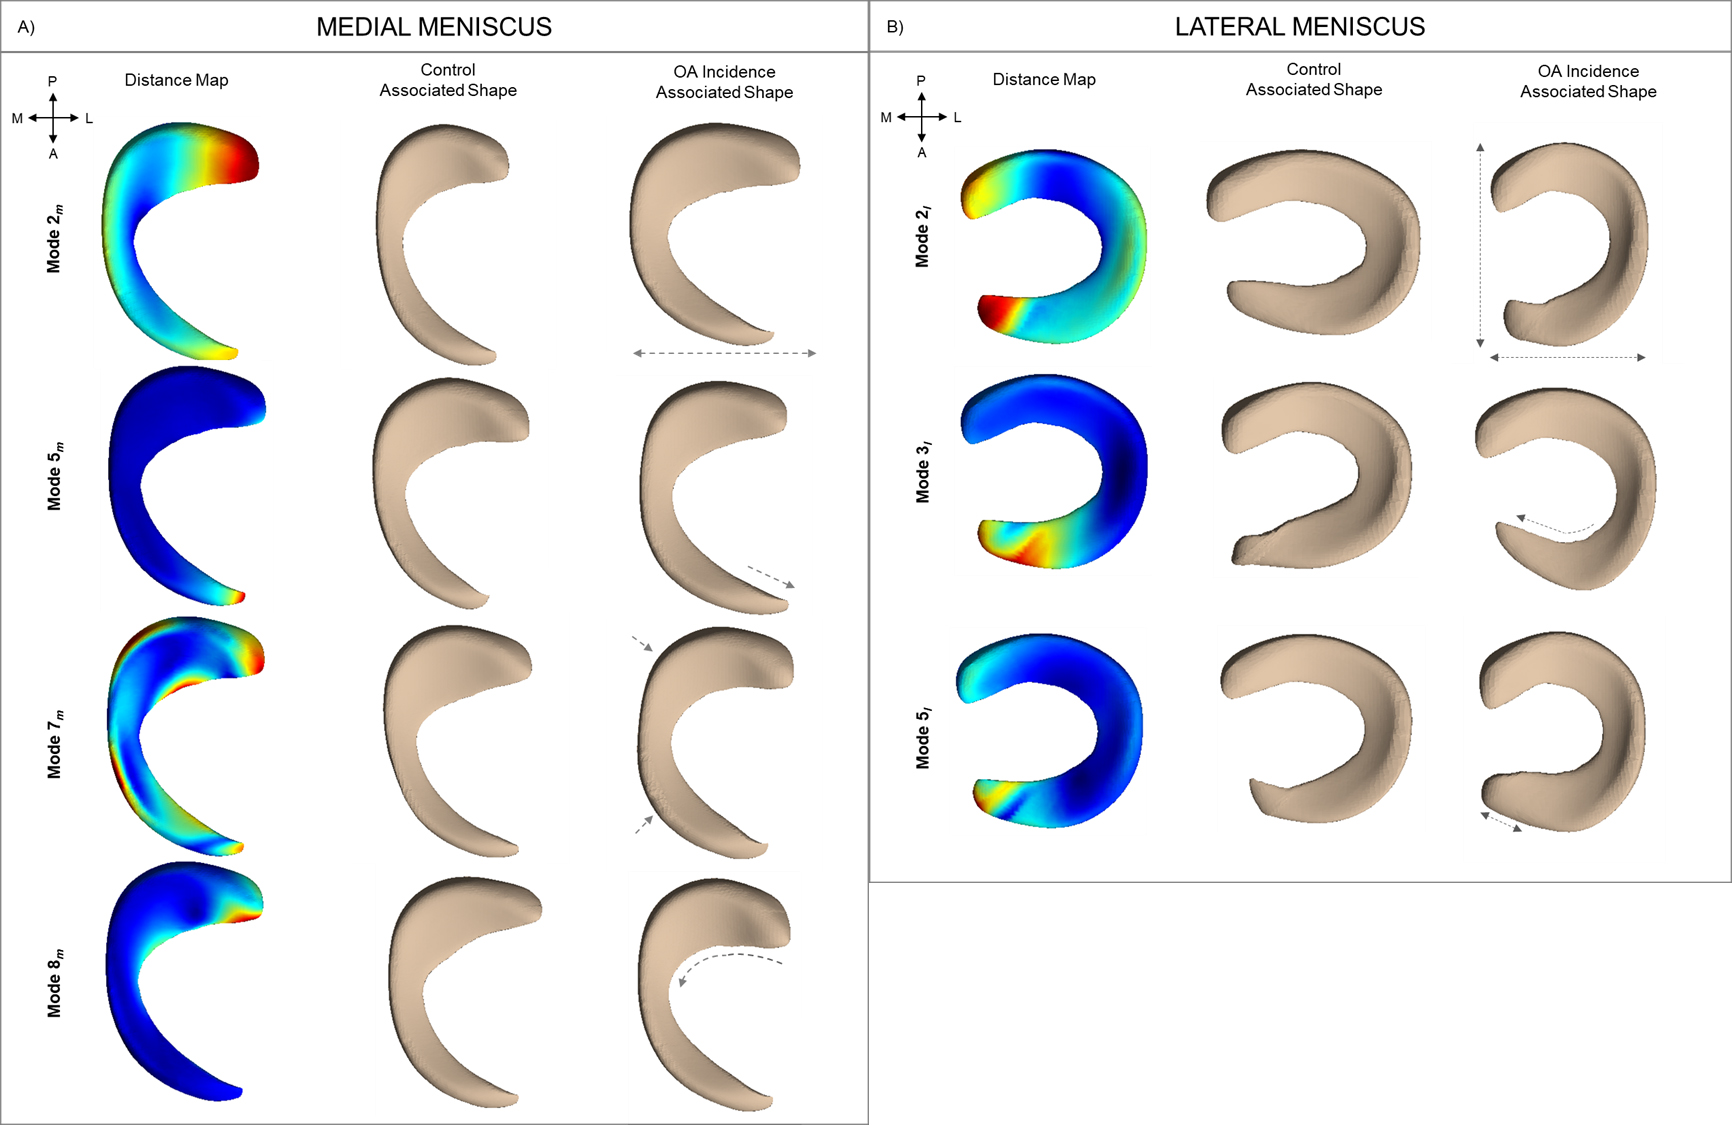
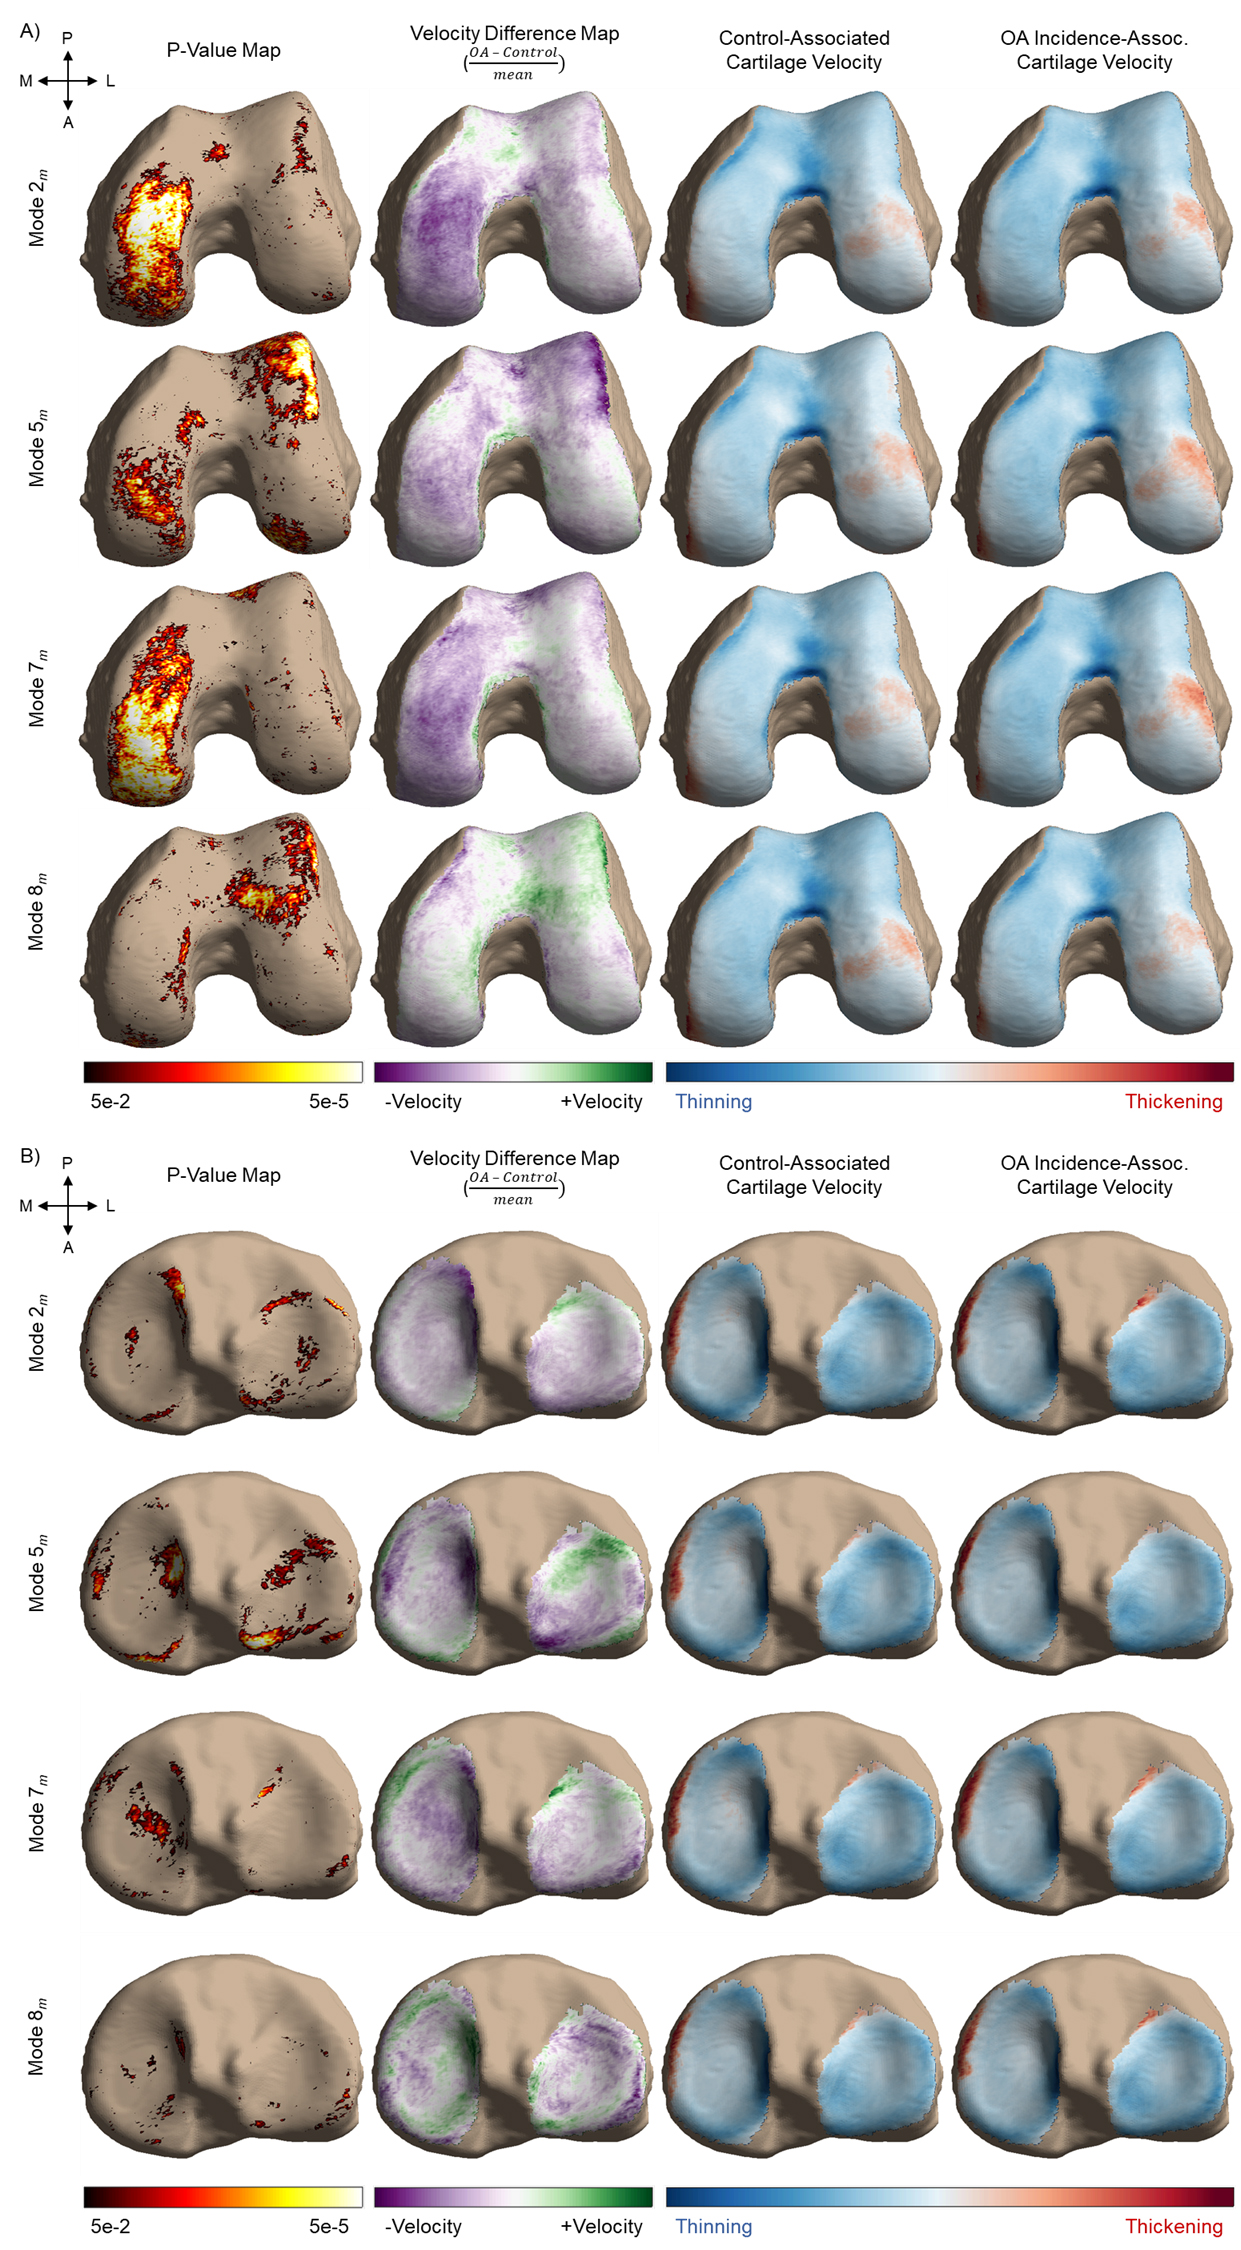
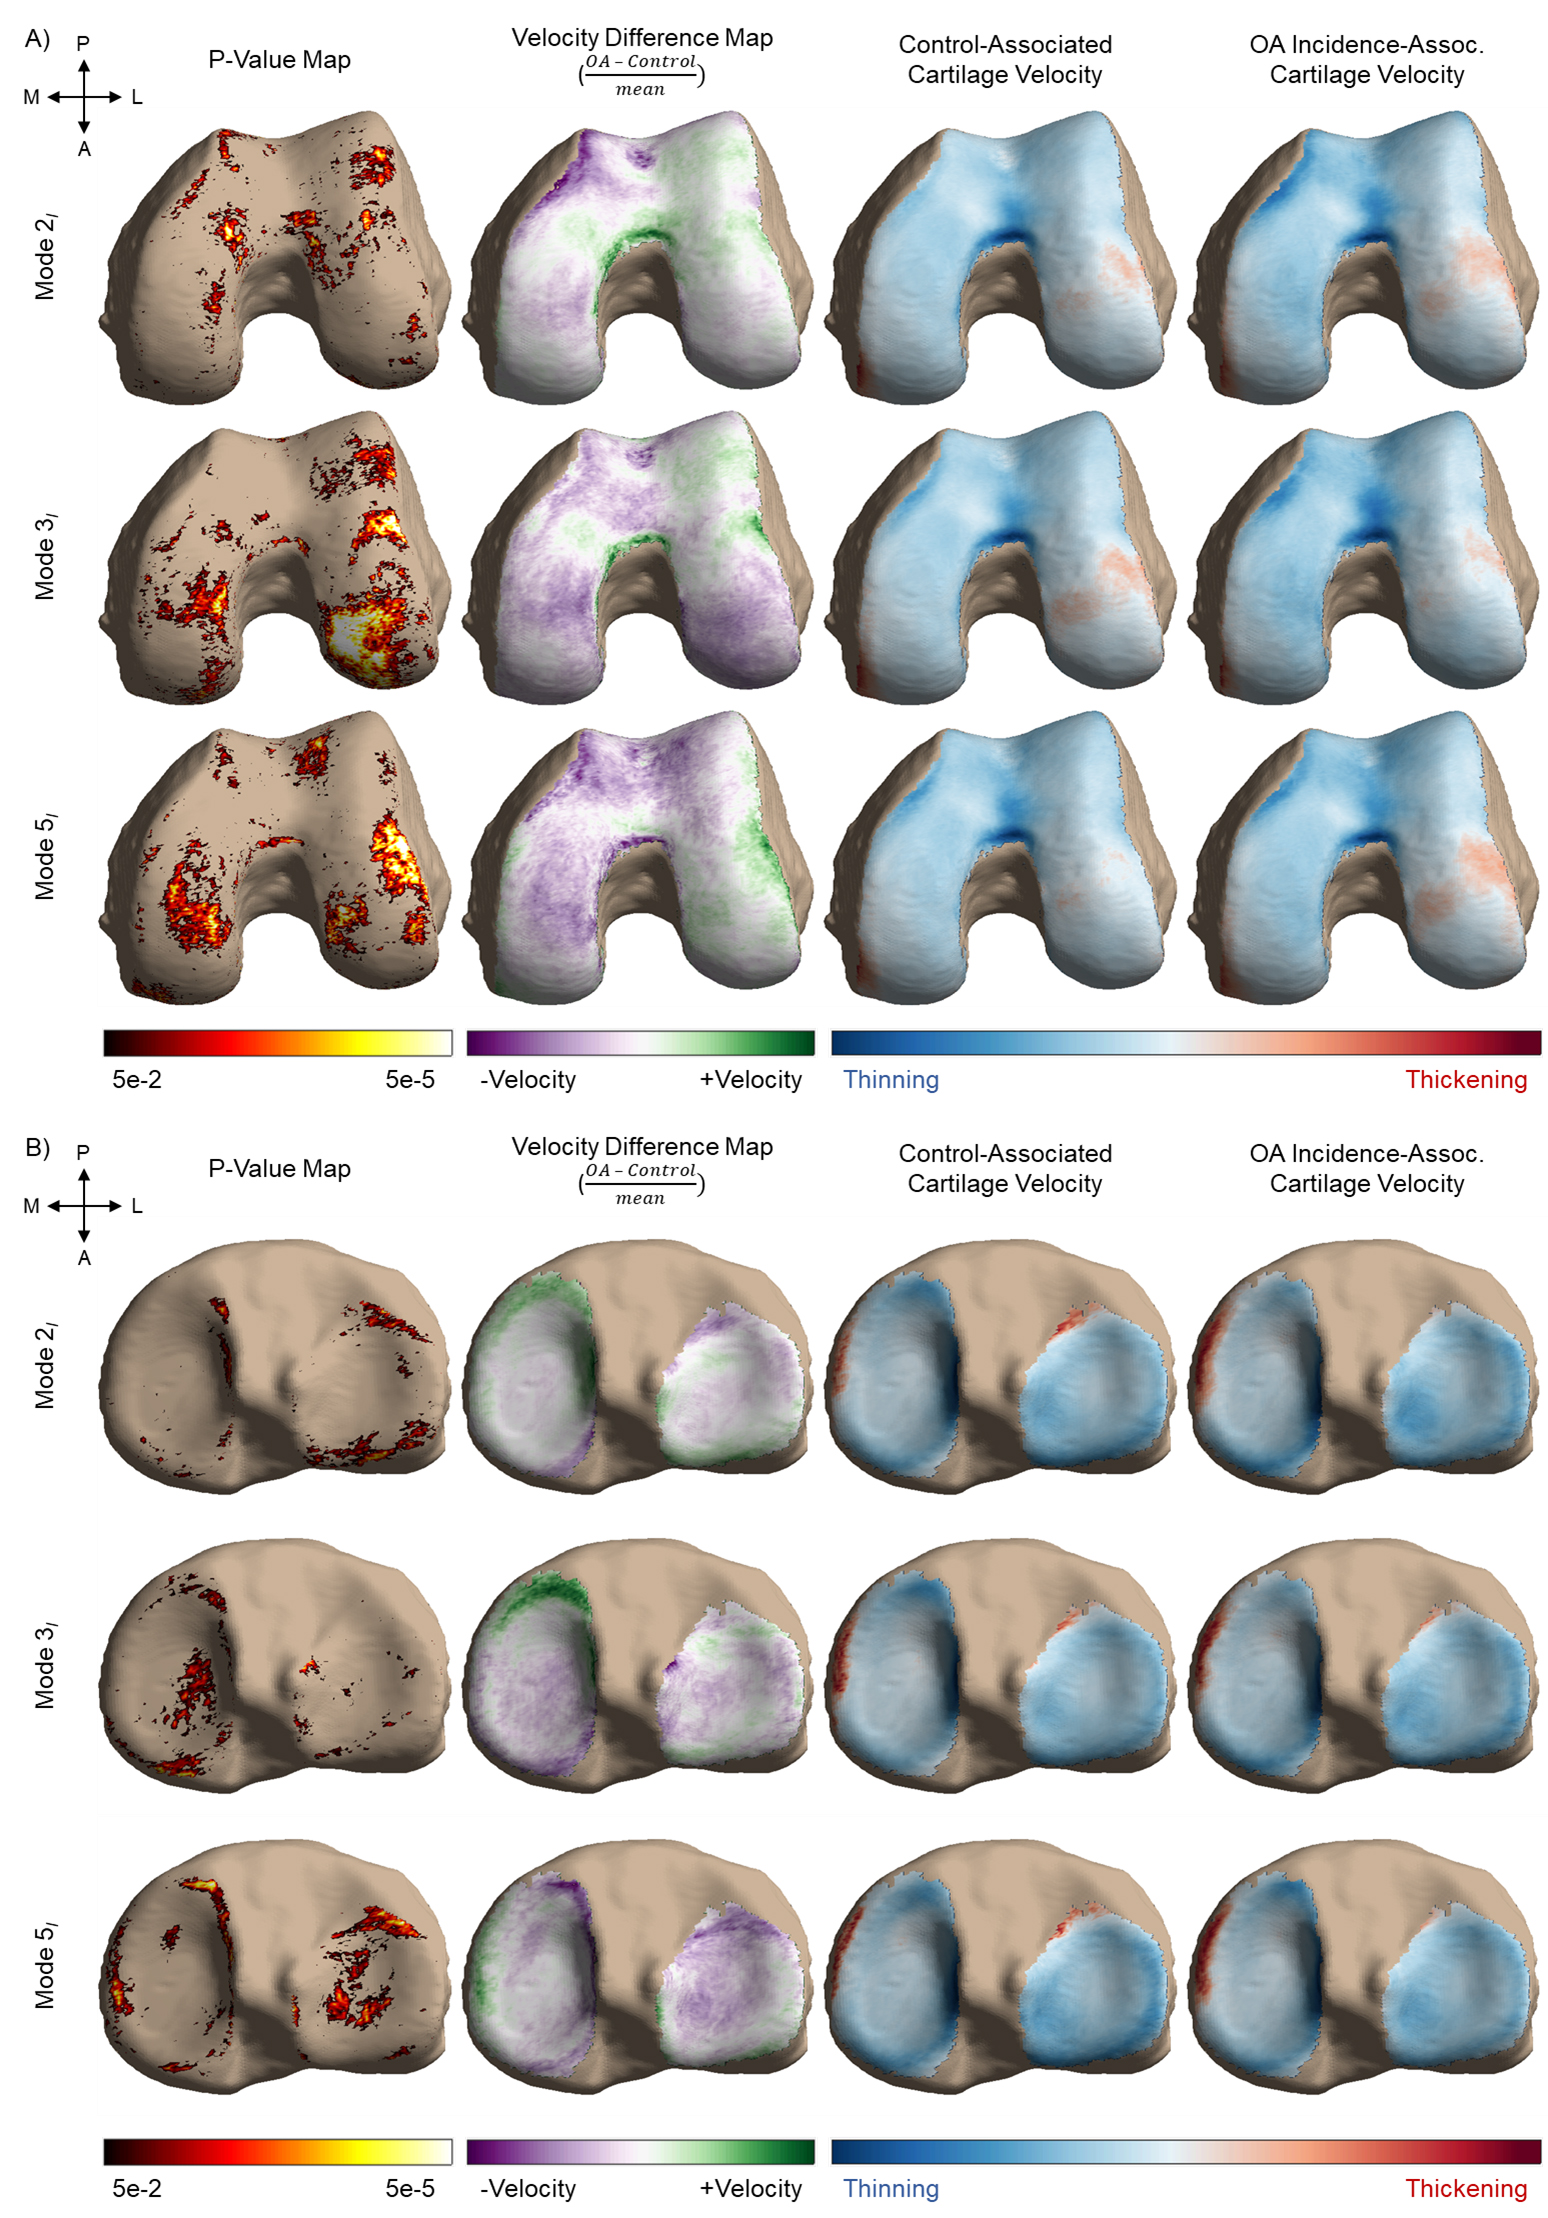
Four of ten modes that describe medial meniscus shape and three of ten modes that describe lateral meniscus shape were significantly different between the control and OA incidence groups (Fig. 3). Features of the medial meniscus that characterized the OA incidence group were described as wider overall structure (mode 2m: p < 0.001; % variance = 5.82%), longer anterior root (mode 5m: p < 0.001; % variance = 1.28%), flaring of the outer wall (mode 7m: p < 0.001; % variance = 0.73%), and increased concavity of the posterior flap (mode 8m: p < 0.001; % variance = 0.65%). While for the lateral meniscus, we observed the following in the OA incidence group: larger length-width ratio (mode 2l: p < 0.001; % variance = 11.37%), inward angling (mode 3l: p < 0.001; % variance = 6.99%) and increased length of the anterior horn (mode 5l: p < 0.001; % variance = 2.17%). In total, the modes captured 90.17% and 87.71% of the variance of the medial and lateral menisci geometry, respectively. Local changes in cartilage thickness with relation to meniscus shape are depicted in Figs. 4 and 5.Discussion
To our knowledge, this is the largest assessment of meniscus shape and the first to utilize a fully automated methodology. This application of SSM is a data-driven, exploratory technique that identified shape features pertaining to OA incidence on a large scale. The models are compact, as 10 modes are sufficient to reconstruct approximately 90% of the dataset variance. Modes that demonstrate the most variance were related to length-width ratios in both medial and lateral menisci, though to opposite effects. This may be related to a disproportion of medial compartment OA and resultant bulging in the lateral meniscus. Overall, medial shape features were generally related to meniscal coverage, while lateral features were largely directed at the anterior horn. Local cartilage thickness analysis related strongly to the meniscus shapes. Menisci features associated with decreased medial coverage were linked to significantly increased cartilage thinning in the medial condyle. Modes that describe either the anterior or posterior horns (5m, 3l) may disrupt anterior-posterior balance, as seen in the longitudinal cartilage trajectories, particularly in the tibia. Future analysis will investigate associations with meniscal extrusion, and stratification of medial and lateral compartment OA.Conclusion
This study identifies meniscus shapes strongly associated with future development of osteoarthritis. These findings may uncover further relationships between meniscal morphology, biomechanics, and knee joint degeneration.Acknowledgements
This work is supported by the National Institute of Arthritis and Musculoskeletal and Skin Diseases (grant #s: R00AR070902 and R33AR073552).References
1. Berthiaume MJ, Raynauld JP, Martel-Pelletier J, et al. Meniscal tear and extrusion are strongly associated with progression of symptomatic knee osteoarthritis as assessed by quantitative magnetic resonance imaging. Ann Rheum Dis. 2005;64(4):556-63.
2. Kawahara T, Sasho T, Ohnishi T, et al. Stage-specific meniscal features predict progression of osteoarthritis of the knee: a retrospective cohort study using data from the osteoarthritis initiative. BMC Musculoskelet Disord. 2019;20(33).
3. Iriondo C, Liu F, Calivà F, et al. Towards understanding mechanistic subgroups of osteoarthritis: 8-year cartilage thickness trajectory analysis. J Orthop Res. 2021;39(6):1305-17.
4. Morales Martinez A, Calivà F, Flament I, et al. Learning osteoarthritis imaging biomarkers from bone surface spherical encoding. Magn Reason Med. 2020;84(4):2190-203.
5. Lorensen WE, Cline HE. Marching cubes: a high resolution 3D surface construction algorithm. SIGGRAPH ’87. 1987.
6. Lombaert H, Grady L, Polimeni JR, et al. FOCUSR: feature oriented correspondence using spectral regularization—a method for precise surface matching. IEEE Trans Pattern Anal Mach Intell. 2013;35(9):2143-60.
Figures